The $75 line in the sand: Hyperliquid approaches a key decision point

ambcrypto發佈於 2026-07-03更新於 2026-07-03

文章摘要

Bitcoin and most altcoins have been in a downtrend since October 2025, with recent gains seen as minor bounces. However, Hyperliquid (HYPE), a large-cap DEX token, has maintained a strong long-term bullish trend for over a year. Trading around $70.11, it was up 74% annually. On the weekly chart, the RSI shows potential for a bearish divergence if prices push past $72.1. Currently, HYPE trades within a one-month range of $53.35 to $74.78, having recently moved above key resistance levels. Despite some whale profit-taking, steady buying pressure, a rising OBV, and an RSI above 50 suggest upside momentum toward the critical $75 supply zone. For swing traders, the optimal risk/reward entry is not yet present. The key action will be a decisive breakout above or a bearish rejection from $75, which would signal the next major directional move.

Since October 2025, Bitcoin [BTC] and most of the altcoins have been trending downward. Many alts, even prominent ones, never really got a long-term uptrend going. The price gains in the past couple of days for BTC and other tokens were only a bounce within a downtrend.

Hyperliquid [HYPE] was one of the large-cap tokens whose long-term trend was firmly bullish.
Source: HYPE/USDT on TradingView

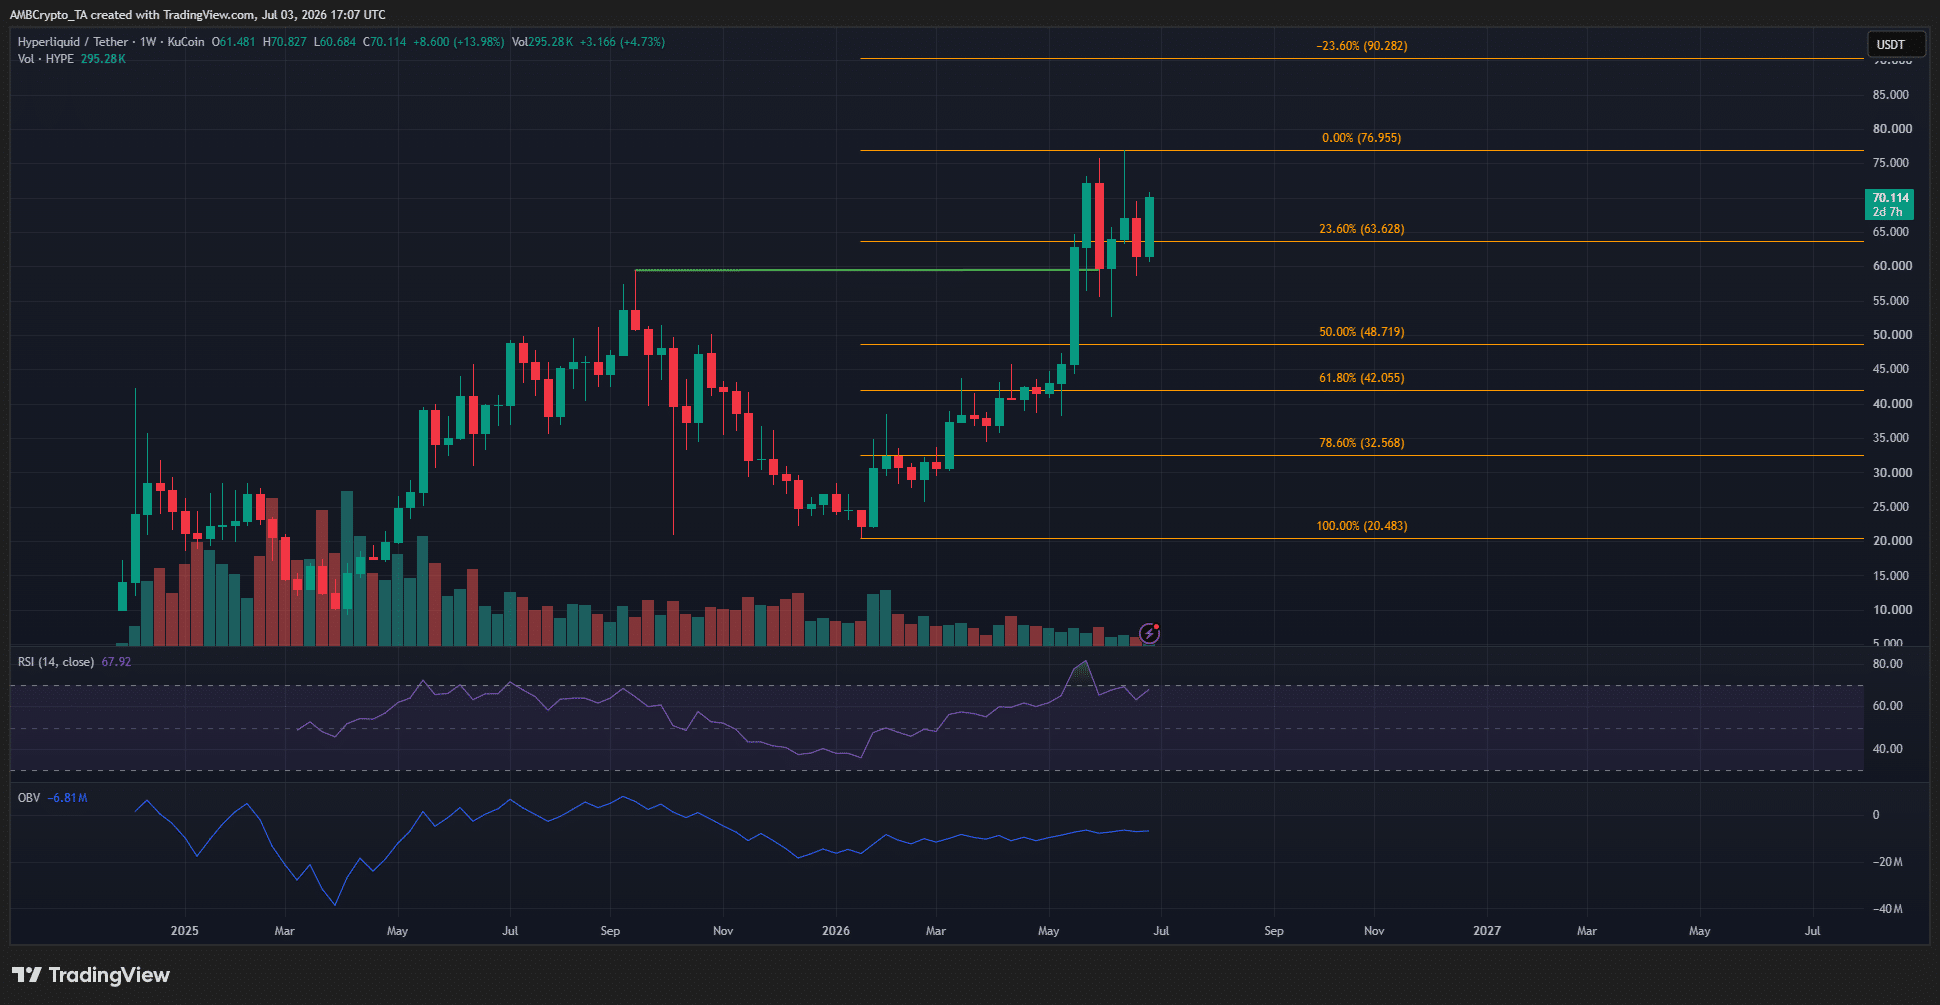
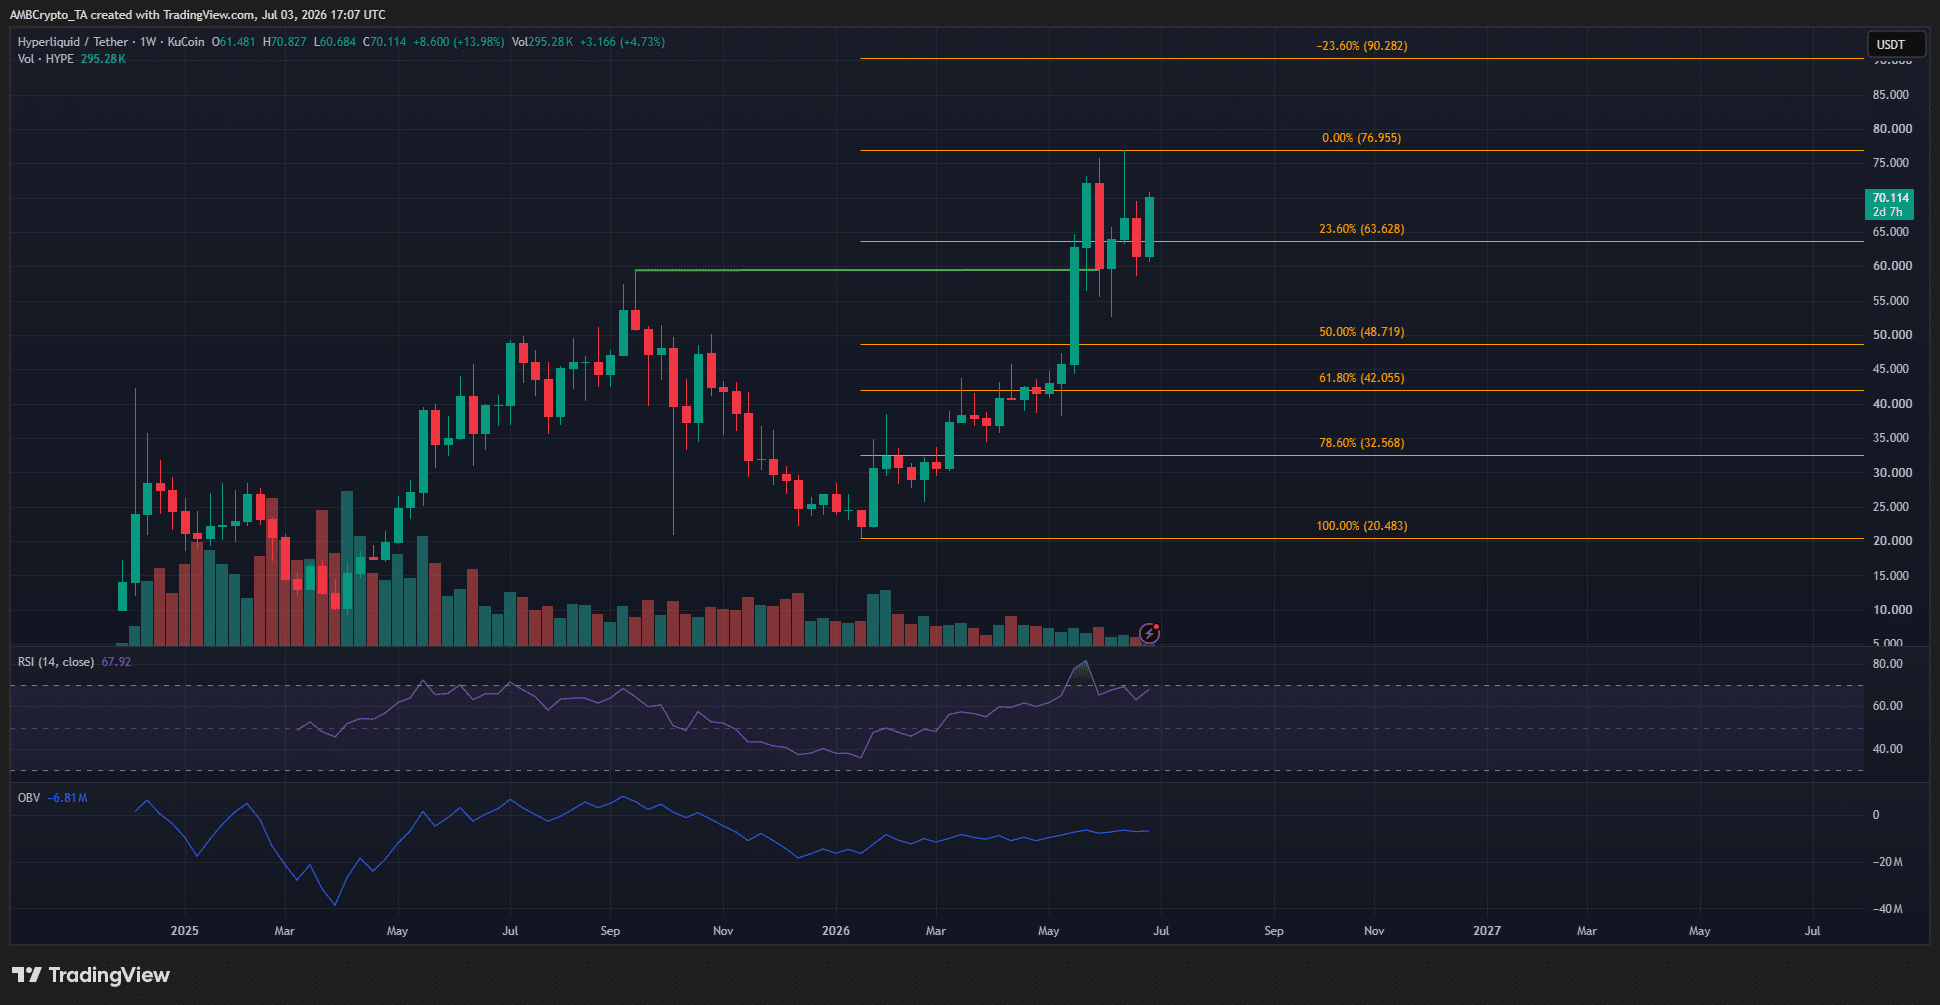
As the 1-week chart above highlights, the swing structure has been bullish for more than a year. It was trading at $70.11, and was up 7.51% in the past week and over 74% up in a year.

This cemented the long-term bullish trend, but the RSI was forming lower highs in recent weeks while HYPE bulls tried to push prices to new highs. Hence, a weekly session move beyond $72.1 would present a bearish divergence, though it doesn’t guarantee an immediate correction.

Here’s what traders and investors can expect from Hyperliquid token’s price action.

HYPE price prediction for July
Source: HYPE/USDT on TradingView

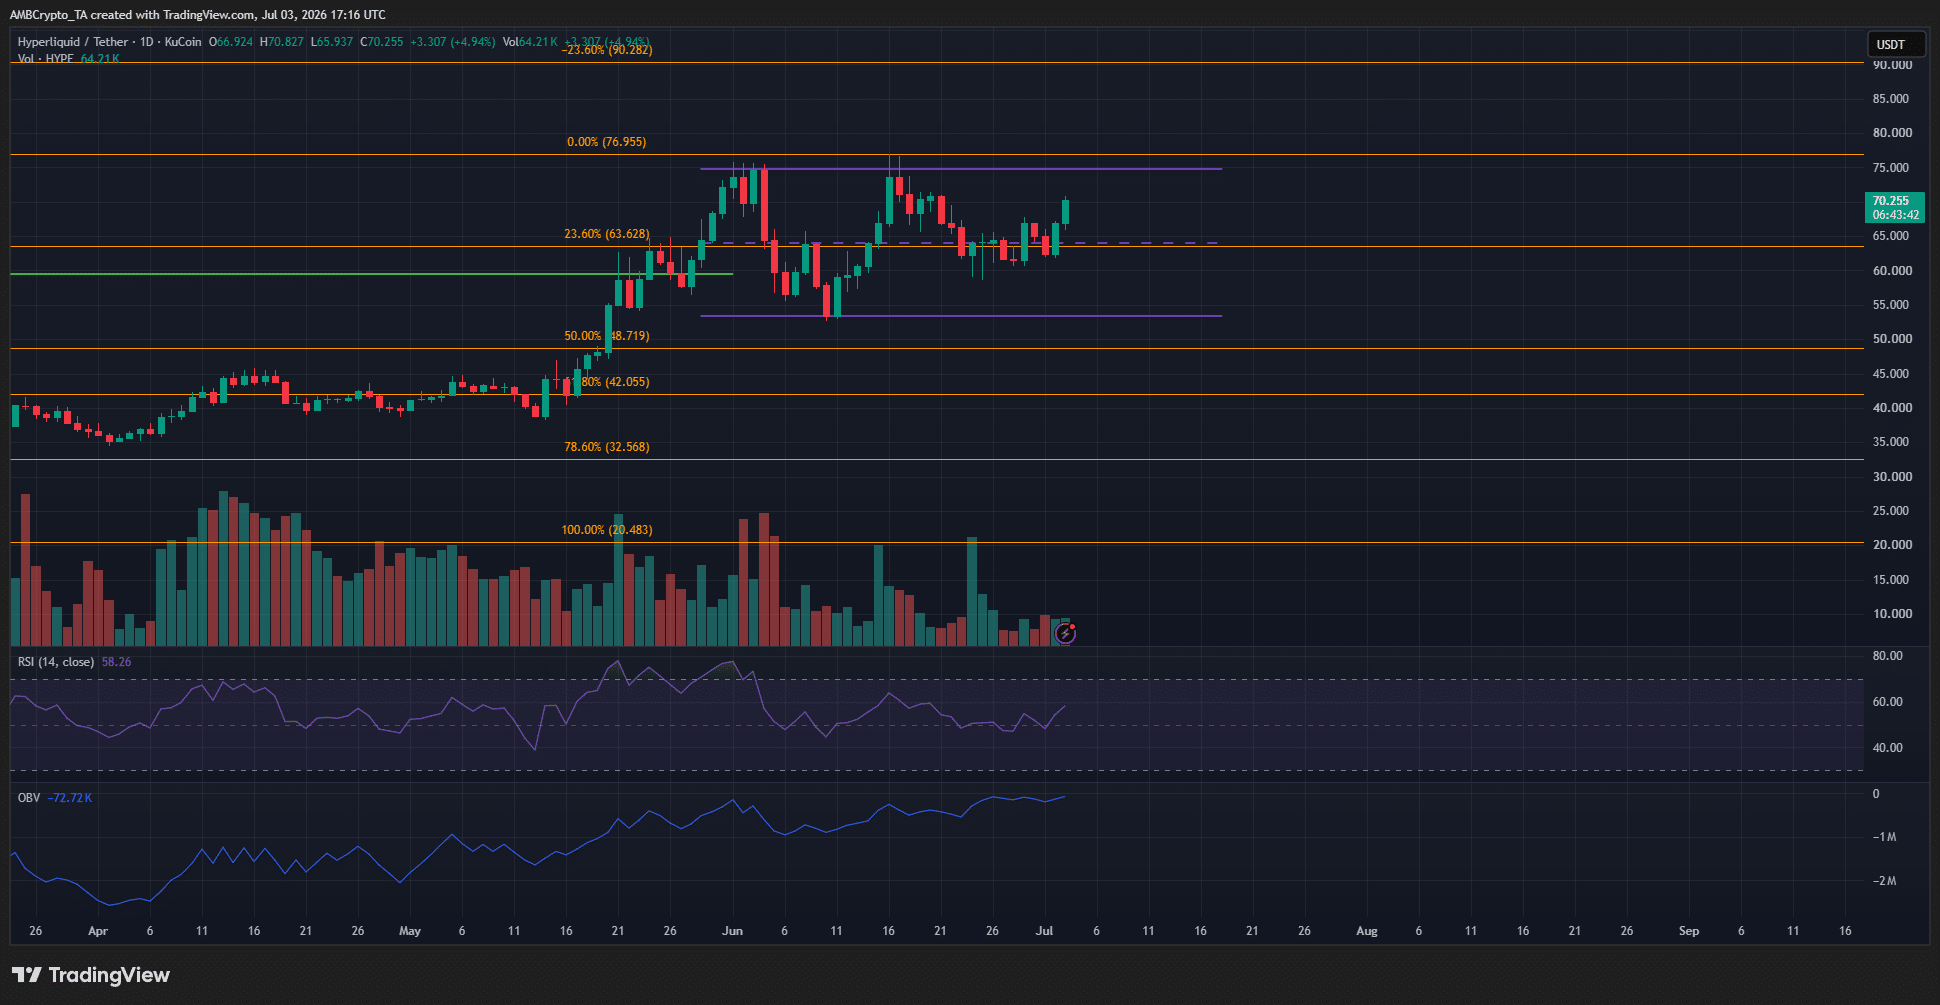
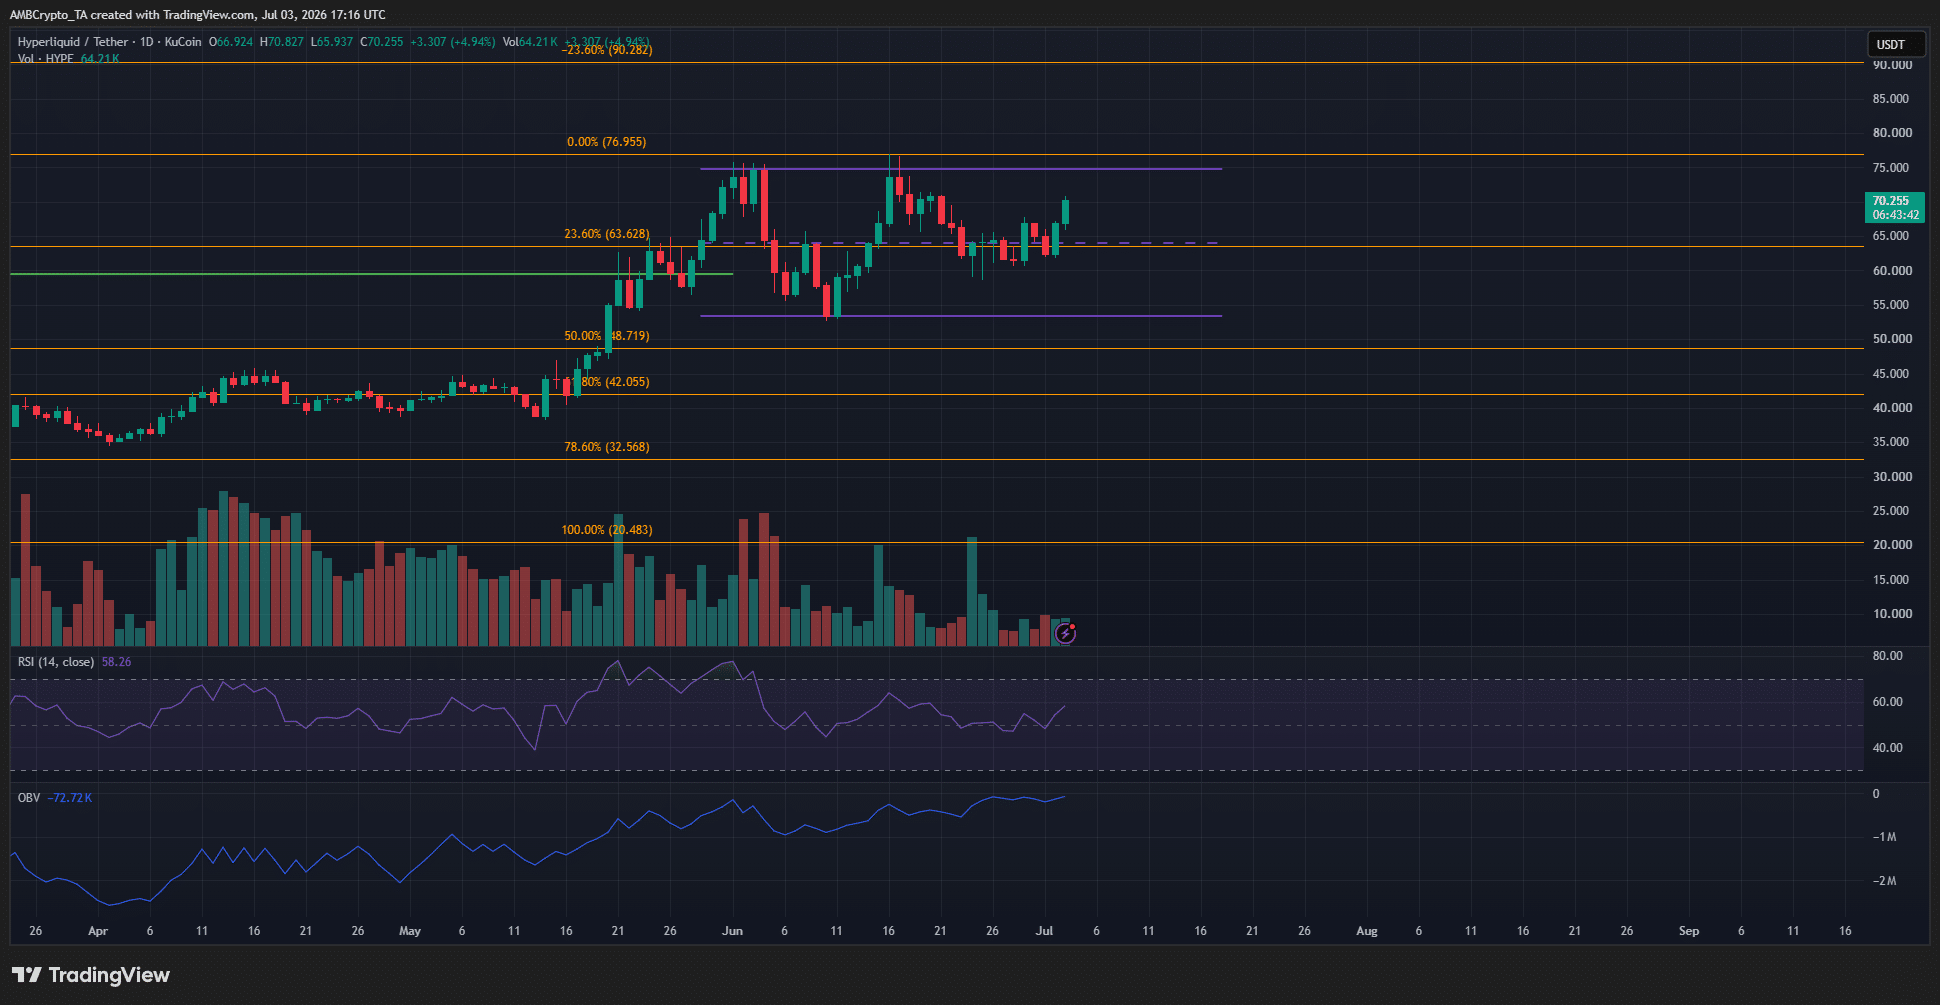
Over the past month of trading, the DEX token has formed a range [purple] between $53.35 and $74.78. At the time of writing, the price was above the mid-range resistance at $64.1 and also the short-term resistance zone at $67.2.

This upward push came despite some profit-taking by whales. The selling was being absorbed by the demand in the market.

Combined with the recent bullish momentum for Bitcoin, it appeared likely that HYPE can continue higher toward $75.

The OBV was climbing steadily, and the RSI remained above neutral 50. Together, they signaled steady buying pressure and intact bullish momentum.

Traders’ call to action- Wait
Source: HYPE/USDT on TradingView

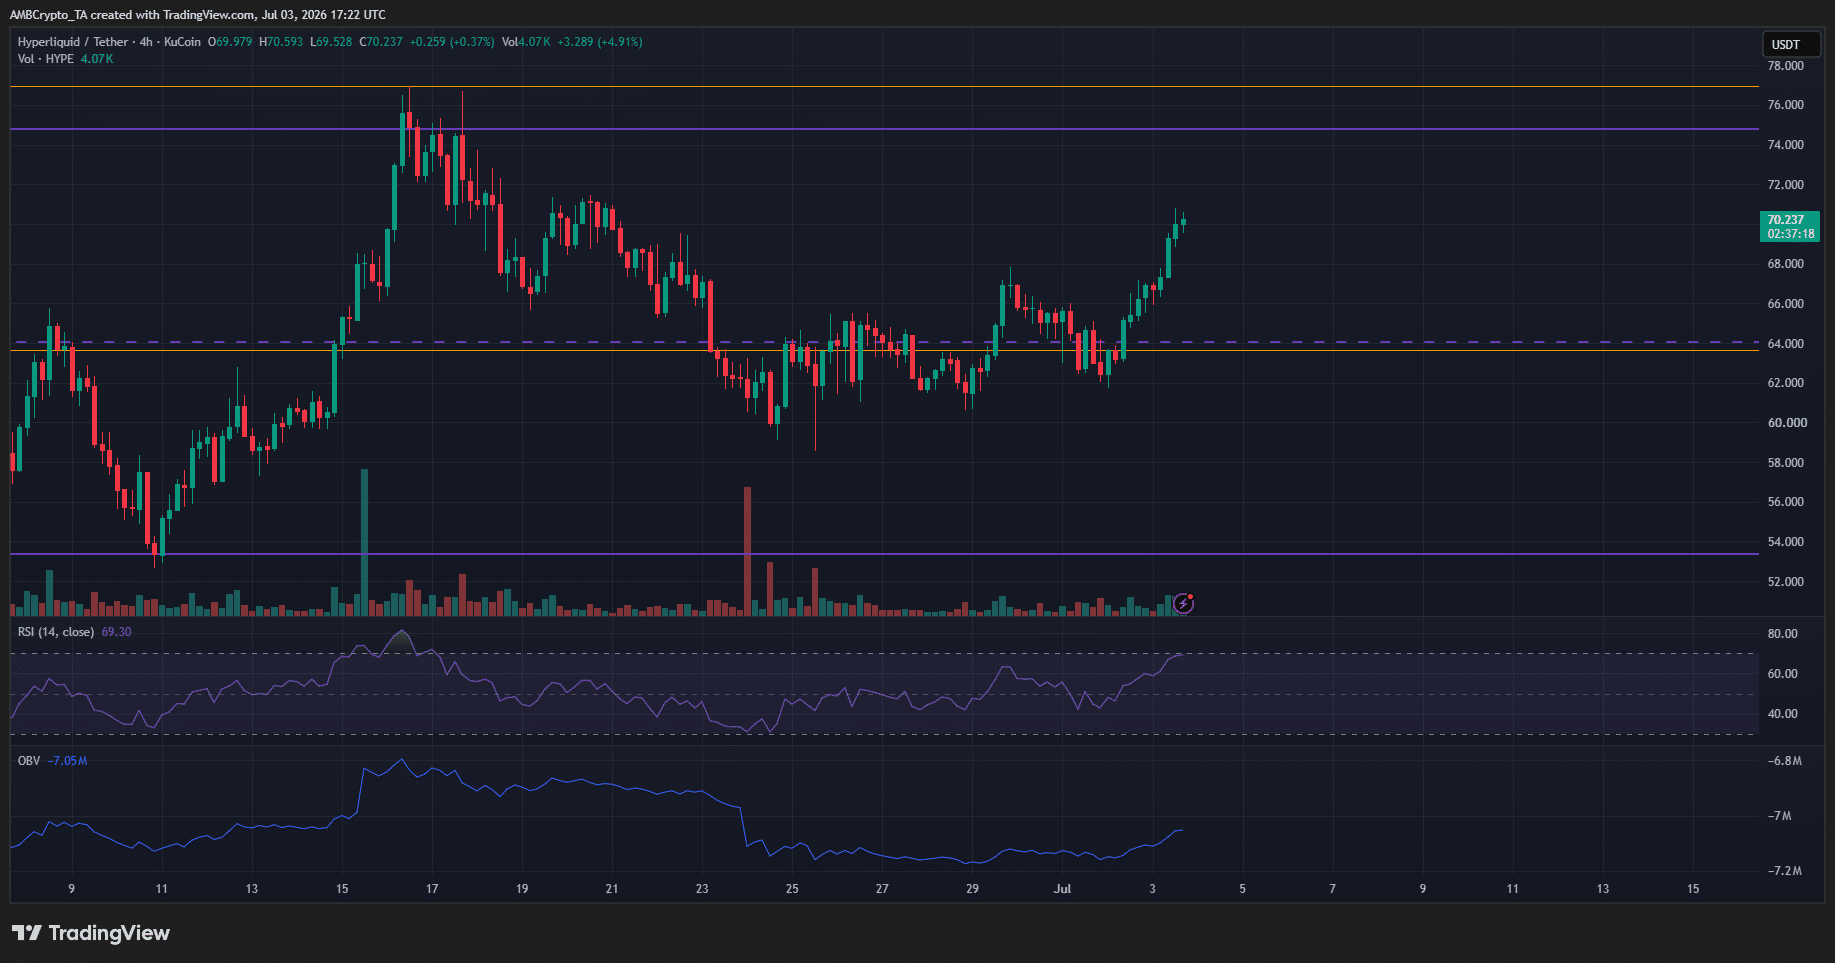
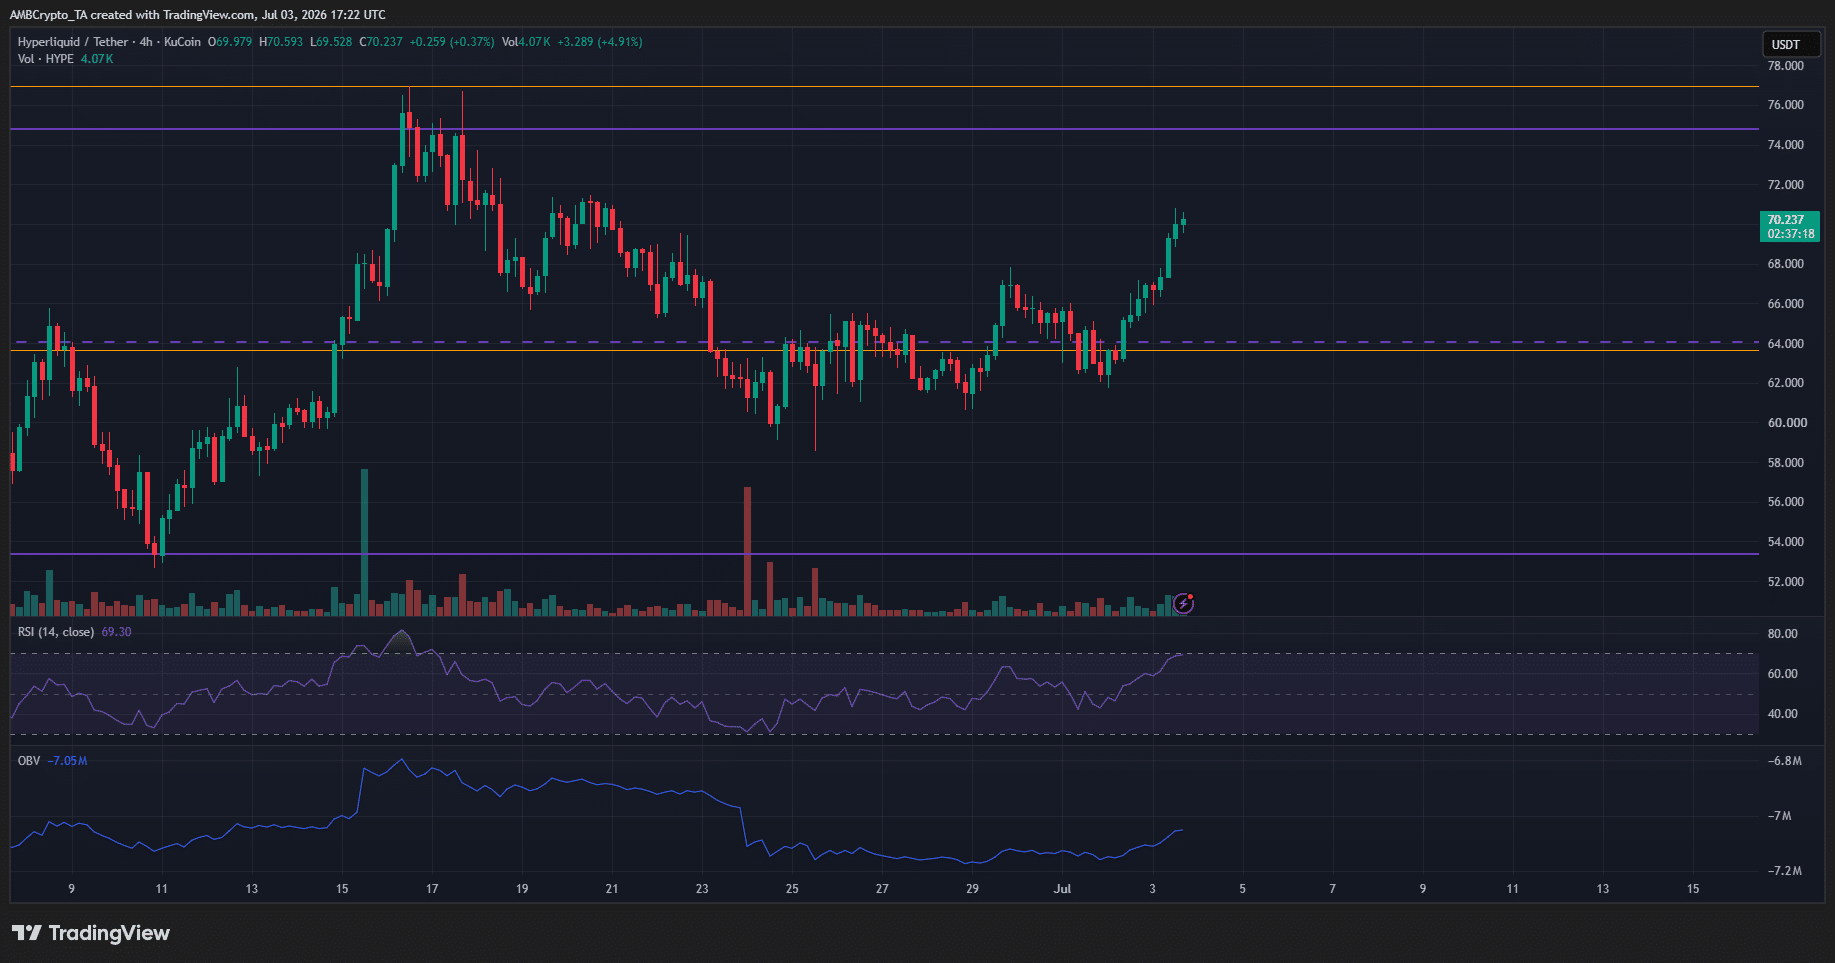
The range formation needs to be cleared for the next decisive higher timeframe move. Within this range, a test of either extreme can offer swing traders an opportunity to enter.

Right now, this opportunity was not at hand. The risk-to-reward was not ideal for swing traders at the time of writing.

The technical indicators favored short-term upside. Therefore, a move toward the $75 supply zone and a bearish reaction from there can be used to sell the token, targeting the mid-range and range-low support levels.


Final Summary

  • Hyperliquid was one of the only large-cap crypto assets that maintained a long-term bullish trend.
  • The $75 supply zone was vital for swing traders. A breakout past, or a rejection from, this area would be a signal for traders to place directional bets.


熱門幣種推薦

相關問答

QWhat is the key price level for Hyperliquid (HYPE) mentioned in the article, and why is it significant for traders?

AThe key price level is $75. It is a significant supply zone. A breakout above this level or a rejection from it would signal traders to place directional bets, as it would help determine the next decisive move for the token's price.

QWhat has been the overall long-term trend for Hyperliquid (HYPE), and how does it differ from most other altcoins mentioned?

AHyperliquid (HYPE) has maintained a firmly bullish long-term trend for over a year. This contrasts with most other altcoins, which have been trending downward since October 2025 and never really established a sustained uptrend.

QAccording to the article, what do the On-Balance Volume (OBV) and RSI indicators suggest about HYPE's current market momentum?

AThe On-Balance Volume (OBV) is climbing steadily, and the Relative Strength Index (RSI) remains above the neutral level of 50. Together, these indicators signal steady buying pressure and intact bullish momentum for HYPE in the short term.

QWhat trading range has HYPE formed over the past month, and what are its key support and resistance levels?

AOver the past month, HYPE has formed a trading range between $53.35 (range-low support) and $74.78. Key levels within this range include the mid-range resistance at $64.1 and a short-term resistance zone at $67.2.

QWhat is the article's primary recommendation for traders regarding HYPE at the time of writing, and why?

AThe primary recommendation for traders is to wait. The article states that the risk-to-reward ratio is not ideal for swing traders at the current moment. It suggests waiting for a move toward the $75 supply zone and observing the market's reaction (breakout or rejection) to place a trade.

你可能也喜歡

交易

現貨

熱門文章

如何購買SAND

歡迎來到HTX.com!在這裡,購買The Sandbox (SAND)變得簡單而便捷。跟隨我們的逐步指南,放心開始您的加密貨幣之旅。第一步:創建您的HTX帳戶使用您的 Email、手機號碼在HTX註冊一個免費帳戶。體驗無憂的註冊過程並解鎖所有平台功能。立即註冊第二步:前往買幣頁面,選擇您的支付方式信用卡/金融卡購買:使用您的Visa或Mastercard即時購買The Sandbox (SAND)。餘額購買:使用您HTX帳戶餘額中的資金進行無縫交易。第三方購買:探索諸如Google Pay或Apple Pay等流行支付方式以增加便利性。C2C購買:在HTX平台上直接與其他用戶交易。HTX 場外交易 (OTC) 購買:為大量交易者提供個性化服務和競爭性匯率。第三步:存儲您的The Sandbox (SAND)購買The Sandbox (SAND)後,將其存儲在您的HTX帳戶中。您也可以透過區塊鏈轉帳將其發送到其他地址或者用於交易其他加密貨幣。第四步:交易The Sandbox (SAND)在HTX的現貨市場輕鬆交易The Sandbox (SAND)。前往您的帳戶,選擇交易對,執行交易,並即時監控。HTX為初學者和經驗豐富的交易者提供了友好的用戶體驗。

523 人學過發佈於 2024.12.10更新於 2026.06.02

如何購買SAND

相關討論

歡迎來到 HTX 社群。在這裡,您可以了解最新的平台發展動態並獲得專業的市場意見。 以下是用戶對 SAND (SAND)幣價的意見。

活动图片