ETH/BTC Ratio Falls Back To Early-2023 Levels As Traders Debate Ethereum Value
bitcoinist發佈於 2026-06-21更新於 2026-06-21
文章摘要
The ETH/BTC ratio has fallen back to 0.027, a level last seen in early 2023, and is significantly below its 2021 peak near 0.088. This prompts a key market debate: Is Ethereum (ETH) now a historically cheap contrarian buy against Bitcoin (BTC), or is it in a structural decline? Analyst Woetoe highlighted this question.
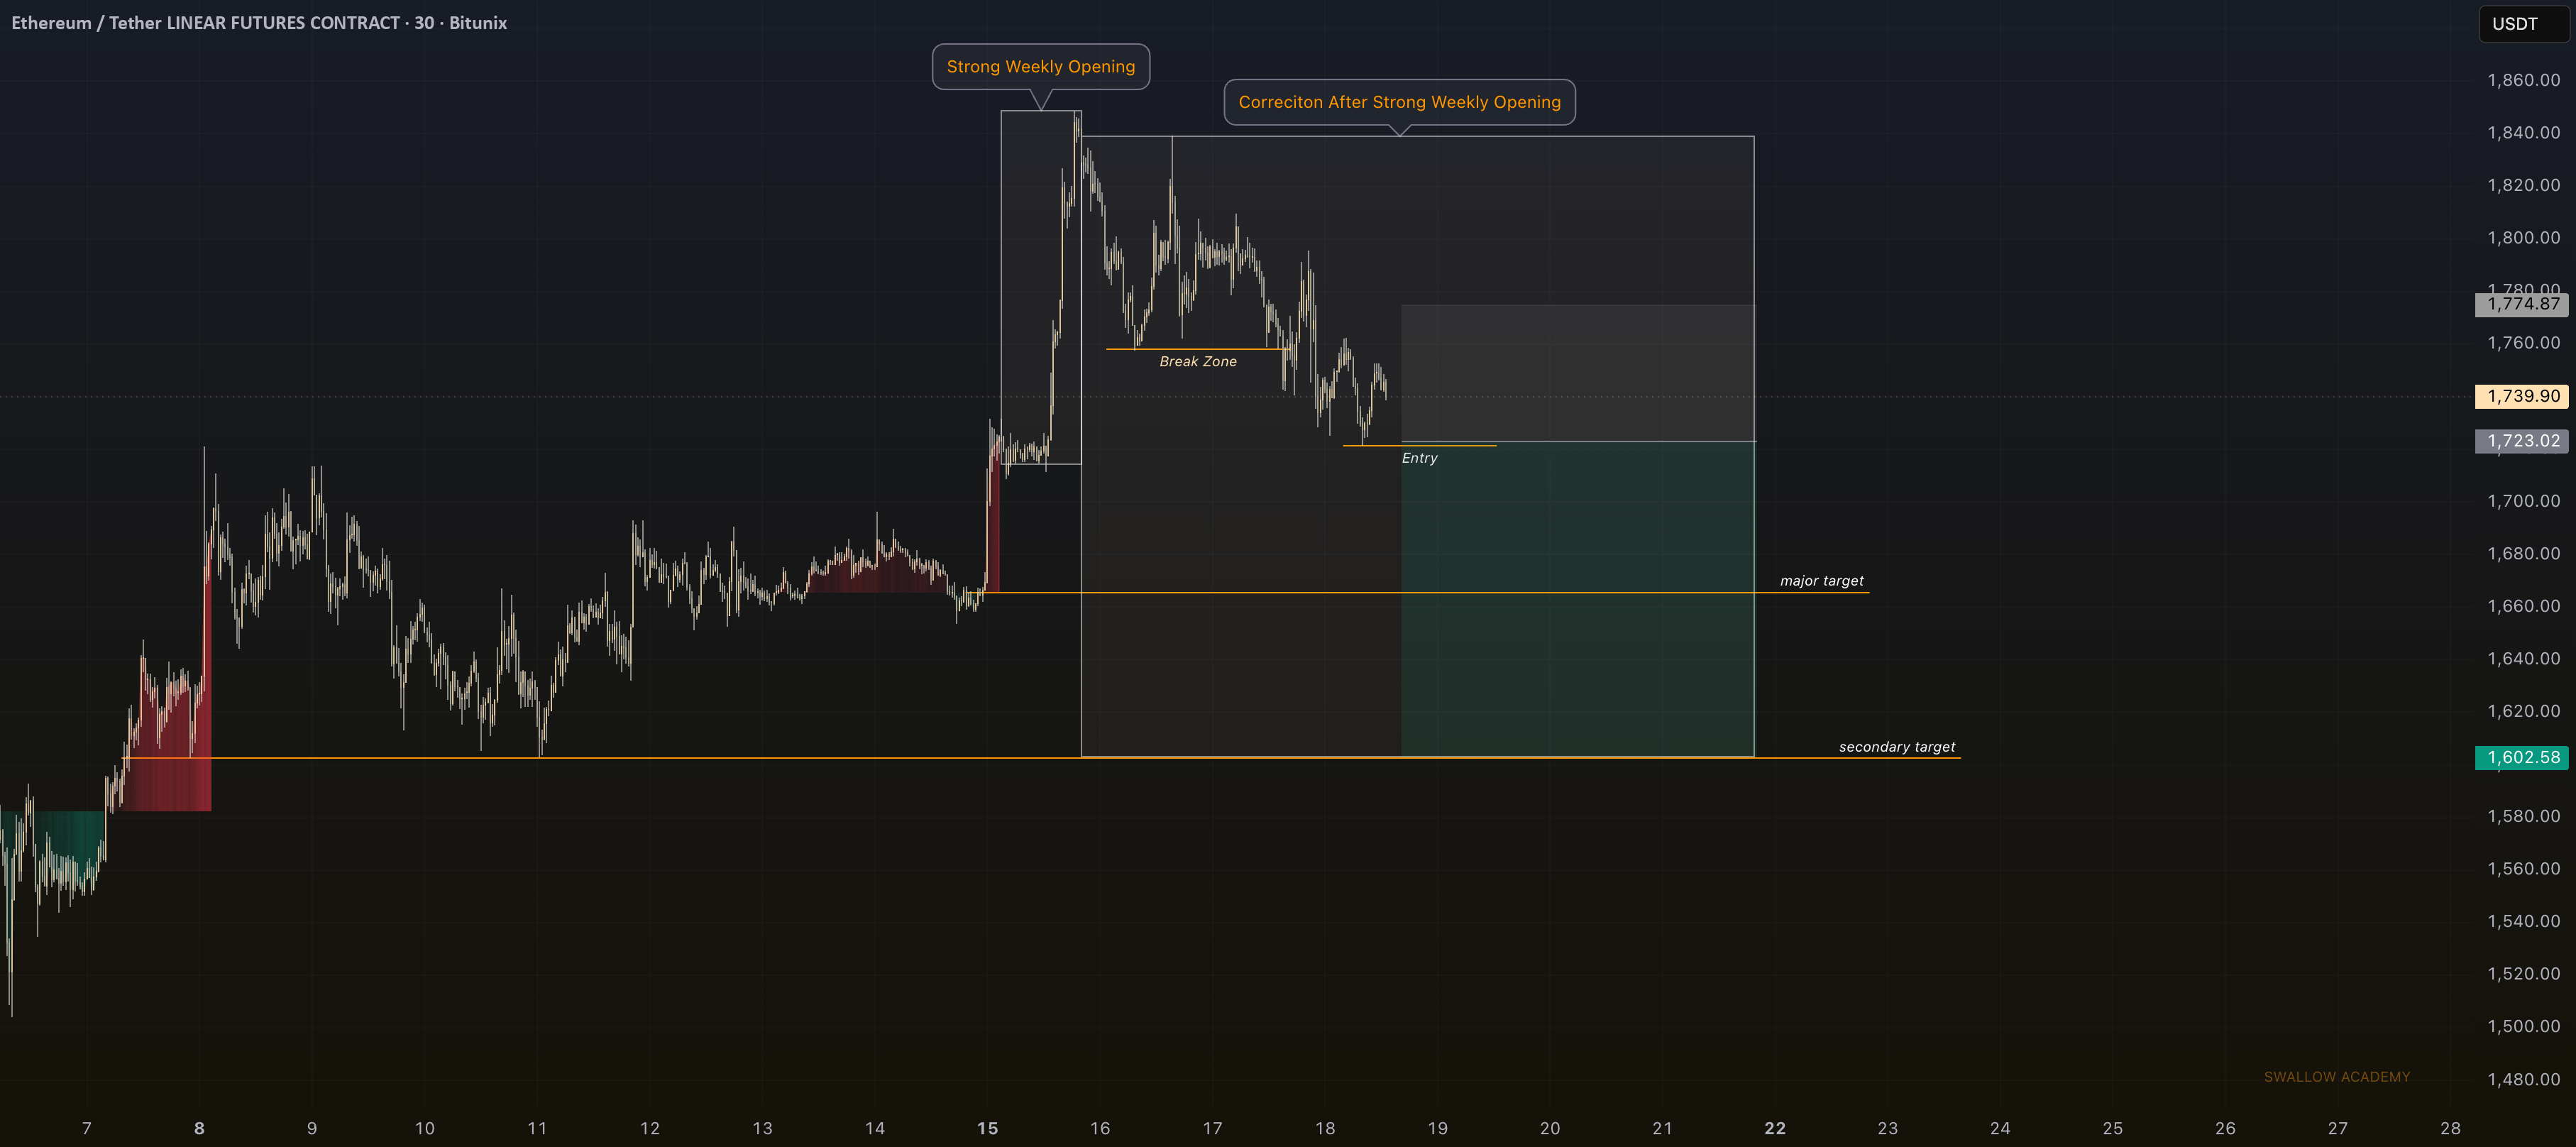
Simultaneously, ETH's USD chart (ETHUSDT) indicates bearish correction risk. Analysis from SwallowAcademy points to a broken market structure following an aggressive weekly open, with price rolling over below the $1,774 high and a potential pullback toward the $1,660-$1,723 zone.
This creates a complex setup. While ETH appears undervalued relative to BTC, its standalone technicals remain weak. The report concludes that for ETH bulls, the immediate priority is not valuation arguments but reclaiming technical strength and beginning to outperform BTC again.
Trusted Editorial content, reviewed by leading industry experts and seasoned editors. Ad Disclosure
TL;DR
Woetoe says the ETH/BTC ratio is near 0.027, back around early-2023 levels.
The analyst contrasted that with the 2021 peak near 0.088.
A separate ETHUSDT TradingView setup shows bearish correction risk after a strong weekly open.
The ETH/BTC ratio at 0.027. Back to early 2023 levels.
In 2021 at the peak it was 0.088. Three times what it is today.$ETH is historically cheap against bitcoin on a relative basis.
Contrarian bet or structural decline? pic.twitter.com/sF9DgKyKwq
TradingView chart referenced in this analysis
— Woetoe (@cryptowoetoe) June 20, 2026
Ethereum’s relative performance against Bitcoin is back under pressure. In a June 20 X post, Woetoe said the ETH/BTC ratio is at 0.027, bringing it back to early-2023 levels. The analyst contrasted that with the 2021 peak around 0.088 and asked whether ETH is now a contrarian bet or facing structural decline.
That question captures the core debate around Ethereum right now. A low ETH/BTC ratio can look attractive to investors who believe Ethereum will eventually regain leadership. It can also be a warning that capital continues to prefer Bitcoin over the broader smart-contract ecosystem.
ETHUSDT Chart Shows Correction Risk
The dollar chart is not offering a simple bullish answer either. SwallowAcademy’s June 20 TradingView idea described ETHUSDT as entering a bearish correction after a strong weekly open. The analyst said the initial push was unusually aggressive, which increased the need for a deeper pullback to rebalance the move.
The setup highlighted a broken market structure and price rolling over below the $1,774 high. The stated game plan focused on selling a retest into a $1,723 entry zone, with $1,660 referenced in the idea title as part of the corrective framework.
A Relative-Value Setup With Real Risk
The combination creates an interesting but risky setup. ETH may look historically cheap against Bitcoin, but the ETHUSDT chart still shows corrective pressure. That means a relative-value trader may see opportunity while a momentum trader sees weakness.
The distinction matters. Cheap can stay cheap if market structure keeps deteriorating. For ETH bulls, the first job is not to argue valuation; it is to reclaim technical strength and start outperforming BTC again.
This report is based on information from Woetoe on X and TradingView SwallowAcademy.
This article was written by the News Desk and edited by Samuel Rae.
Editorial Process for bitcoinist is centered on delivering thoroughly researched, accurate, and unbiased content. We uphold strict sourcing standards, and each page undergoes diligent review by our team of top technology experts and seasoned editors. This process ensures the integrity, relevance, and value of our content for our readers.
ShareTweetShareShare
Sign Up for Our Newsletter!
For updates and exclusive offers enter your email.
Bitcoinist Editorial Team
Follow
Full Profile
Related Posts
Kraken Brings Solana DEX Trading Directly to Its Main App
2 hours ago
Ethereum Bears Keep Control As ETH Rejects Trendline Resistance
8 hours ago
XRP Reversal Setup Forms Around Harmonic Pattern And Key Support Zone
11 hours ago
Hyperliquid ETF Claim Draws Attention As HYPE Narrative Builds On X
12 hours ago
Bitcoin Must Hold $60K Or Risk Major Breakdown, TradingView Analyst Warns
14 hours ago
Venus Protocol Integrates Tokenized Stocks As Lending Collateral On BNB Chain
QWhat is the current ETH/BTC ratio and how does it compare to its 2021 peak?
AThe current ETH/BTC ratio is approximately 0.027, a level last seen in early 2023. This is significantly lower than its 2021 peak, which was around 0.088.
QAccording to SwallowAcademy's analysis on TradingView, what is the outlook for ETHUSDT?
AAccording to SwallowAcademy, the ETHUSDT chart is entering a bearish correction after a strong weekly open. The analysis highlights a broken market structure, with price rolling over below the $1,774 high, and suggests a corrective pullback could target levels around $1,660.
QWhat is the core debate about Ethereum's current market position as mentioned in the article?
AThe core debate is whether Ethereum's low ETH/BTC ratio represents a contrarian buying opportunity because it is historically cheap against Bitcoin, or if it signals a structural decline where capital continues to favor Bitcoin over Ethereum and the broader smart-contract ecosystem.
QAccording to the article, what is the primary task for Ethereum bulls who see value in the current ratio?
AFor Ethereum bulls, the primary task is not just to argue about valuation, but to reclaim technical strength and for ETH to start outperforming Bitcoin (BTC) again, as a low ratio can persist if market structure continues to deteriorate.
QBased on the combined analysis, why is the current ETH setup considered 'interesting but risky'?
AThe setup is interesting but risky because ETH appears historically cheap relative to Bitcoin, suggesting a relative-value opportunity. However, the ETHUSDT chart simultaneously shows bearish corrective pressure, meaning a momentum trader sees weakness. The risk is that 'cheap can stay cheap' if technical weakness persists.