Executive Summary
- Bitcoin remains in a mild bearish phase, trading between $97K and $111.9K, with resistance near $116K marked by top-buyers’ supply cluster.
- Seller exhaustion and renewed accumulation near $100K provide short-term support but lack strong follow-through demand.
- A dense supply cluster between $106K–$118K continues to cap rallies as investors exit near breakeven.
- ETF flows have turned modestly negative, reflecting fading institutional demand and a cautious risk appetite.
- Futures markets show muted funding rates and low open interest, signalling subdued speculative activity across both Bitcoin and altcoins.
- Options traders maintain a defensive stance, with put protection concentrated around $100K, while the 25-delta skew remains a key gauge for sentiment shifts.
- Overall, the market is consolidating within a defined range, awaiting stronger inflows or macro catalysts to break out of the current equilibrium.
Over the past week, Bitcoin briefly slipped below $100K, extending the broader downtrend that has persisted since early October. This move pushed the market into a mild bearish regime, with prices now trading beneath the short-term holder cost basis.
In this edition, we analyze the forces driving the rebound toward $106K using on-chain cost-basis models and accumulation–distribution dynamics. We then pivot to off-chain indicators, exploring ETFs, futures markets and options market sentiment to assess whether this recovery reflects genuine demand or a short-lived relief rally.
On-chain Insights
Grinding Lower
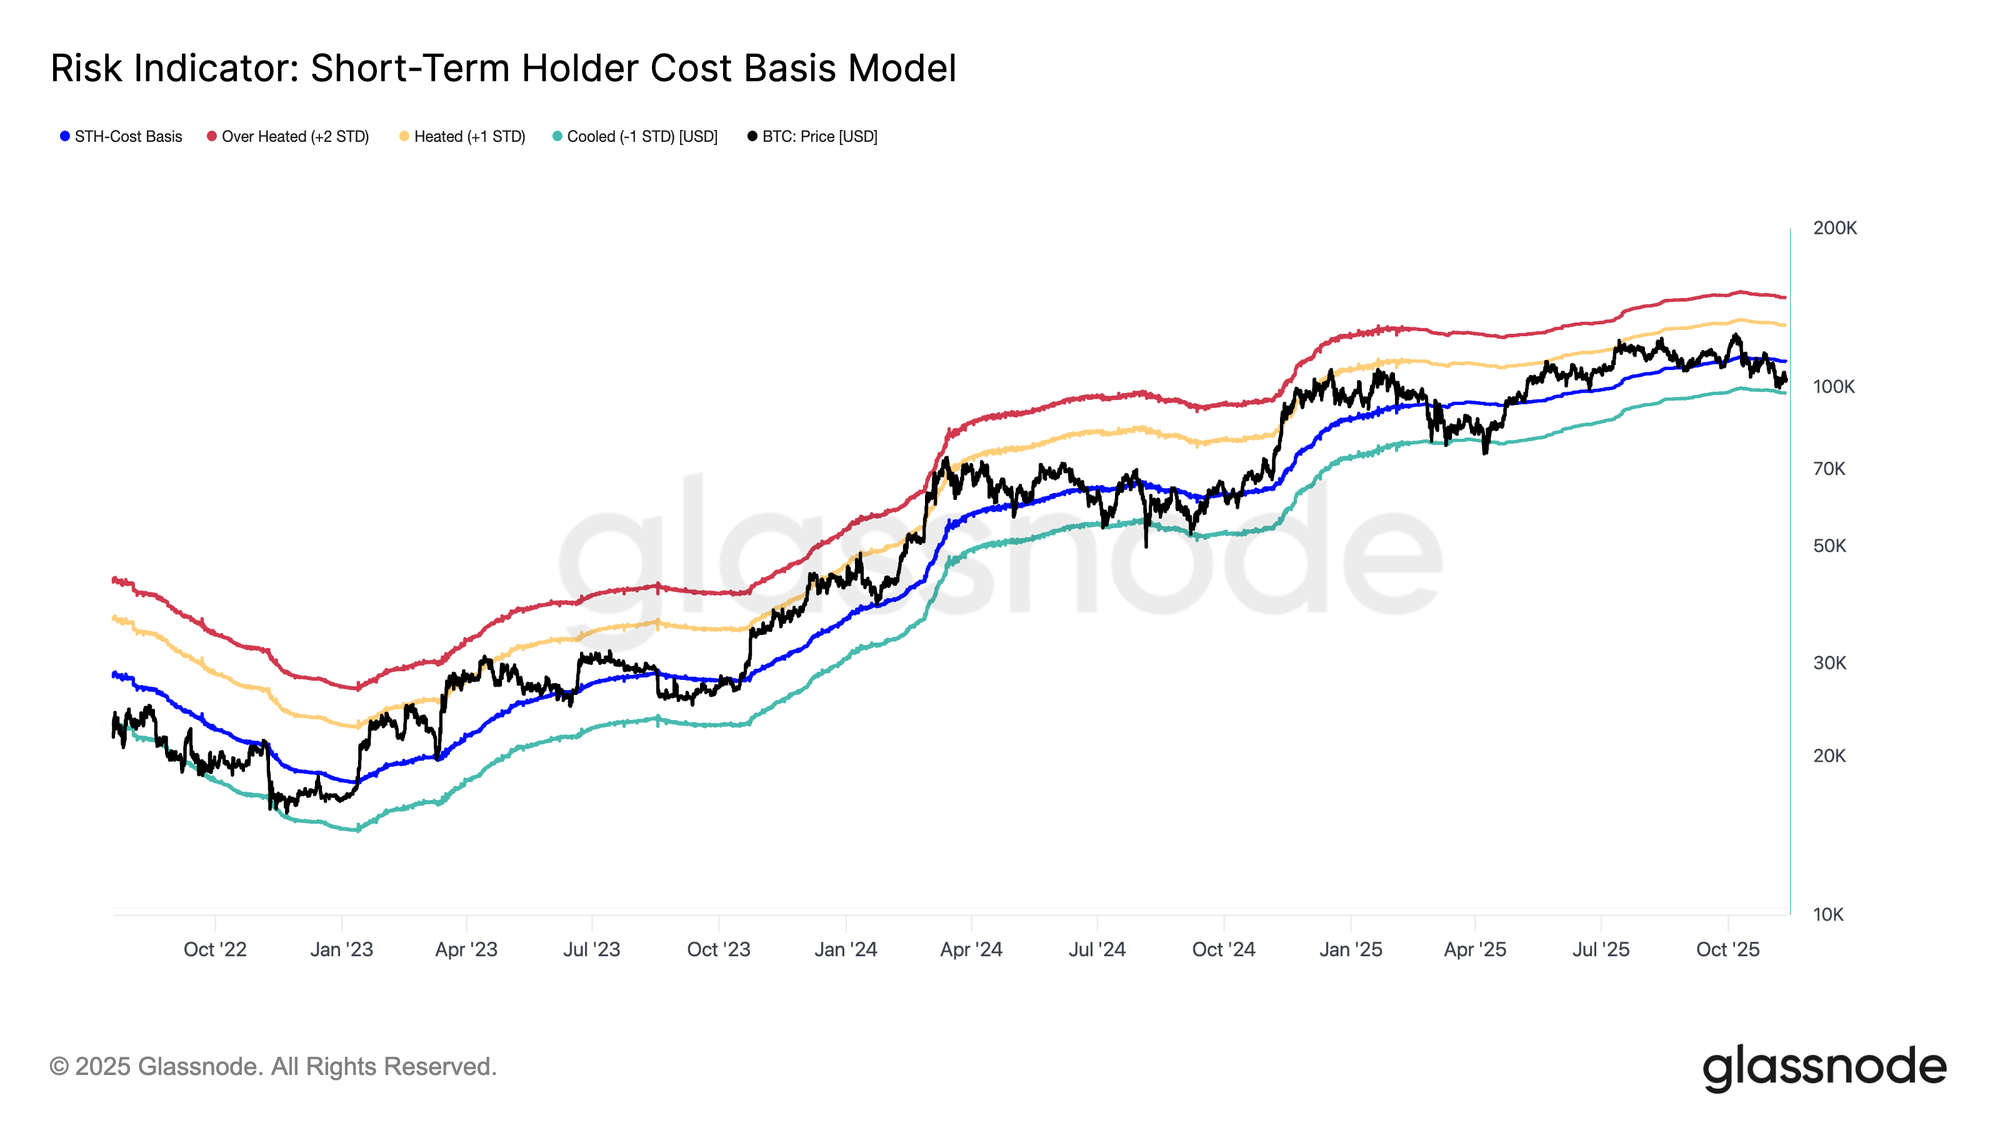
Since early October, with Bitcoin breaking below the short-term holder cost basis (🔵), a range suffering from the lack of conviction and low liquidity has been confirmed. Since then, price action has trended lower, approaching the -1 STD band near $97.5K.
This recent drawdown resembles the contraction phases seen during June–October 2024 and February–April 2025, where prices oscillated within a defined lower range before recovery. Consequently, unless Bitcoin reclaims the short-term holder cost basis (~$111.9K) as support, the probability of revisiting the lower bound of this range remains elevated.
Seller Exhaustion Near $100K
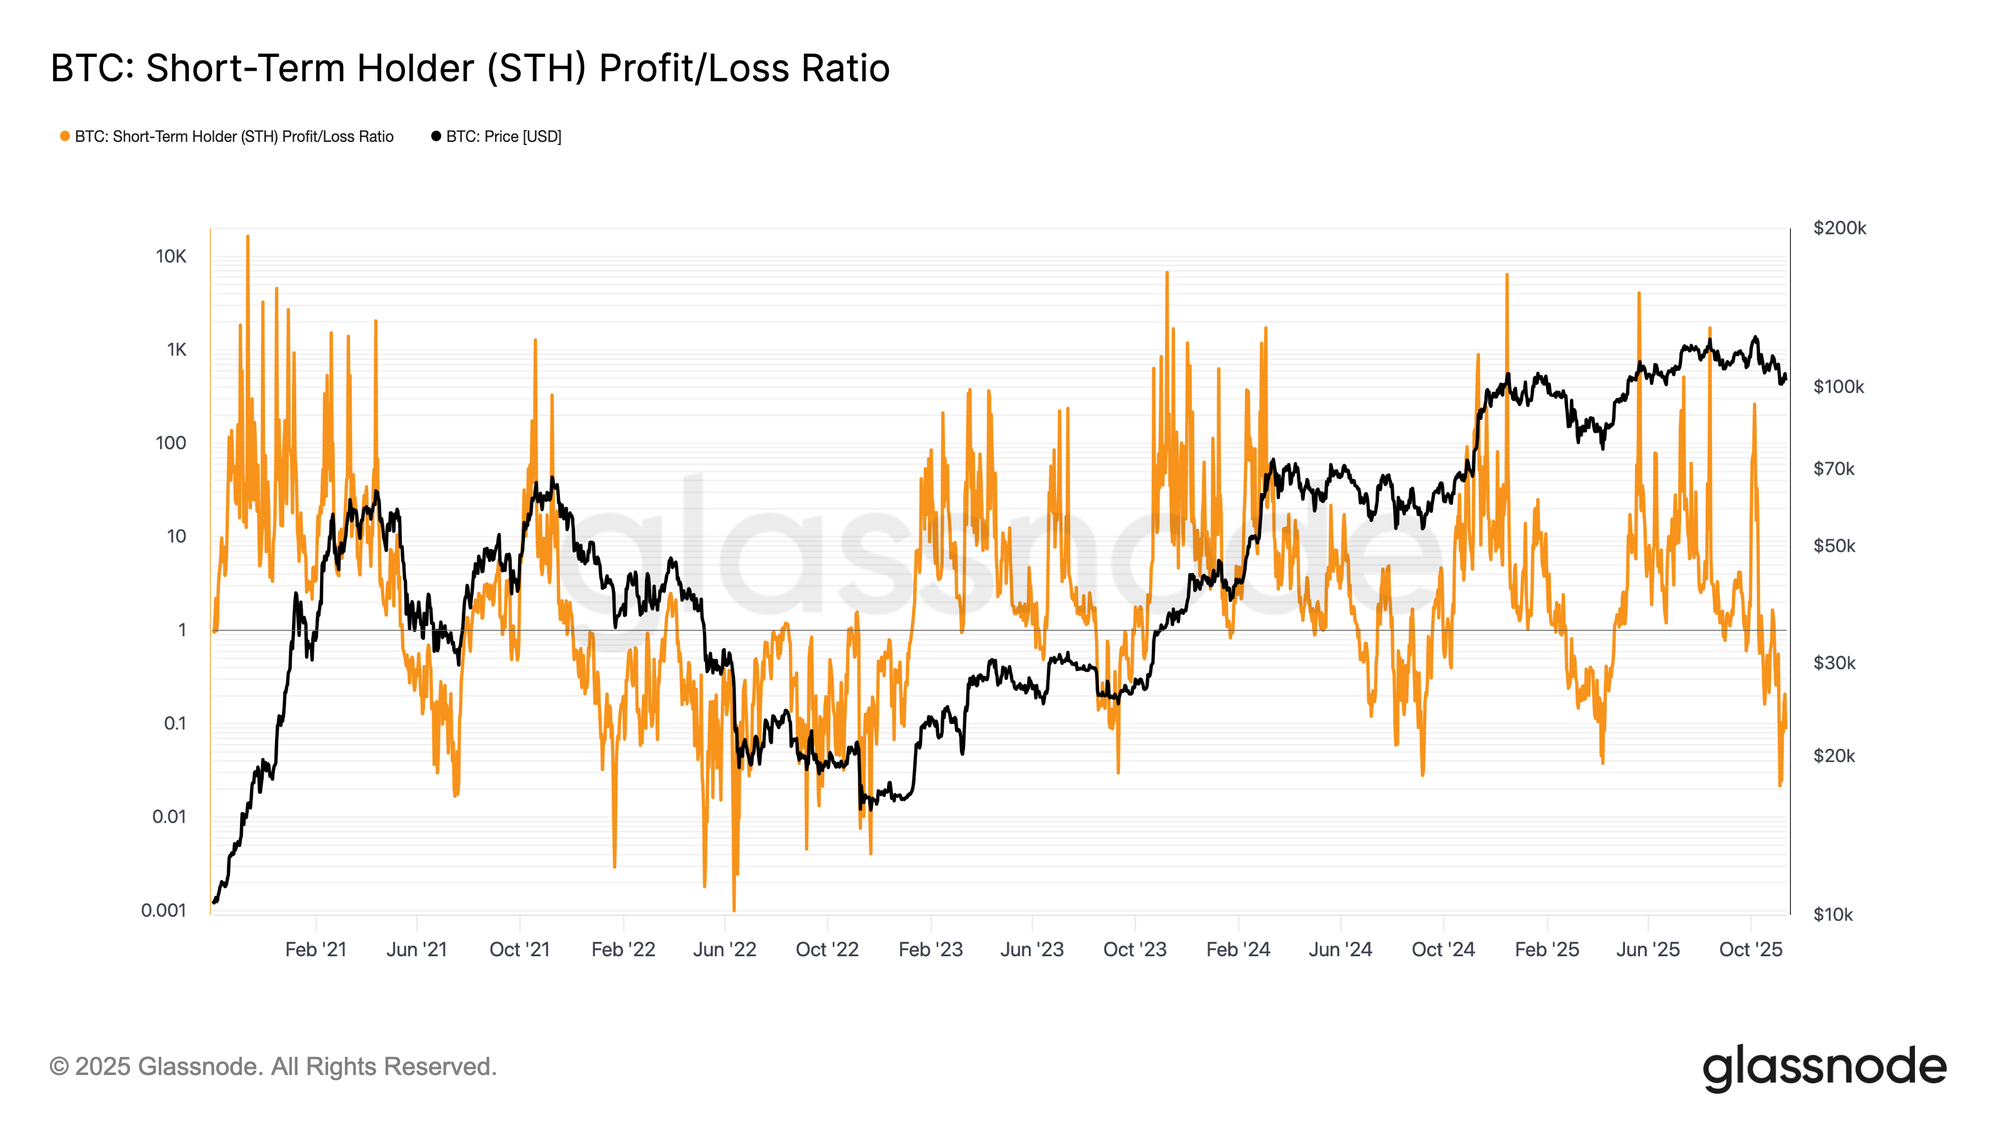
Building on this structural setup, the sub-$100K zone has emerged as a critical battleground where seller exhaustion is beginning to take shape. Much of the downward pressure stems from top buyers among short-term holders, who have been realizing heavy losses during the decline.
As Bitcoin tested $98K, the STH Realized Profit-Loss Ratio fell below 0.21, meaning over 80% of realized value came from coins sold at a loss. This intensity of capitulation briefly exceeded the last three major washouts of this cycle, underscoring how top-heavy the market has become and how pivotal the $100K level remains for near-term stability.
Fueling the Bounce Back
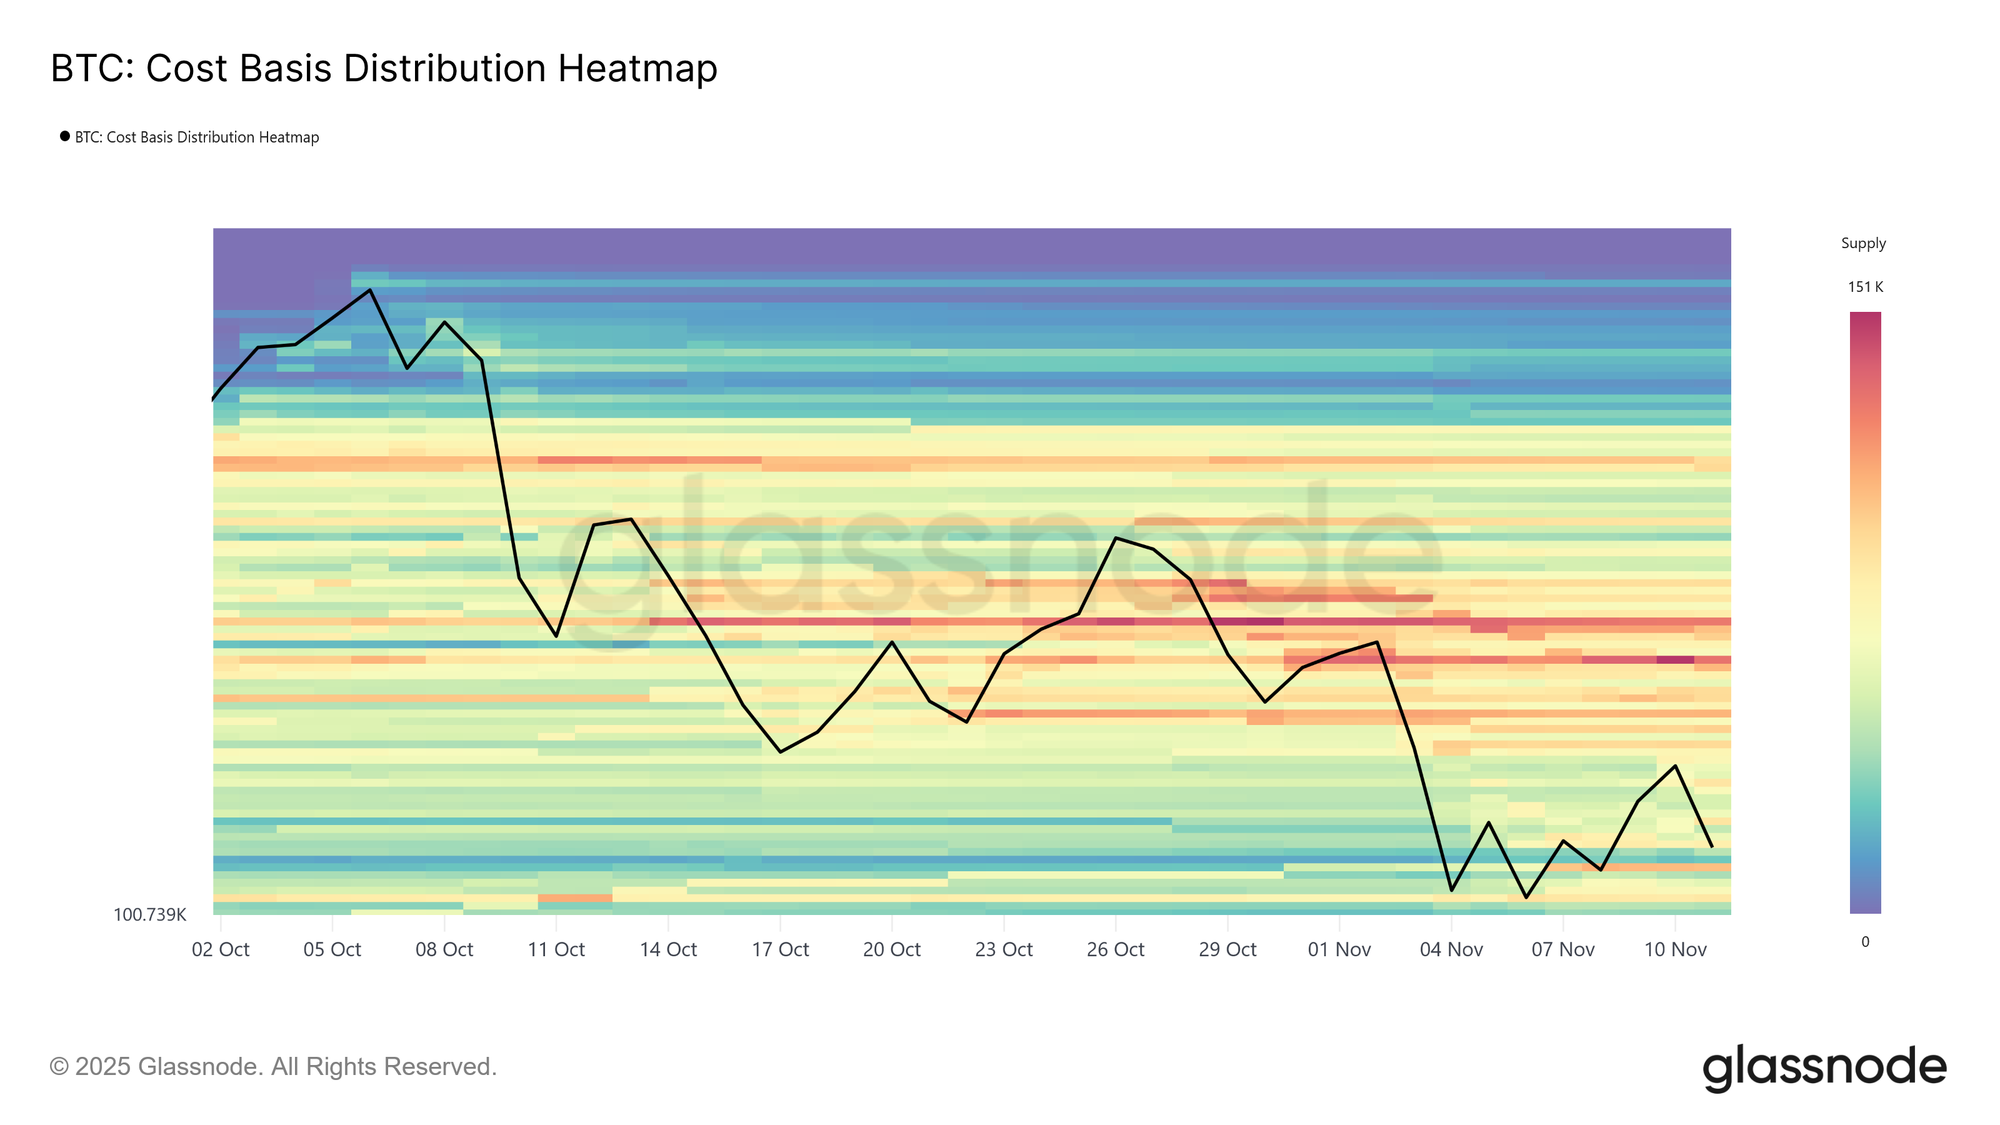
Turning to the demand side, the Cost Basis Distribution Heatmap reveals a clear buildup of realized supply around the sub-$100K zone, both before and after the rebound to $106K. The intensifying heat in this range signals renewed accumulation by buyers absorbing capitulation flows. This dynamic completes the picture; pairing seller exhaustion with steady accumulation, creating the foundation for a short-term recovery even within a broader bearish structure.
Conversely, a dense supply cluster between $106K and $118K continues to cap upward momentum, as many investors use this range to exit near breakeven. This overhang of latent supply creates a natural resistance zone where rallies may stall, suggesting that sustained recovery will require renewed inflows strong enough to absorb this wave of distribution.
Demand Fades, Resistance Builds
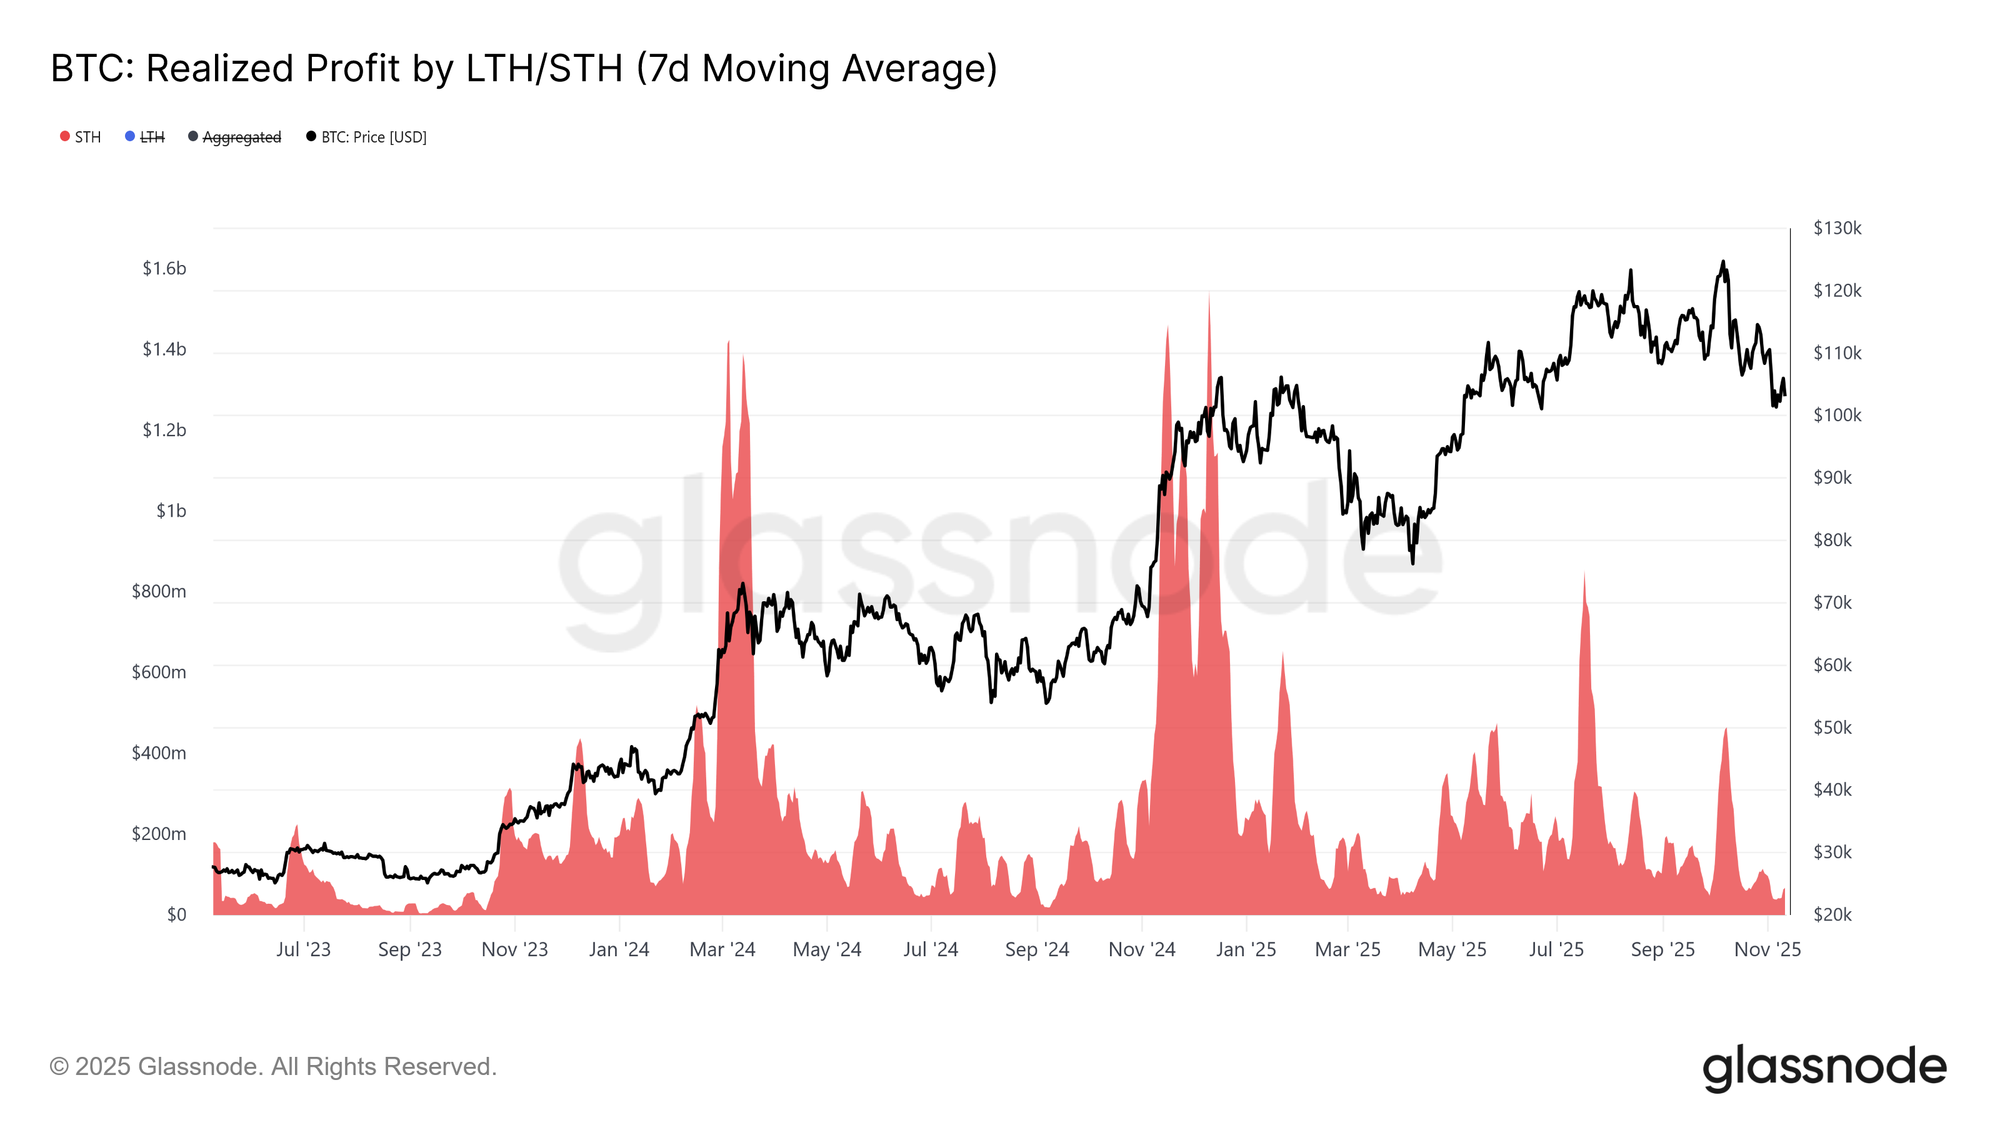
The current market structure confirms a continuation of the downtrend that began in early October. A dense supply zone above $106K continues to exert sell pressure, and reclaiming the short-term holder cost basis (~$111.9K) remains a key prerequisite for any sustainable shift toward recovery.
On the demand side, the Realized Profit of Short-Term Holders (a proxy for new investor momentum) has been notably weak since June 2025, reflecting a lack of fresh inflows. For Bitcoin to push through the $106K–$118K top-buyer cluster, this metric must reverse higher, signalling renewed conviction and stronger demand from new market entrants.
Off-Chain Insights
ETF Outflows Resurface
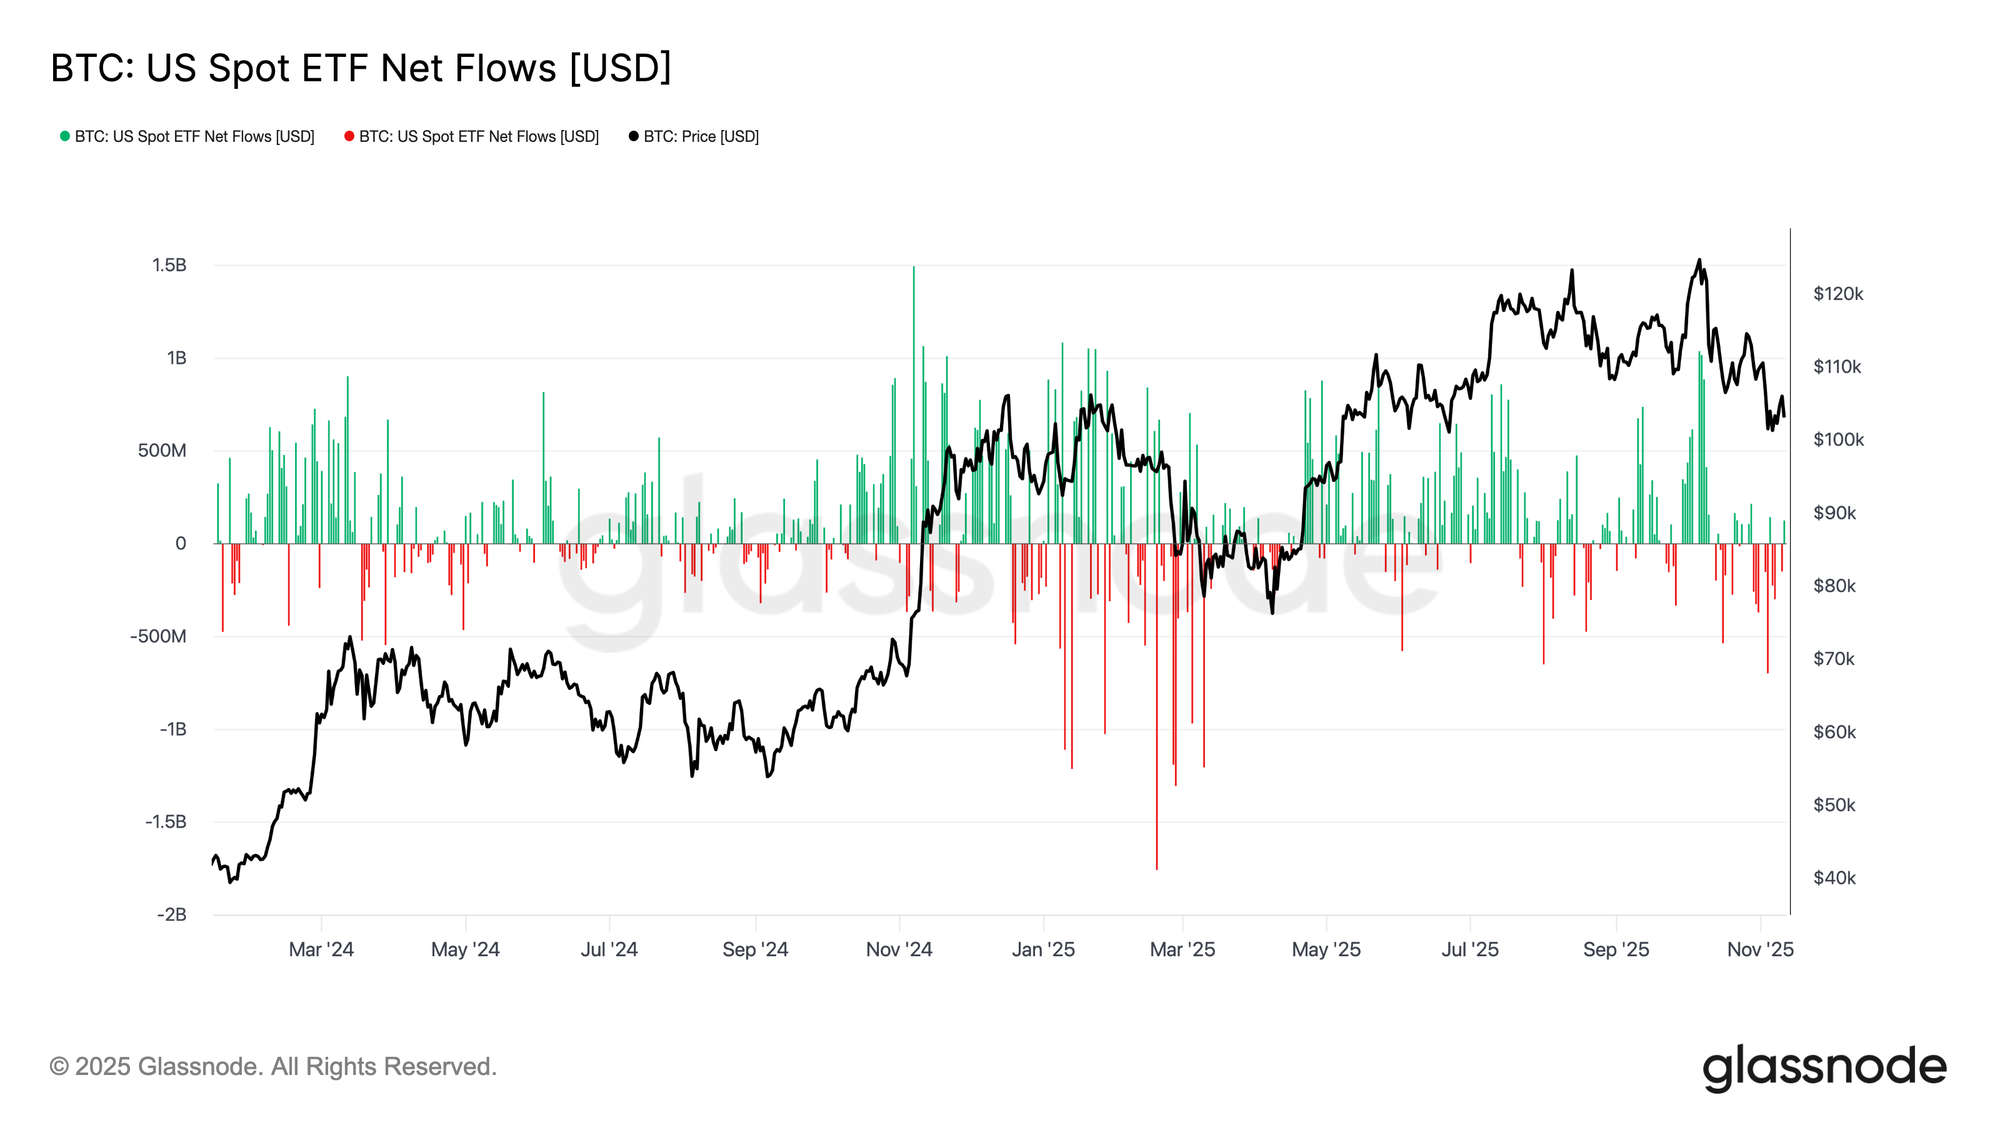
Transitioning to the off-chain section, we first gauge the U.S. spot Bitcoin ETF markets. US spot Bitcoin ETFs have shifted to modest outflows in recent weeks, mirroring muted price action and waning momentum. After strong mid-year inflows, aggregate demand has flattened, suggesting a pause in institutional accumulation.
Historically, such neutral flow regimes align with market consolidation, where conviction rebuilds before the next directional move. A decisive return of inflows would signal renewed institutional confidence, while prolonged outflows could reinforce a more defensive market tone.
Leverage Dries Up
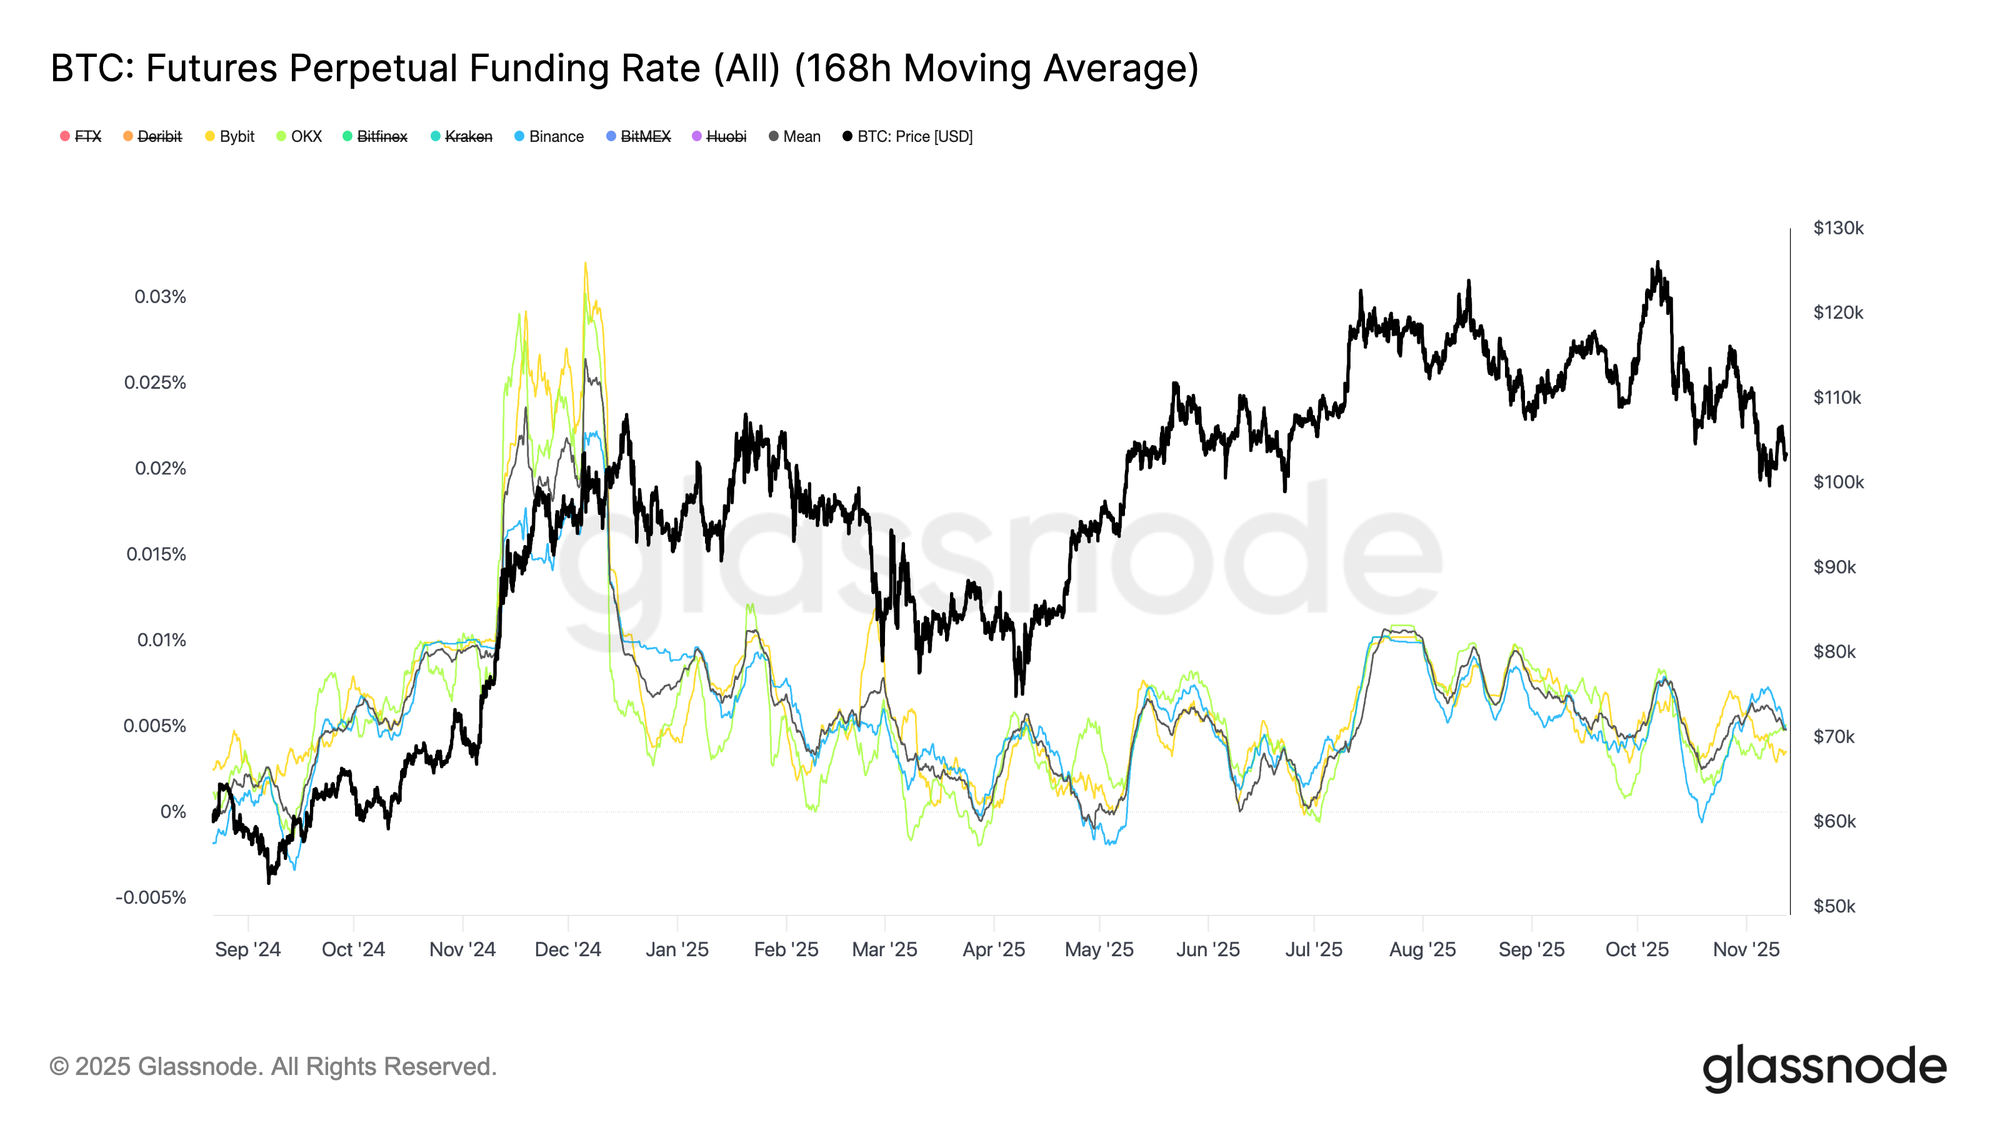
Bitcoin perpetual futures funding rates remain subdued across major exchanges, highlighting the lack of speculative appetite in derivatives markets. Since the leverage flush in October, both funding rates and open interest have drifted lower, signalling that traders are staying cautious with limited directional exposure.
This absence of aggressive positioning reflects a phase of market hesitation, often seen before volatility re-emerges. For now, the derivatives landscape remains quiet and balanced, leaning toward neutral sentiment rather than speculation-driven momentum.
Speculation Cools Broadly
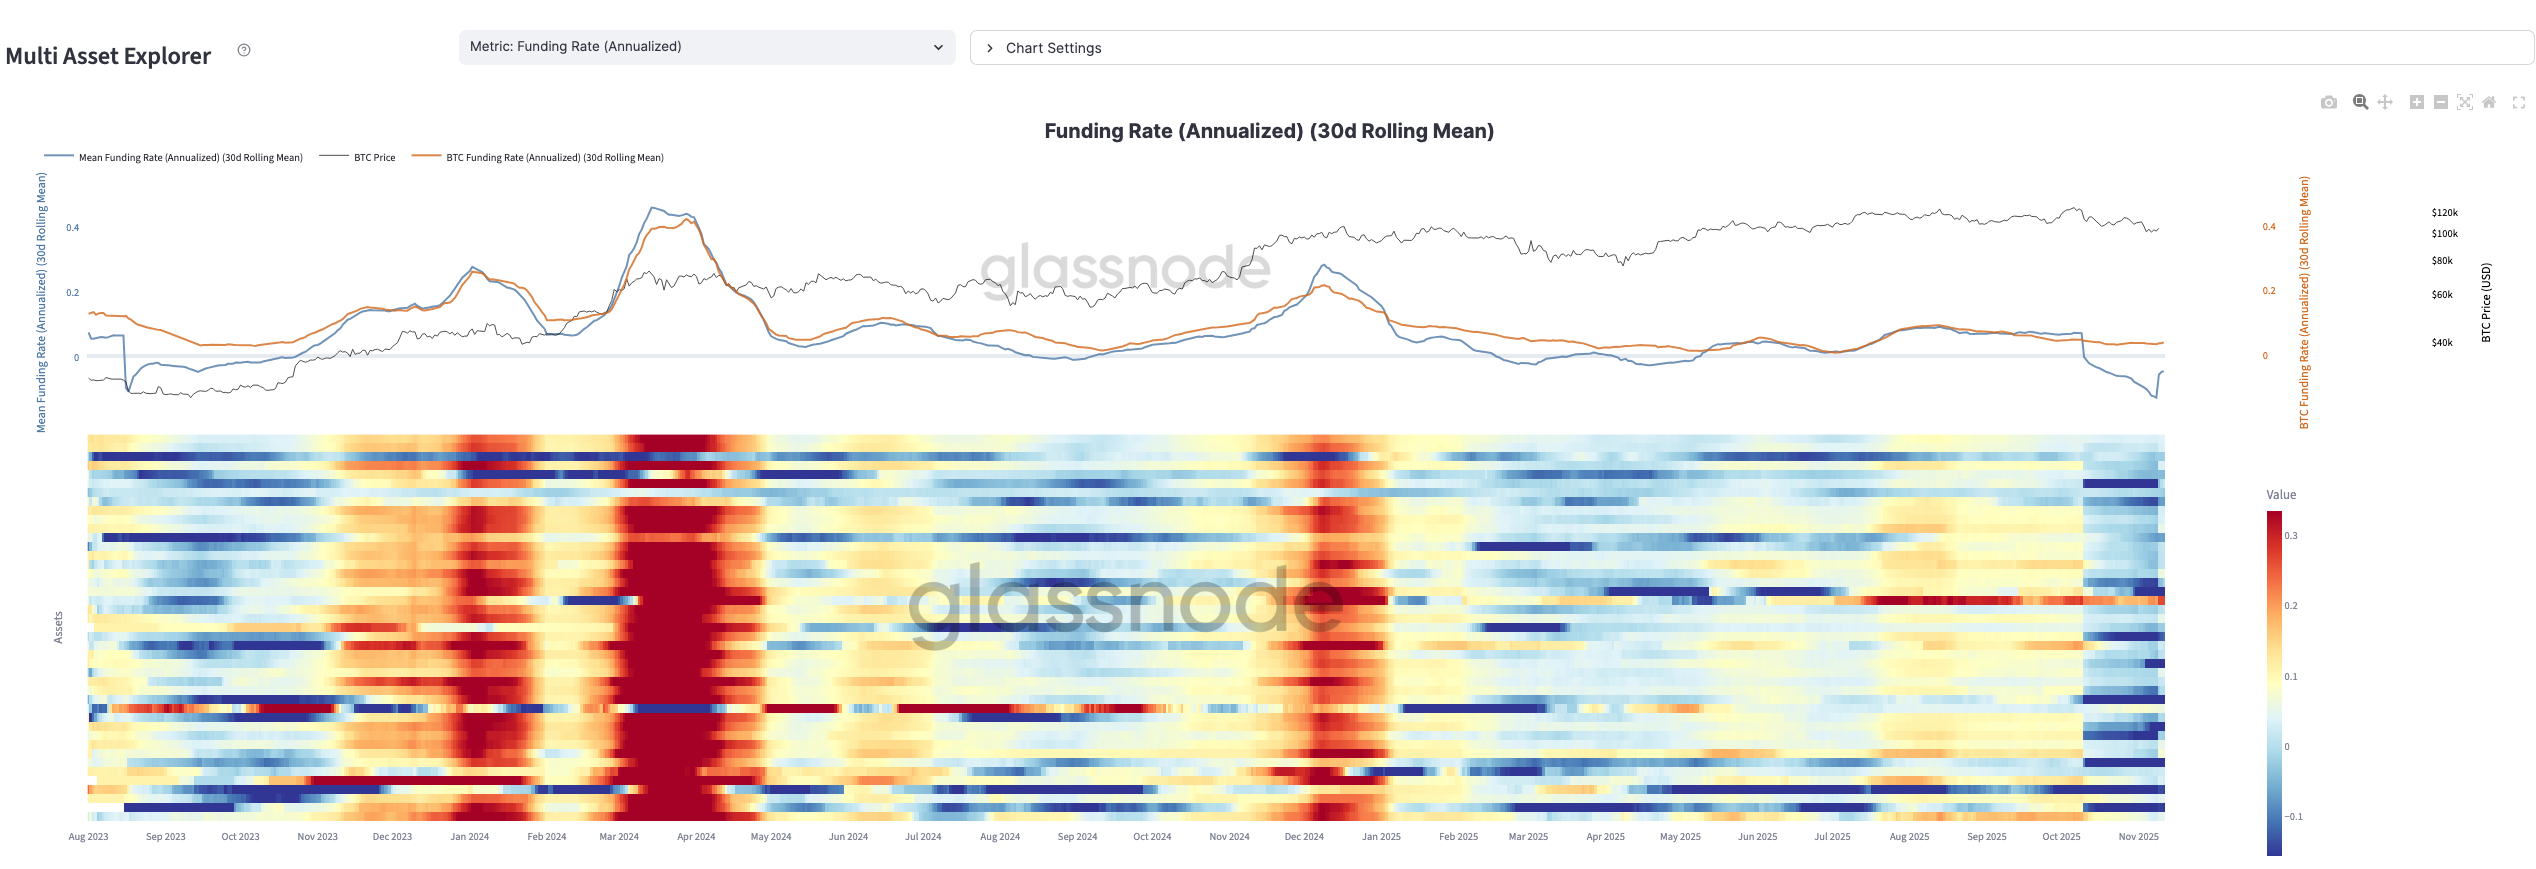
Speculators’ reluctance to use leverage for directional bets extends beyond Bitcoin. Using our newly launched Multi-Asset Explorer, we can assess key futures indicators, funding rates and open interest across the top 100 digital assets.
The first heatmap shows a clear cooling in market-wide funding intensity since mid-year, interrupted only by brief spikes. This broad moderation suggests that traders have de-risked, with leverage and conviction subdued across both Bitcoin and altcoins. Overall, derivatives sentiment remains cautious, and liquidity continues to thin across the board.
Open interest trends across digital asset futures reveal a sharp decline in speculative engagement, most evident in altcoin markets. The heatmap shows a sustained dominance of blue tones, reflecting ongoing contraction in open interest and a clear absence of risk appetite.
While Bitcoin maintains relatively stable positioning, leverage in altcoins has unwound to near cycle lows, with little sign of fresh capital rotation. This pattern underscores a defensive stance among traders, prioritizing capital preservation over speculation. In essence, altcoin derivatives activity has thinned materially—positioning remains light, conviction low, and market attention firmly centred on Bitcoin.

Put Protection Still in Demand
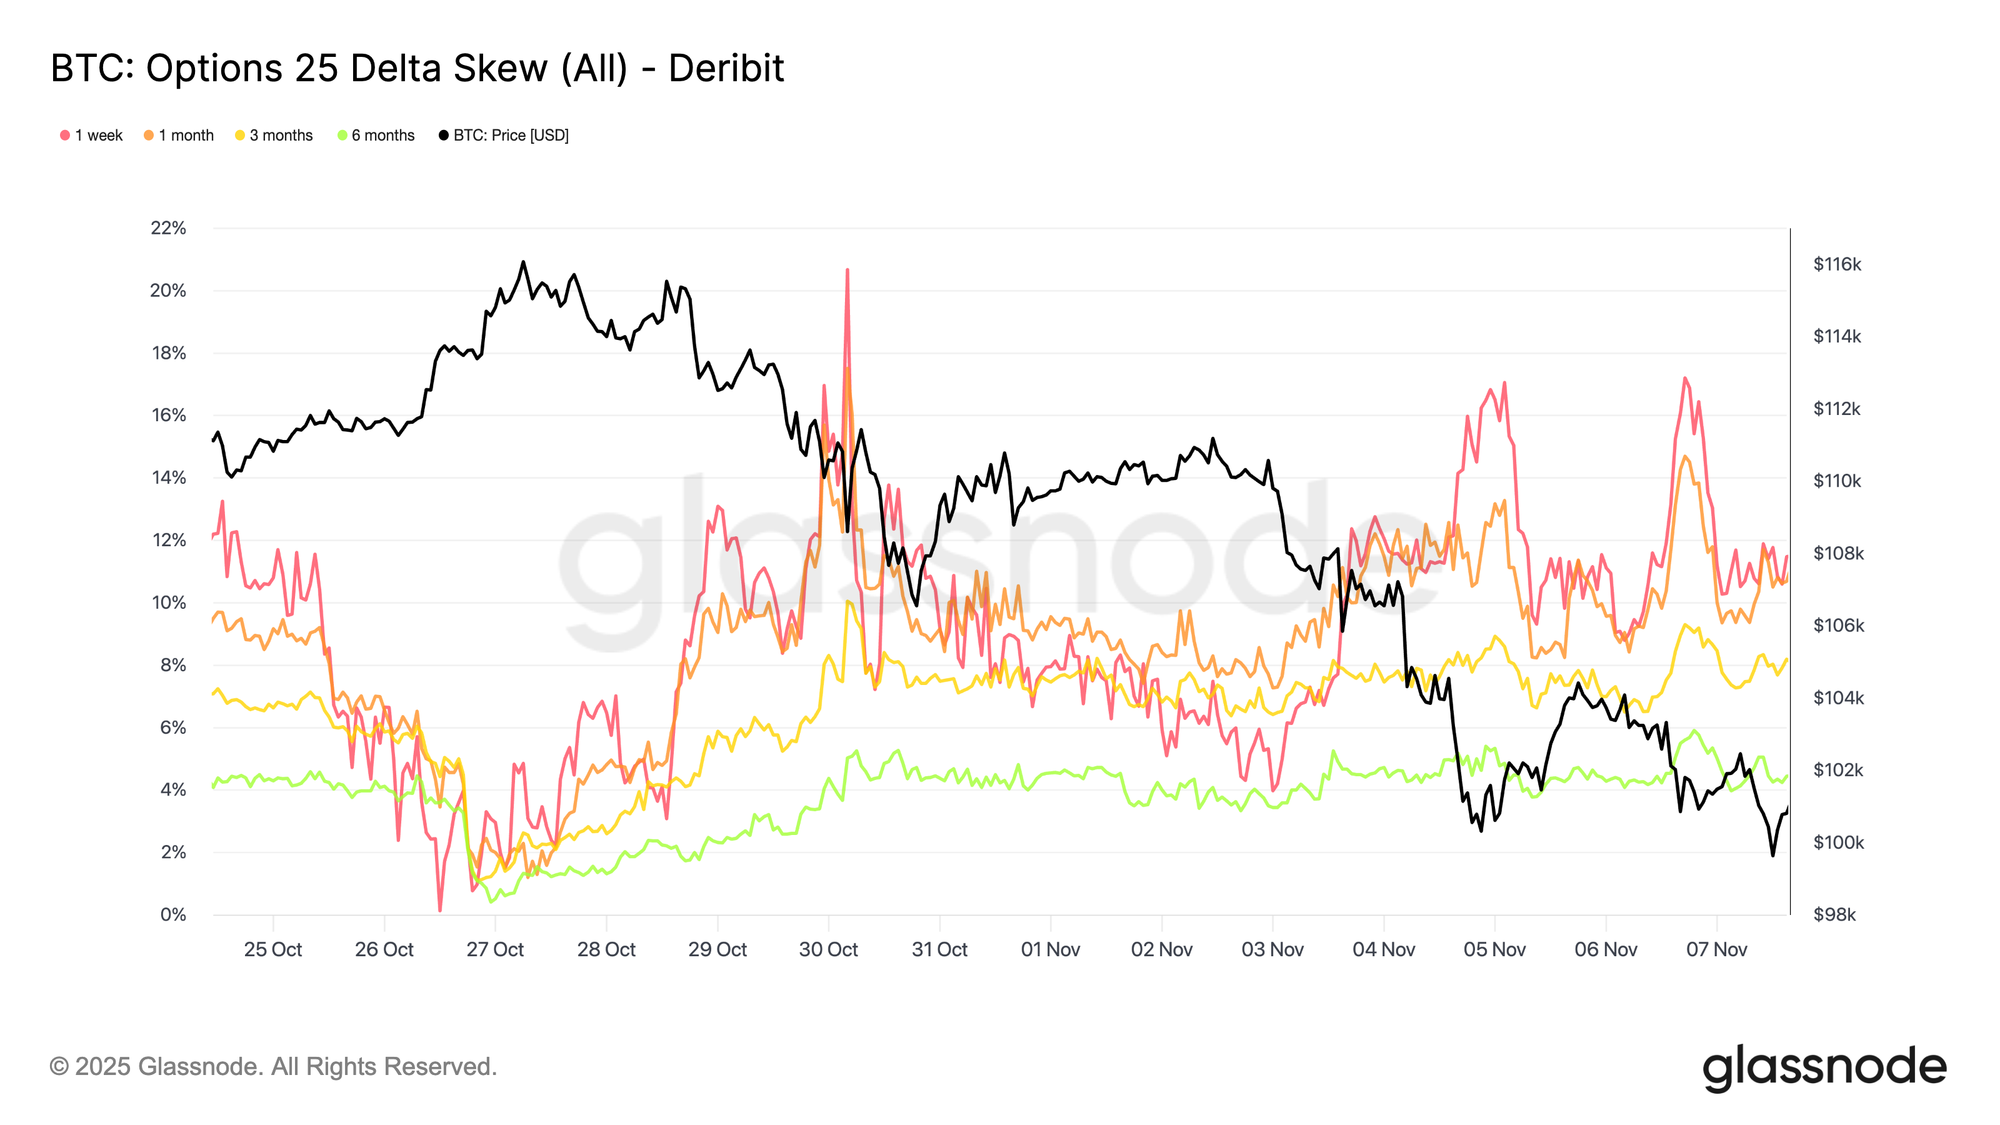
Put protection remains elevated, indicating traders continue to pay a premium for downside insurance. Hedging remains the dominant theme, with short-term expiries pricing roughly 11% implied volatility skew in favour of puts. Three-month and six-month expiries show a softer bias, with 8 and 4 volatility points of downside preference, respectively.
For now, the absence of a clear catalyst limits the potential for skew to shift in favor of calls. The options market continues to price in a retest of the $100K level and a potential break below. However, what will ultimately matter is how the market reacts if that test occurs, rather than the mere pricing of the event.
Implied Volatility in a Range
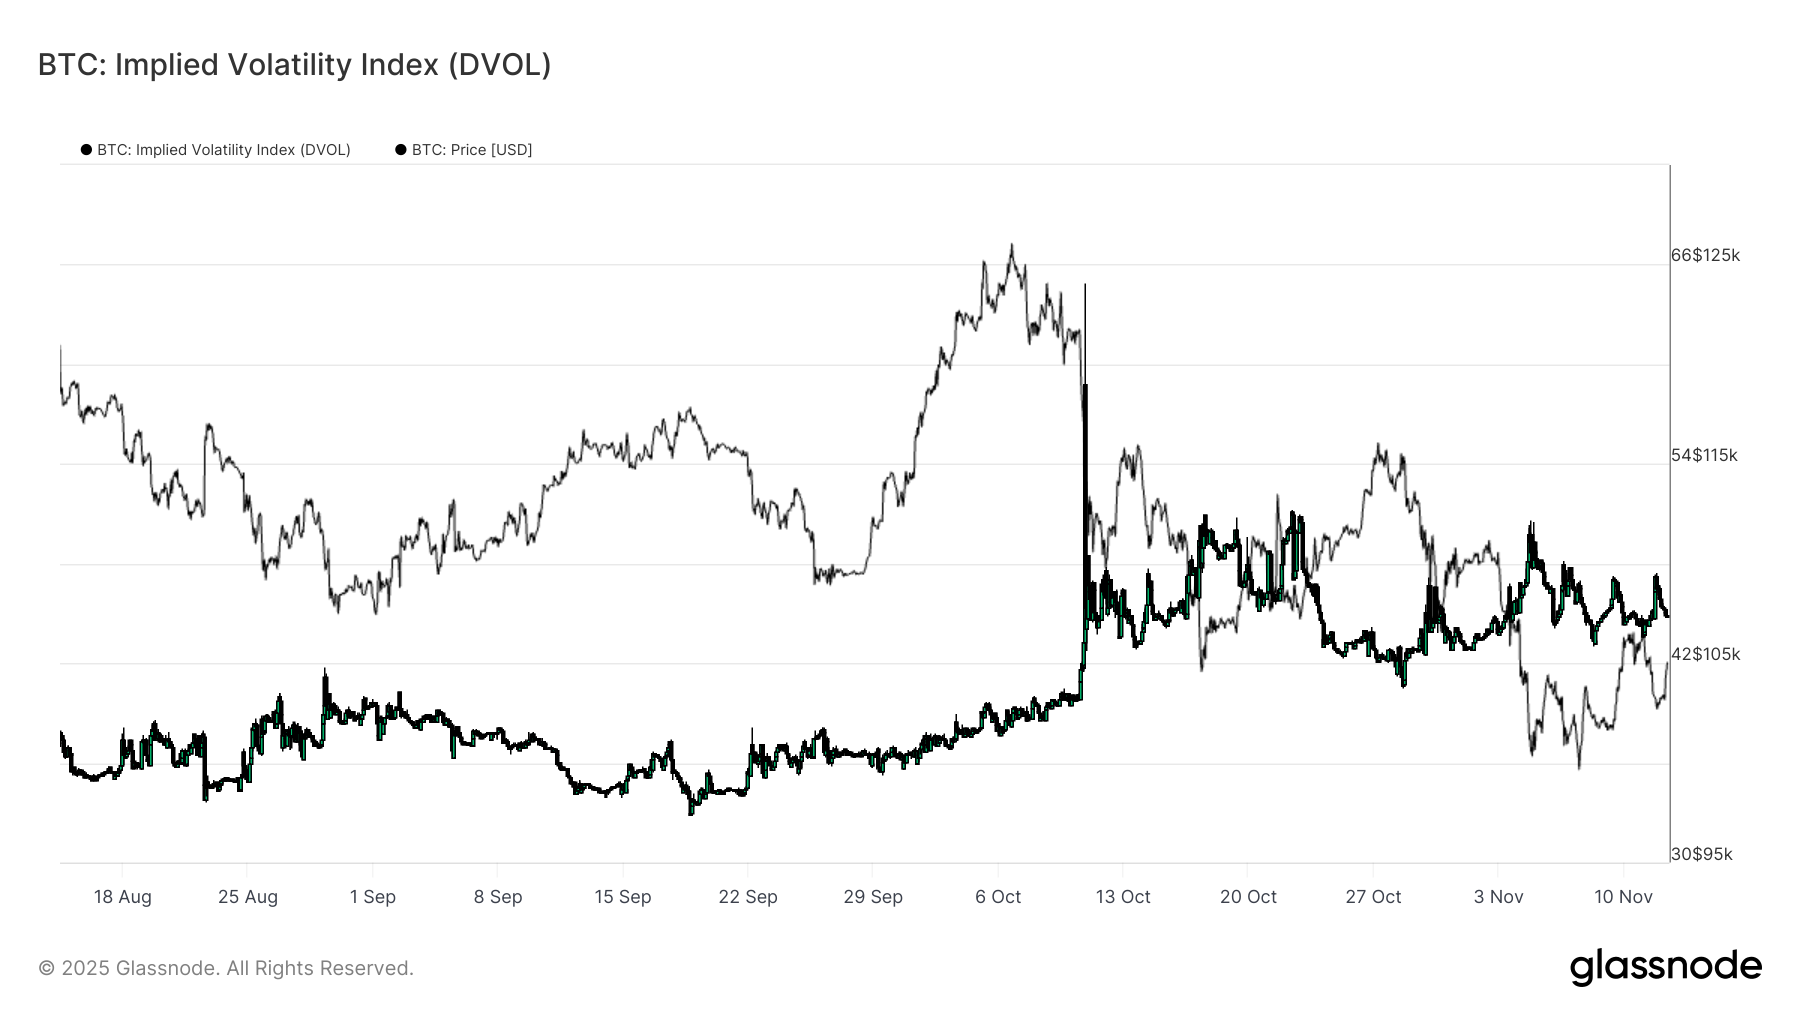
Transitioning from skew to volatility, the broader volatility environment has settled into a holding pattern. The DVOL, Bitcoin’s implied volatility index that measures the market’s expectation of future volatility derived from options prices, remains elevated but range-bound.
Since the October 10 liquidation event, volatility has shifted to a higher regime, oscillating between 40 and 50. This range suggests that the market has adjusted to a higher baseline of uncertainty without entering a state of panic. Volatility remains supported by macroeconomic risk factors and cautious sentiment; however, the absence of further expansion points to consolidation rather than capitulation.
The $100K Line of Defense
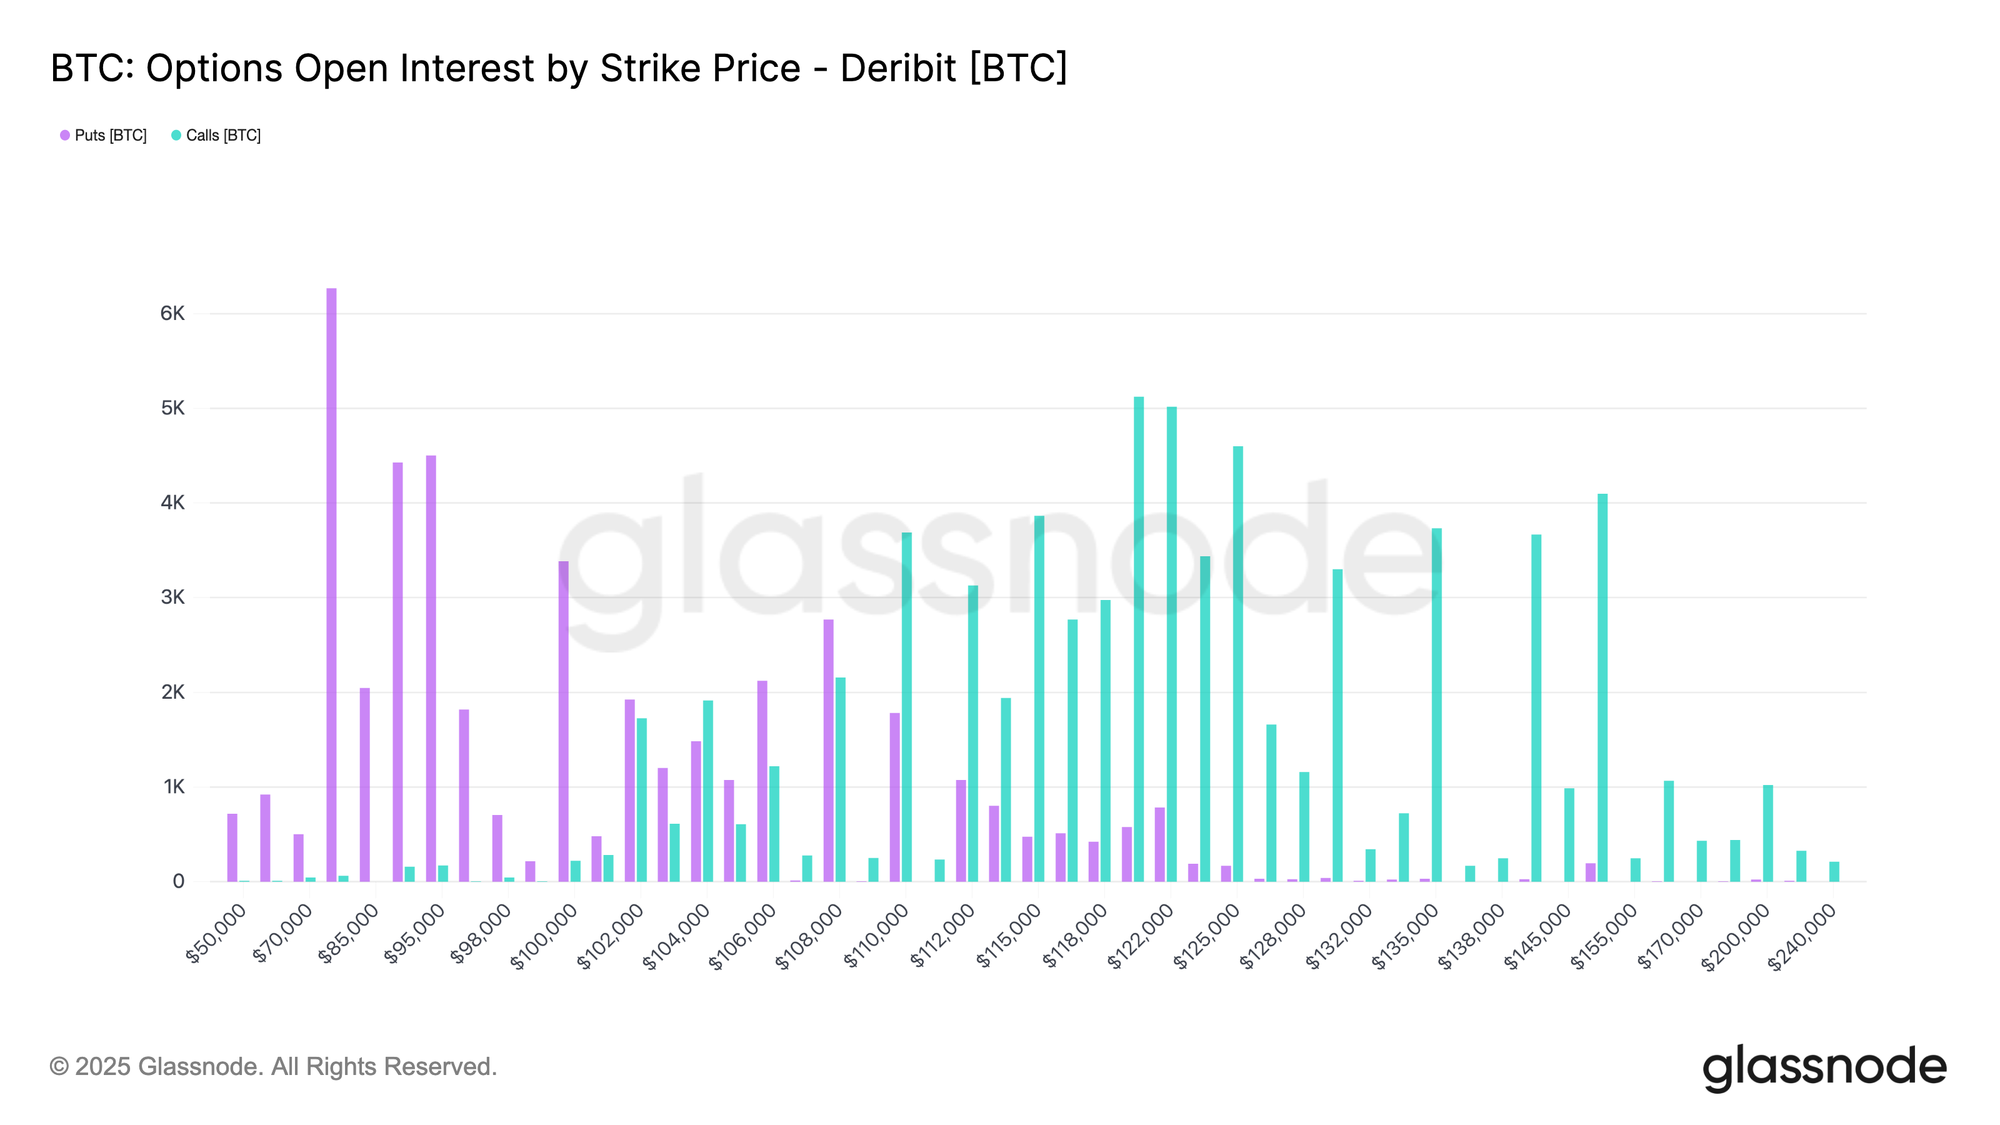
Looking at the end-of-November expiry, open interest clusters heavily around and just below the $100K strike, making it a critical battleground. A decisive break below this level could trigger dealer hedging flows that amplify downside volatility.
If spot retests the $100K area, brief intraday dips below are possible, but a sustained close beneath this threshold would likely mark a shift toward extreme bearish sentiment and potentially ignite another wave of volatility.
Flows Reflect Short-Term Protection Bias
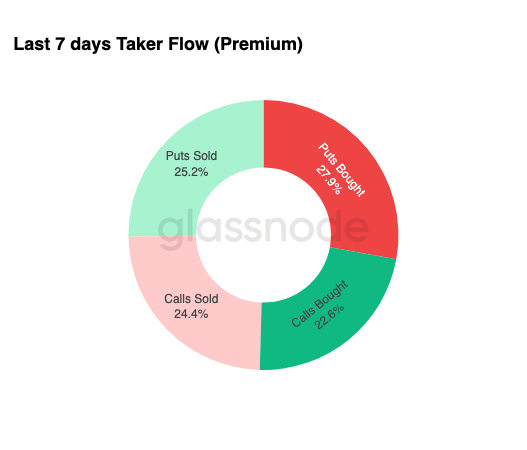
Finally, option flows over the past week reinforce this cautious positioning. Activity was concentrated on the put side, with notable buying between the 108K and 95K strikes.
Some flows reflected outright long protection, such as the 100K strike expiring November 28, while others were structured as calendar spreads, for example, buying the 108K November expiry while selling the 108K December expiry. This pattern effectively captures the current stance; traders anticipate near-term turbulence but remain neutral to moderately optimistic over the longer term.
Options Traders’ Psychology
The next potential catalyst is the resolution of the U.S. government shutdown, an outcome that would likely be welcomed by markets. However, ongoing tariff tensions are expected to keep volatility elevated through Q4. Until the December 10 FOMC meeting, risk appetite is likely to remain muted, as the event is broadly perceived as neutral.
For traders, the 25-delta skew remains the primary gauge for tracking shifts in sentiment. A sustained flattening or reversal toward call bias would signal that market participants are beginning to regain confidence in the upside.
Conclusion
Bitcoin continues to trade within a mild bearish range, defined by strong resistance between $106K–$118K and key structural support near $97.5K–$100K. The market remains under the influence of top-heavy supply, with short-term holders still realizing losses. On-chain data highlighted a brief accumulation near $100K, suggesting localized support, yet without a decisive reclaim of the short-term holders’ cost basis (~$111.9), upside momentum is likely to stay constrained.
Off-chain indicators also echo this cautious tone. ETF outflows, muted funding rates, and low open interest point to subdued speculative engagement, while options traders continue to favor downside protection around the $100K line.
Overall, both on-chain and off-chain signals portray a market in a state of consolidation, stabilizing yet not yet ready to confirm a bullish reversal. Until renewed inflows or a clear macro catalyst emerge, Bitcoin appears bound to oscillate within this $97K–$111.9K corridor, with $100K remaining the psychological line of defence.
Disclaimer: This report does not provide any investment advice. All data is provided for informational and educational purposes only. No investment decision shall be based on the information provided here, and you are solely responsible for your own investment decisions.
Exchange balances presented are derived from Glassnode’s comprehensive database of address labels, which are amassed through both officially published exchange information and proprietary clustering algorithms. While we strive to ensure the utmost accuracy in representing exchange balances, it is important to note that these figures might not always encapsulate the entirety of an exchange’s reserves, particularly when exchanges refrain from disclosing their official addresses. We urge users to exercise caution and discretion when utilizing these metrics. Glassnode shall not be held responsible for any discrepancies or potential inaccuracies.
Please read our Transparency Notice when using exchange data.