BTC Market Pulse: Week 10

insights.glassnode发布于2026-03-02更新于2026-03-02

文章摘要

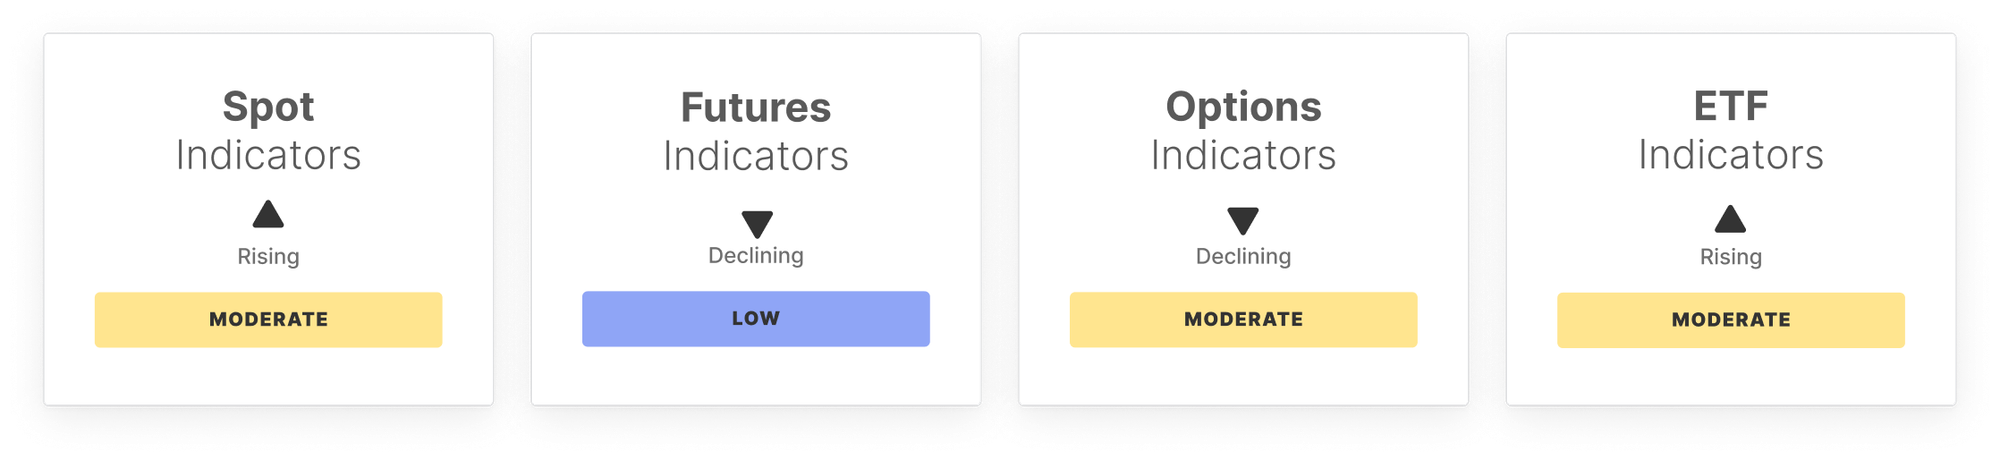
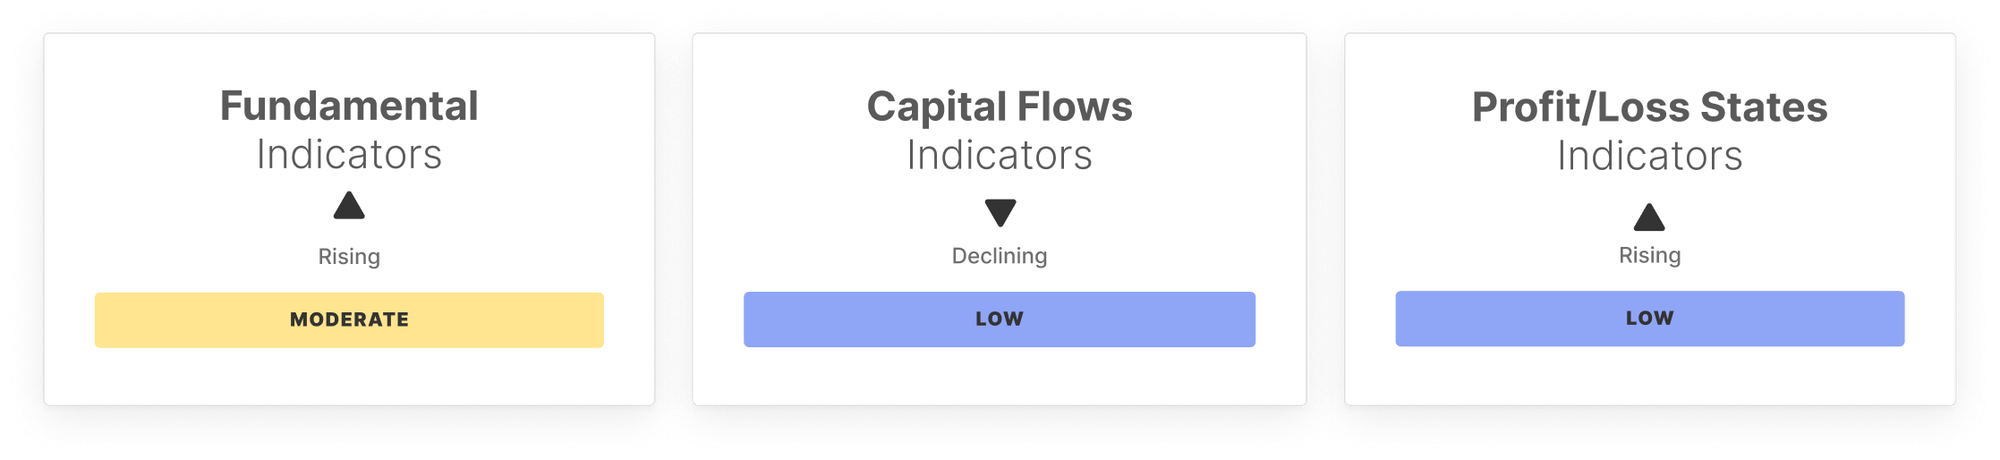
BTC Market Pulse Week 10 indicates a market in early-stage recovery but still fragile. Momentum is improving with RSI lifting from recent lows, though it remains below neutral. Spot CVD has improved, suggesting reduced selling pressure, while futures CVD stays negative, reflecting caution. Open interest has slightly decreased, indicating modest de-risking. Options markets show mixed signals with negative volatility spread but elevated downside hedging demand. On-chain activity is improving with increased active addresses and transfer volume, yet realized cap change remains negative and NUPL is still loss-dominant. Overall, the market shows signs of stabilization but lacks strong bullish confirmation.

Read the full report in PDF format.

Access PDF

Overview

While no decisive breakout has occurred, several metrics suggest conditions are gradually improving beneath the surface.Momentum is attempting to rebuild. RSI has lifted off recent lows but remains below the neutral 50 threshold, signalling recovery without full bullish control.

Spot CVD has improved materially, reflecting reduced aggressive selling, while futures CVD remains net negative, pointing to continued caution in leveraged markets. Open interest has edged lower, suggesting modest de-risking rather than fresh speculative expansion.

Options markets present a mixed picture. Volatility spread remains deeply negative, implying complacent implied volatility relative to realised moves, yet 25-delta skew has pushed above its upper band, signalling elevated downside hedging demand. Funding rates have cooled sharply, highlighting reduced appetite for leveraged long exposure.

On-chain activity shows constructive undertones. Daily active addresses and transfer volume have picked up, while transaction fees have risen in line with healthier network usage. However, realized cap change remains negative and NUPL stays firmly in loss-dominant territory, underscoring that broader capital flows and investor profitability remain fragile.

Positioning metrics reinforce a balanced but cautious structure. The STH/LTH ratio remains slightly elevated, hot capital share has declined meaningfully, and percent supply in profit continues to sit near the lower end of its historical range. Collectively, this points to a market transitioning from distribution pressure toward stabilisation, but without clear confirmation of sustained bullish expansion.

Overall, the backdrop reflects early-stage recovery dynamics within a still fragile environment. Momentum and activity are improving, yet conviction remains muted across derivatives, options, and capital flow metrics.

Off-Chain Indicators
On-Chain Indicators
🔗 Access the full report in PDF

Don't miss it!

Smart market intelligence, straight to your inbox.

Subscribe now
  • Follow us and reach out on X
  • Join our Telegram channel
  • For on-chain metrics, dashboards, and alerts, visit Glassnode Studio

Disclaimer: This report does not provide any investment advice. All data is provided for information and educational purposes only. No investment decision shall be based on the information provided here and you are solely responsible for your own investment decisions.

Exchange balances presented are derived from Glassnode’s comprehensive database of address labels, which are amassed through both officially published exchange information and proprietary clustering algorithms. While we strive to ensure the utmost accuracy in representing exchange balances, it is important to note that these figures might not always encapsulate the entirety of an exchange’s reserves, particularly when exchanges refrain from disclosing their official addresses. We urge users to exercise caution and discretion when utilizing these metrics. Glassnode shall not be held responsible for any discrepancies or potential inaccuracies. 

Please read our Transparency Notice when using exchange data.

热门币种推荐

相关问答

QWhat does the RSI level indicate about the current BTC market momentum according to the report?

AThe RSI has lifted off recent lows but remains below the neutral 50 threshold, signaling that momentum is attempting to rebuild but without full bullish control.

QHow do the spot and futures Cumulative Volume Delta (CVD) metrics differ in their signals for the BTC market?

ASpot CVD has improved materially, reflecting reduced aggressive selling, while futures CVD remains net negative, indicating continued caution in leveraged markets.

QWhat mixed signals are present in the options markets for Bitcoin as described in the report?

AThe volatility spread remains deeply negative, implying complacent implied volatility, yet the 25-delta skew has pushed above its upper band, signaling elevated downside hedging demand.

QWhat on-chain metrics show constructive undertones despite the fragile market environment?

ADaily active addresses and transfer volume have picked up, and transaction fees have risen in line with healthier network usage, though realized cap change remains negative and NUPL is still in loss-dominant territory.

QWhat does the report suggest about overall market positioning and investor sentiment based on metrics like the STH/LTH ratio and percent supply in profit?

AThe STH/LTH ratio remains slightly elevated, hot capital share has declined meaningfully, and percent supply in profit is near the lower historical range, indicating a market transitioning from distribution pressure toward stabilization but lacking clear bullish expansion confirmation.

你可能也喜欢

全球股市的风暴点:韩国股市的去杠杆已基本完成

近期韩国股市出现剧烈波动,KOSPI指数自6月高点最大回撤达32%,成为全球AI行情调整的“风暴中心”。文章指出,市场下跌的深层原因并非基本面恶化,而是由高度集中的杠杆资金结构所驱动。 具体来看,核心风险来源于两方面: 1. **杠杆ETF大规模去化**:前期规模一度接近500亿美元的杠杆ETF,其“每日再平衡”机制在下跌中引发了“股价下跌→强制平仓”的负向循环。目前其规模已从高点收缩约240亿美元,去化进度已达约75%,剩余压力显著收敛。监管层也已出台新规,从8月起严格限制此类产品,从源头降低风险。 2. **对冲基金快速降杠杆**:通过互换交易放大敞口的对冲基金,其多空持仓比率已从峰值显著回落,净多头水平显示杠杆已下降超过50%,最剧烈的被动去杠杆阶段基本完成。 相比之下,韩国居民融资余额占股市市值比重很小(约0.5%),且不具备强制平仓机制,难以成为系统性风险的核心来源。 综合而言,最容易引发“连锁抛售”的高杠杆结构已大部分出清,市场正从“流动性驱动的下跌”过渡到“基本面驱动的定价”。只要AI产业趋势未发生根本逆转,本轮调整更接近一次拥挤交易的集中出清,而非行情的终结。 文章最后强调,AI代表的硅基革命趋势不可逆,波动是参与趋势的成本而非风险。每一次调整都是在进行筹码结构的优化,并为认清趋势的投资者提供新的参与机会。

链捕手1小时前

全球股市的风暴点:韩国股市的去杠杆已基本完成

链捕手1小时前

自2024年以来推出的加密货币代币中,92.9%跌破发行价:CryptoRank

加密货币数据平台CryptoRank的最新研究显示,自2024年以来发行的加密货币代币中,有高达92.9%目前正低于其代币生成事件(TGE)时的初始价格。 该分析聚焦于市值超过1亿美元的项目,在2024年至2026年间发行的113个项目中,仅有8个仍保持在发行价之上,其余105个均已跌破。这意味着只有约7.1%的项目为投资者带来了正回报,而整体样本的中位数回报率低至-95.7%。 表现最突出的项目是Hyperliquid (HYPE),自TGE以来上涨了1,519%。其次是Ondo Finance (ONDO)、EverValue Coin (EVA)和Midnight Network (NIGHT),涨幅分别为101.4%、20.32%和16.50%。 数据表明,与过去市场周期中新股常持续上涨不同,当前投资者变得更加挑剔。资本正越来越集中于少数已证明其产品采用度、生态增长或强劲市场需求的项目。许多新代币难以维持初始估值。 这一趋势反映了市场关注点的转变:投资者愈发看重代币经济学、流通供应量、解锁时间表和长期实用性,而非仅关注上市初期的价格动能。 研究结果可能影响未来项目的发行策略。项目因过高的完全稀释估值(FDV)、上市初期流通量不足以及大量未来代币解锁计划而备受审视,这些因素都可能在新供应进入市场时对价格构成下行压力。因此,开发者和投资者未来或将更重视可持续的代币分发模式和长期的生态增长,而非激进的初始估值。

ambcrypto1小时前

自2024年以来推出的加密货币代币中,92.9%跌破发行价:CryptoRank

ambcrypto1小时前

交易

现货

热门文章

加密市场宏观研报:《GENIUS Act》法案取得重大进展,BTC突破历史新高,后市全新展望

2025年5月22日,比特币价格正式突破11万美元大关,创下历史新高。在政策面、宏观经济、资金面与投资者结构共同作用下,一场结构性牛市浪潮正在展开。而此轮上涨背后的核心驱动,是美国《GENIUS稳定币法案》的实质性进展以及多项利好的叠加。本文将从政策端突破、宏观环境转向、链上与ETF资金结构、交易行为演化,以及重点受益赛道五大维度,全面解析此轮BTC再创新高的深层逻辑,并前瞻下半年市场的潜在趋势。

1.8k人学过发布于 2025.05.22更新于 2025.05.22

加密市场宏观研报:《GENIUS Act》法案取得重大进展,BTC突破历史新高,后市全新展望

相关讨论

欢迎来到HTX社区。在这里,您可以了解最新的平台发展动态并获得专业的市场意见。以下是用户对BTC(BTC)币价的意见。

活动图片