Bitcoin Activity Plummets: New & Active Addresses Both Down 40%+ Since 2021

bitcoinist发布于2026-02-20更新于2026-02-20

文章摘要

Bitcoin on-chain activity has significantly declined, with both Daily Active Addresses and Network Growth dropping over 40% compared to February 2021. According to Santiment, the number of unique daily active addresses currently stands at 650,000 (down 42%), while new address creation—measured by Network Growth—is at 291,000 (down 47%). This decline persisted throughout 2025 despite Bitcoin reaching new all-time highs, forming a bearish divergence between market cap growth and network utility. Santiment suggests these metrics must show recovery for a sustained bullish rally, though the current low activity does not necessarily signal a long-term bear market. Bitcoin's price remains sideways near $66,400.

Bitcoin on-chain data shows both the Daily Active Addresses and Network Growth indicators have seen sharp drops compared to five years ago.

Wallet-Related Bitcoin Metrics Have Declined In Recent Years

As highlighted by on-chain analytics firm Santiment in an X post, there is a staggering difference between the level of activity on the Bitcoin network today and February 2021.

There are several on-chain metrics that can be used to gauge blockchain activity, but two in particular are of focus here: the Daily Active Addresses and Network Growth.

The first of these measures the total number of BTC addresses that are coming online every day. A wallet is said to come ‘online’ when it participates in some kind of transaction activity on the network. Thus, the Daily Active Addresses essentially tracks the unique daily count of addresses making at least one transfer on the network.

The other indicator, the Network Growth, tells us about the amount of addresses that are coming online on the blockchain for the first time. In other words, it tracks the amount of new addresses joining the network every day.

Now, here is the chart shared by Santiment that shows the trend in the Daily Active Addresses and Network Growth for Bitcoin over the last several years:

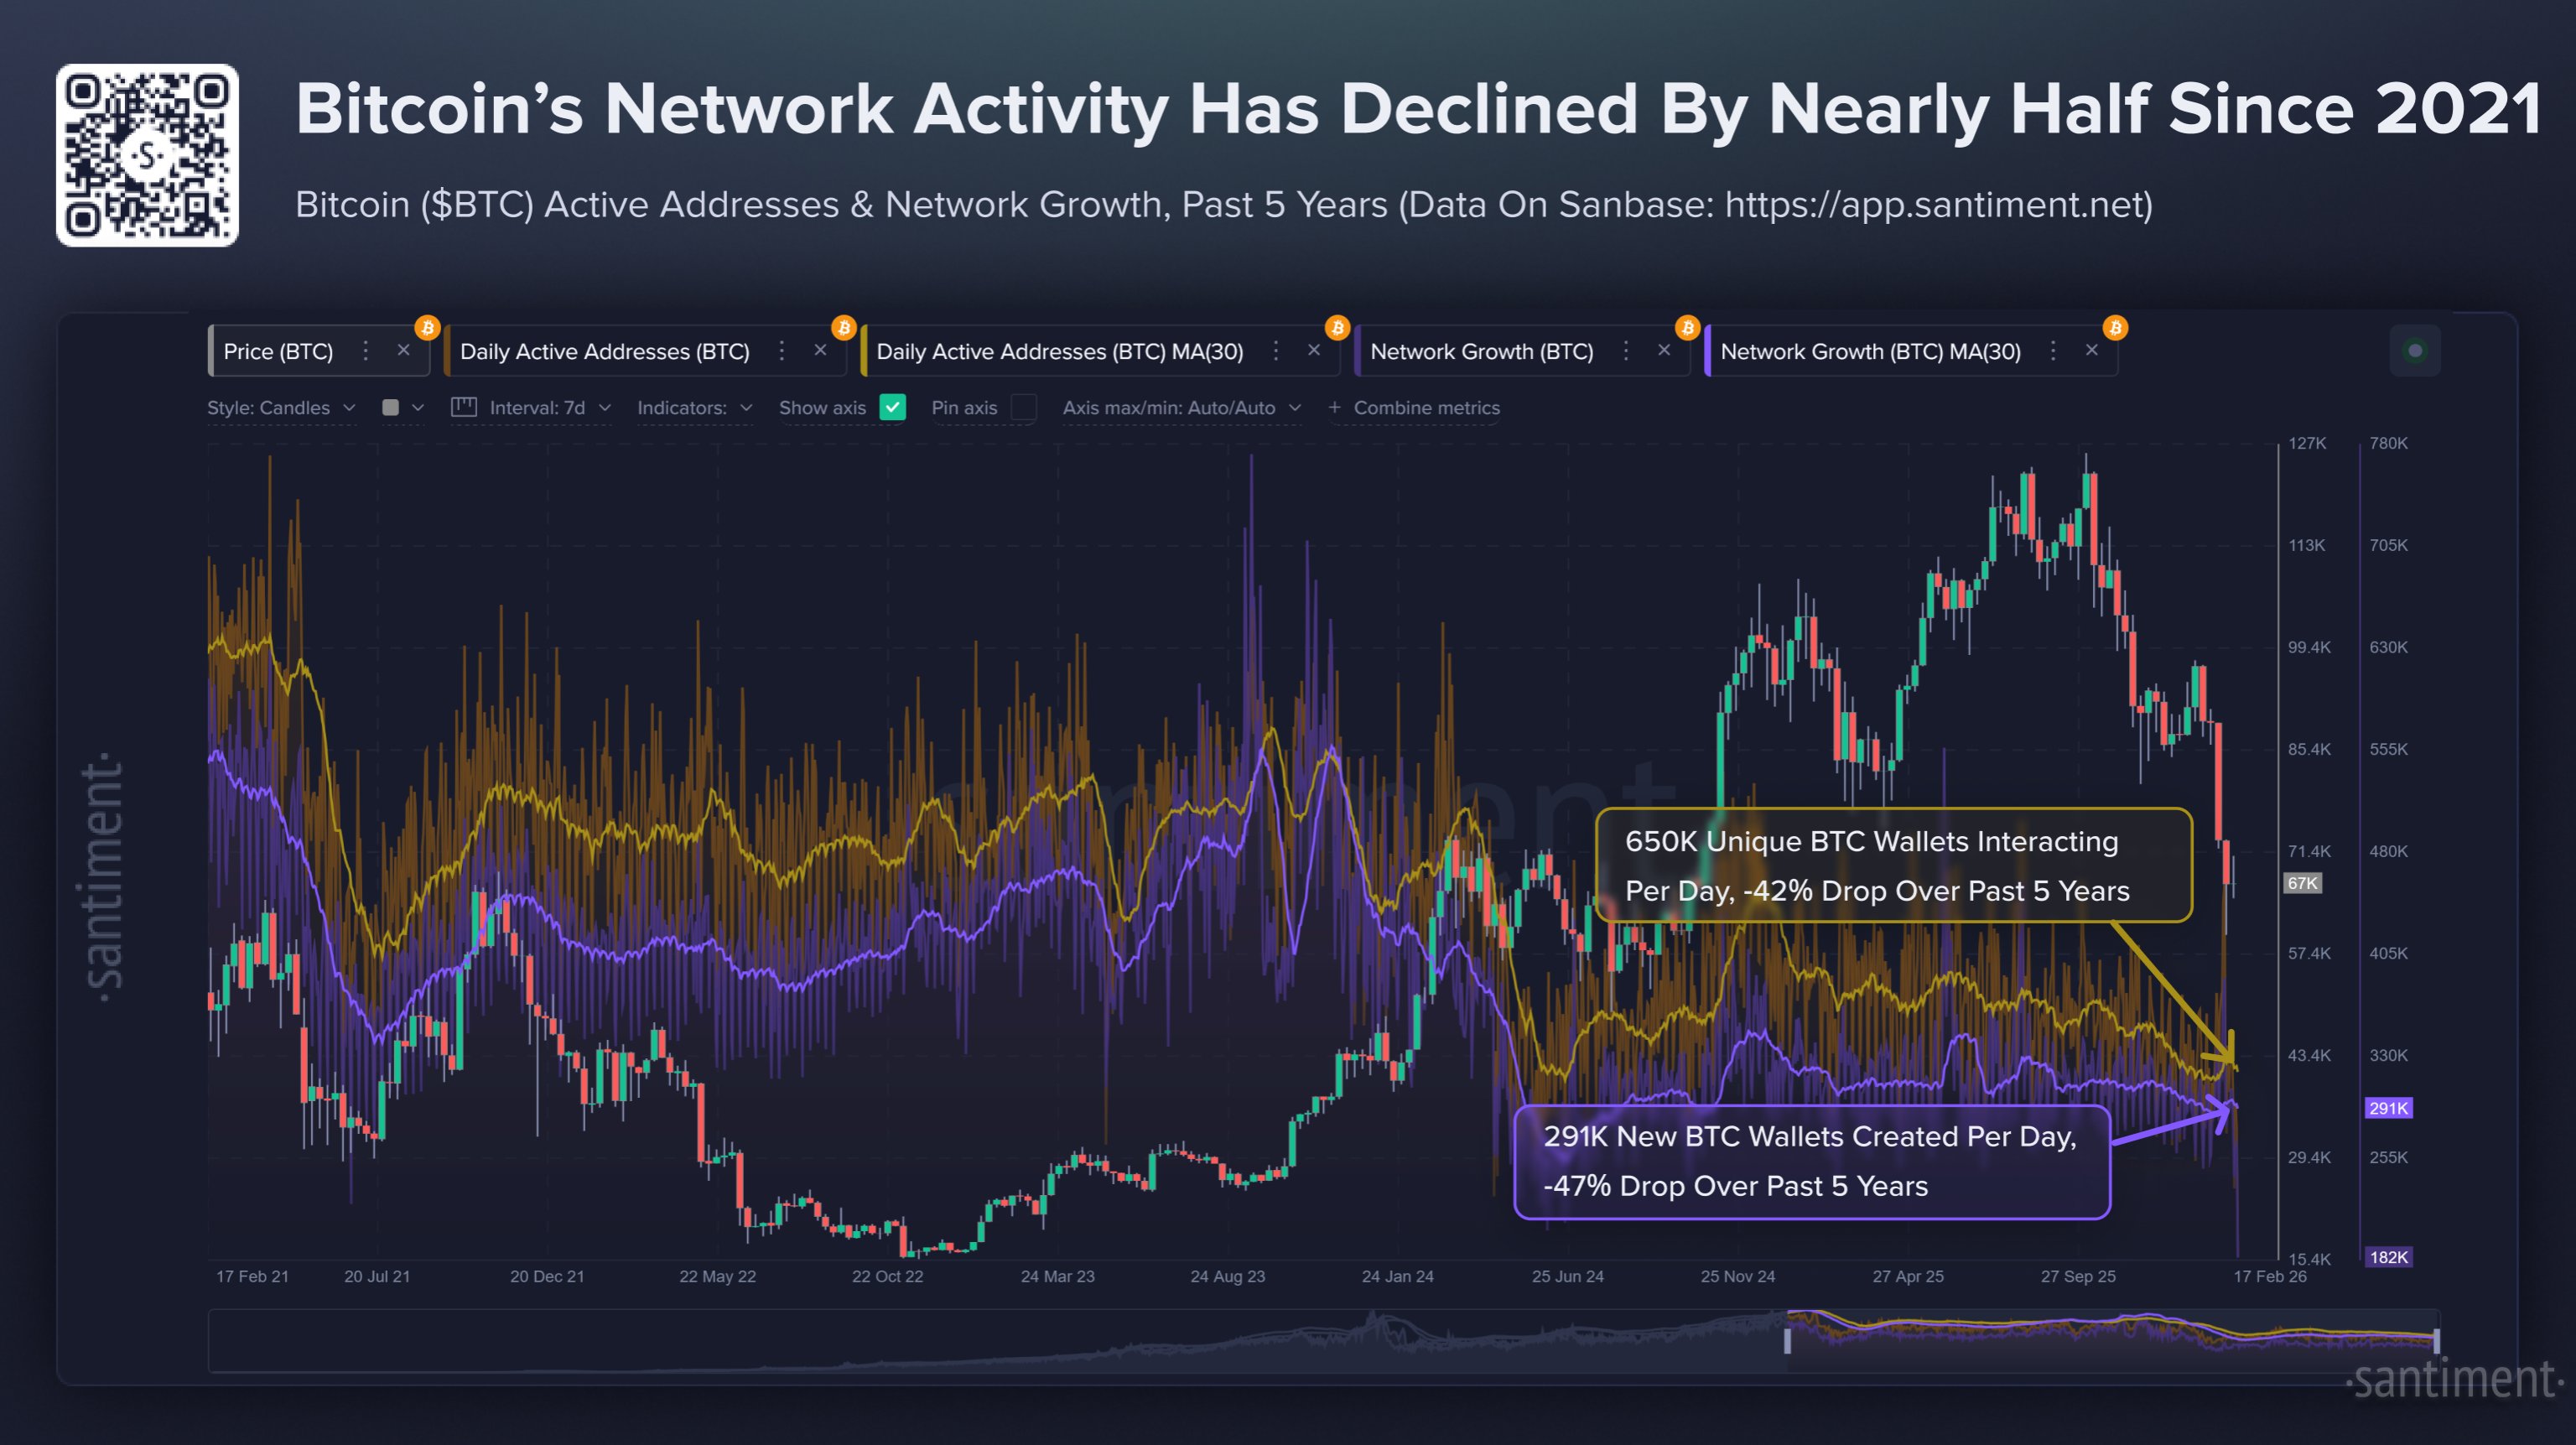
Both the metrics appear to have declined in recent years | Source: Santiment on X

As displayed in the above graph, both the Bitcoin Daily Active Addresses and Network Growth witnessed a significant drop at the start of 2024. The former made some recovery as the cryptocurrency observed its bull rally in the second half of the year, but the latter still remained at relatively low levels despite a jump.

In 2025, both indicators again slumped and took to sideways movement, despite the fact that Bitcoin explored fresh highs. Santiment noted that “there was a clear bearish divergence that had been forming throughout 2025 as market caps continued to hit new heights while Bitcoin’s utility declined.”

During the recent market downturn, the indicators have gone a notch lower. Currently, there are 650,000 unique addresses interacting on the blockchain per day, which is down 42% compared to February 2021, five years ago. Similarly, the Network Growth is sitting at a value of 291,000, reflecting a 47% drop for the same window.

So, what does the sharp drop in activity mean for Bitcoin? According to the analytics firm, it doesn’t imply that “crypto is dead” or that the digital asset is entering a multi-year bear market. That said, the return of bullish winds could still depend on the trend in the network metrics. As Santiment explained:

A justification for crypto beginning to see a true long-term relief rally will be when metrics like active addresses and network growth begin to rise.

BTC Price

Bitcoin continues to move sideways as its price trades around the $66,400 level.

The trend in the price of the coin over the last five days | Source: BTCUSDT on TradingView

相关问答

QWhat are the two key Bitcoin on-chain indicators discussed in the article that have seen a sharp decline?

AThe two key indicators are Daily Active Addresses and Network Growth.

QHow much has the Daily Active Addresses count decreased compared to February 2021?

AThe Daily Active Addresses count has decreased by 42% compared to February 2021.

QAccording to Santiment, what does the decline in these on-chain metrics NOT imply for Bitcoin?

AThe decline does not imply that 'crypto is dead' or that Bitcoin is entering a multi-year bear market.

QWhat specific event does Santiment suggest is needed for a 'true long-term relief rally' in crypto?

ASantiment suggests that a true long-term relief rally will begin when metrics like active addresses and network growth start to rise.

QWhat was the value of the Network Growth indicator at the time of the article, and how does this compare to five years ago?

AThe Network Growth indicator was at a value of 291,000, reflecting a 47% drop compared to five years ago (February 2021).

你可能也喜欢

BTC市场脉搏:第22周

比特币过去一周震荡走低,价格从7.9万美元跌至7.4万美元附近低点后,反弹至7.7万美元左右。价格动能下降21.7%,显示市场买盘力量减弱,卖压有所增加。但同时,现货和永续合约的累计成交量增量(CVD)分别上升77.2%和35.5%,表明卖压正在缓解,市场情绪趋于平衡。交易活跃度下降,现货交易量减少10%,期货未平仓合约下降3.5%,反映出市场投机意愿减弱,投资者态度更加谨慎。 市场亦显现出风险偏好回升的迹象。多头资金费率大幅飙升135.4%,表明市场对多头敞口的需求强烈,看涨情绪有所改善。期权市场25-Delta偏度小幅上升,显示对下行保护的需求略有增加,而未平仓头寸保持稳定。 在传统金融领域,美国现货ETF的MVRV(市值与实现价值比率)微升0.69%,表明ETF持有者的未实现盈利略有扩大。ETF资金净流出状况改善28.9%,显示资金外流压力减轻,情绪趋于稳定,但ETF交易量下降22.9%,意味着相关投机活动放缓。 从网络活动看,每日活跃地址数和实体调整后的转账量均小幅下降,暗示市场可能进入盘整阶段或投资者活动减少。流动性指标显示市场流动性状况更趋稳定,呈现出信念增强、投机活动减少的盘整特征。 然而,盈利指标提示市场压力可能正在增加。净未实现盈利亏损比显著下降,已实现盈利亏损比则显示获利了结减少而亏损实现增加,表明市场情绪偏向谨慎甚至看跌。 总体而言,市场显示出温和与盘整的迹象,特点是活动减少、情绪谨慎以及风险偏好交织。这种复杂局面突显了持续密切关注市场动态和投资者行为的重要性。

insights.glassnode1小时前

BTC市场脉搏:第22周

insights.glassnode1小时前

BTC市场脉搏:第20周

比特币在当周从77,000美元高位震荡上行至82,000美元低位,尽管在局部高点附近动能有所减弱,但买家继续吸纳回调。现货CVD(累计成交量差额)飙升,反映了强烈的看涨情绪和价格上涨的信心增强。同时,现货成交量增加,表明近期的价格走势获得了更多投资者参与,势头增强。然而,价格动能的放缓暗示买卖压力更加平衡,市场可能进入一个潜在的稳定阶段。 期货市场也显示出相似的风险偏好增加迹象。期货未平仓合约上升,表明投机活动升温且市场愿意承担更多风险;永续合约CVD飙升,表明持续的看涨动能。然而,多方资金费率下降,暗示空方兴趣有所增加,看涨情绪可能正在减弱。 期权市场中,对下行保护的需求下降,未平仓合约上升,表明市场预期转向中性至略微看涨。然而,波动率利差激增,表明期权定价蕴含的风险远高于已实现风险,这反映了市场参与者中存在较高的不确定性。 链上活动显著增强,每日活跃地址、实体调整后的转账量以及总手续费收入均有所上升,指向用户参与度提高和网络活动增加。同时,流动性状况持续稳定,短期投机资本的减少降低了立即的卖压,而已实现市值变化则显示出适度的净资本流入。 盈利能力指标也有所改善,市场已从未实现亏损转回盈利状态。然而,处于盈利状态的供应量百分比仍低于通常与大规模获利了结相关的水平,表明市场乐观情绪仍然克制,而非狂热。 总体而言,比特币的市场结构继续改善,得到更强链上活动、更健康的盈利能力和更稳定的持有者仓位的支撑。虽然看涨基调正在形成,但较温和的资本流入和谨慎的情绪表明市场对风险偏好的变化仍然敏感。

insights.glassnode1小时前

BTC市场脉搏:第20周

insights.glassnode1小时前

交易

现货
合约

热门文章

加密市场宏观研报:《GENIUS Act》法案取得重大进展,BTC突破历史新高,后市全新展望

2025年5月22日,比特币价格正式突破11万美元大关,创下历史新高。在政策面、宏观经济、资金面与投资者结构共同作用下,一场结构性牛市浪潮正在展开。而此轮上涨背后的核心驱动,是美国《GENIUS稳定币法案》的实质性进展以及多项利好的叠加。本文将从政策端突破、宏观环境转向、链上与ETF资金结构、交易行为演化,以及重点受益赛道五大维度,全面解析此轮BTC再创新高的深层逻辑,并前瞻下半年市场的潜在趋势。

1.6k人学过发布于 2025.05.22更新于 2025.05.22

加密市场宏观研报:《GENIUS Act》法案取得重大进展,BTC突破历史新高,后市全新展望

相关讨论

欢迎来到HTX社区。在这里,您可以了解最新的平台发展动态并获得专业的市场意见。以下是用户对BTC(BTC)币价的意见。

活动图片