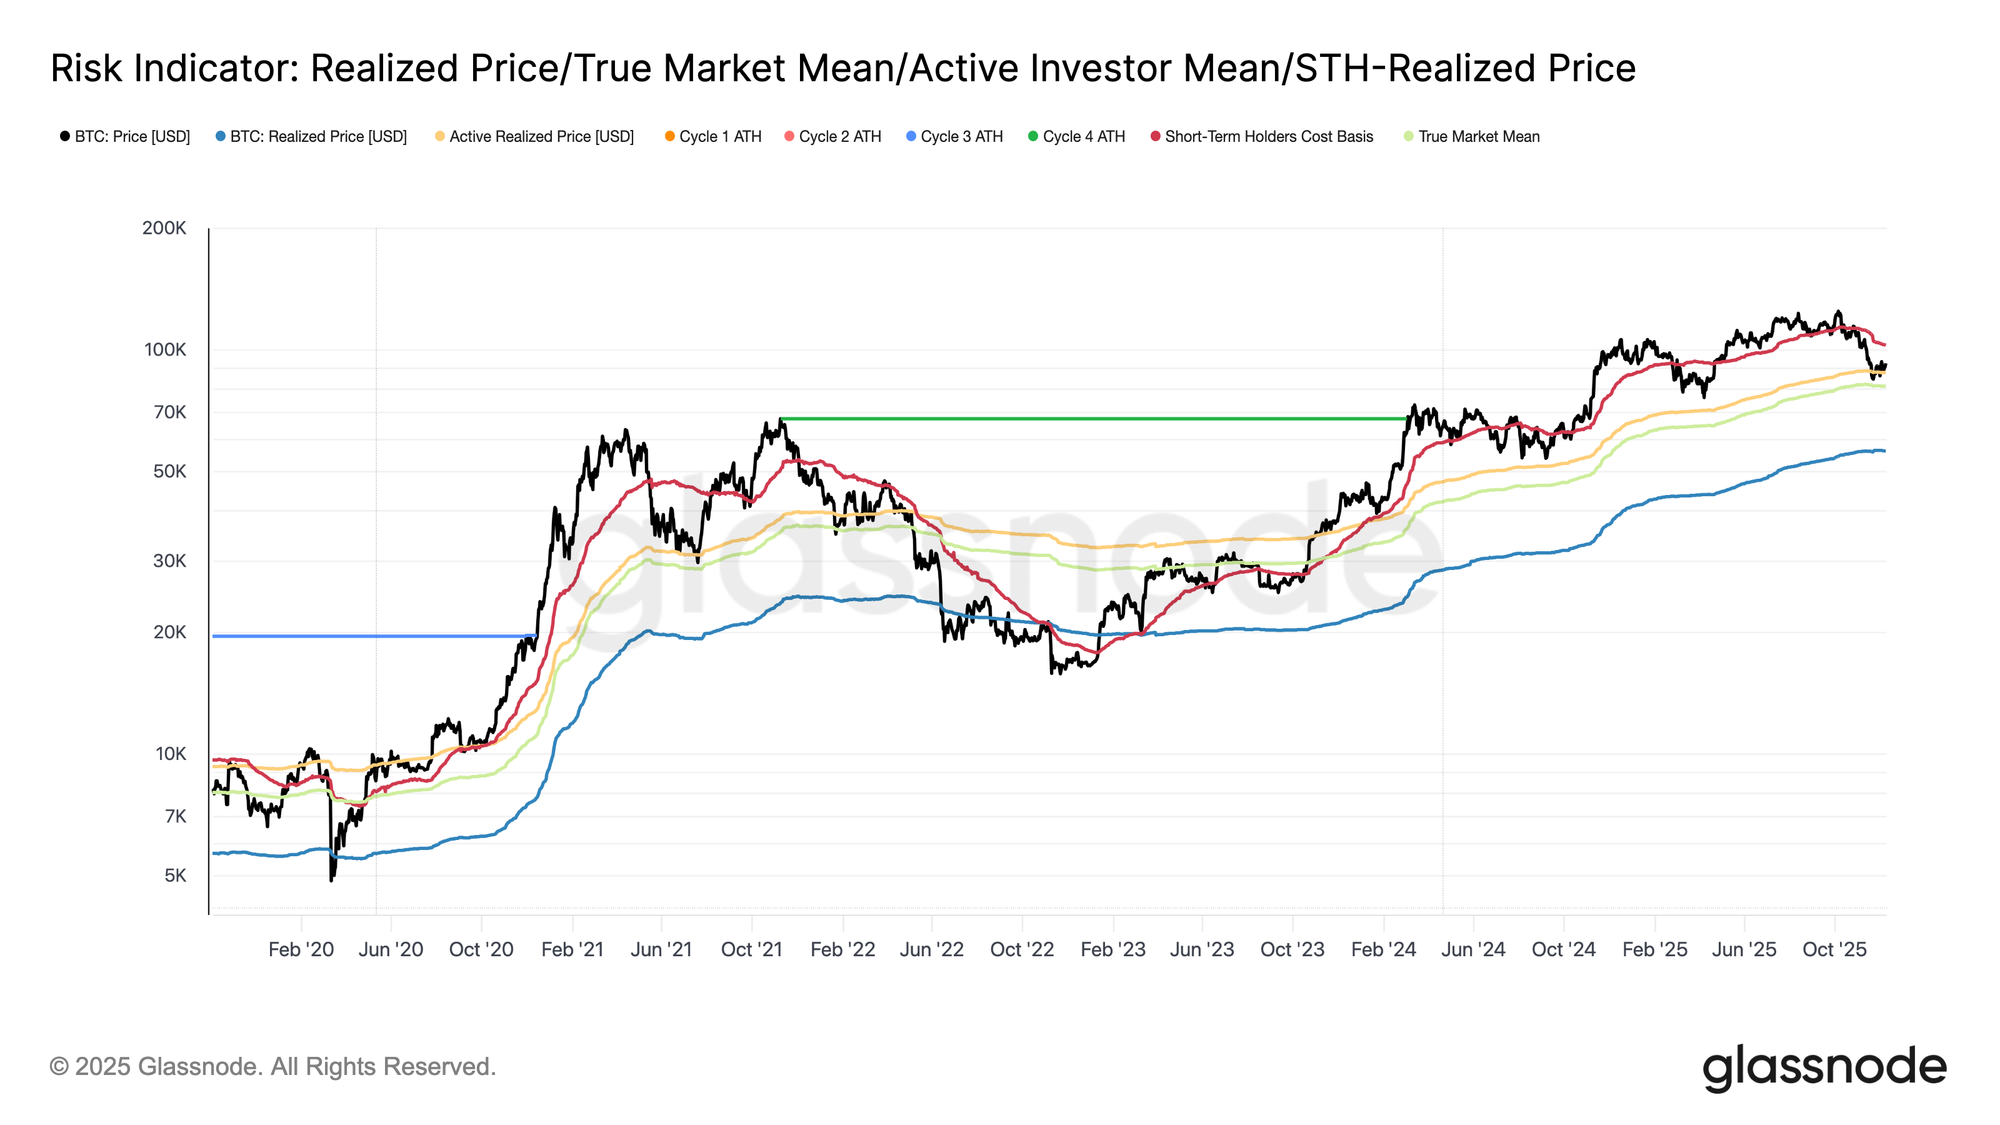
Bitcoin enters the week still confined within a structurally fragile range, bounded by the STH-Cost Basis at $102.7k and the True Market Mean at $81.3k. Last week, we underscored weakening on-chain conditions, thinning demand, and a cautious derivatives landscape that collectively echo the early-2022 setup.
Although price has held marginally above the True Market Mean, unrealized losses continue to expand, realized losses are rising, and spending by long-term investors remains elevated. The key upper thresholds to reclaim are the 0.75 cost-basis quantile at $95k, followed by the STH-Cost Basis. Until then, the True Market Mean remains the most probable bottom-formation zone, barring a new macro shock.
Time Works Against the Bulls
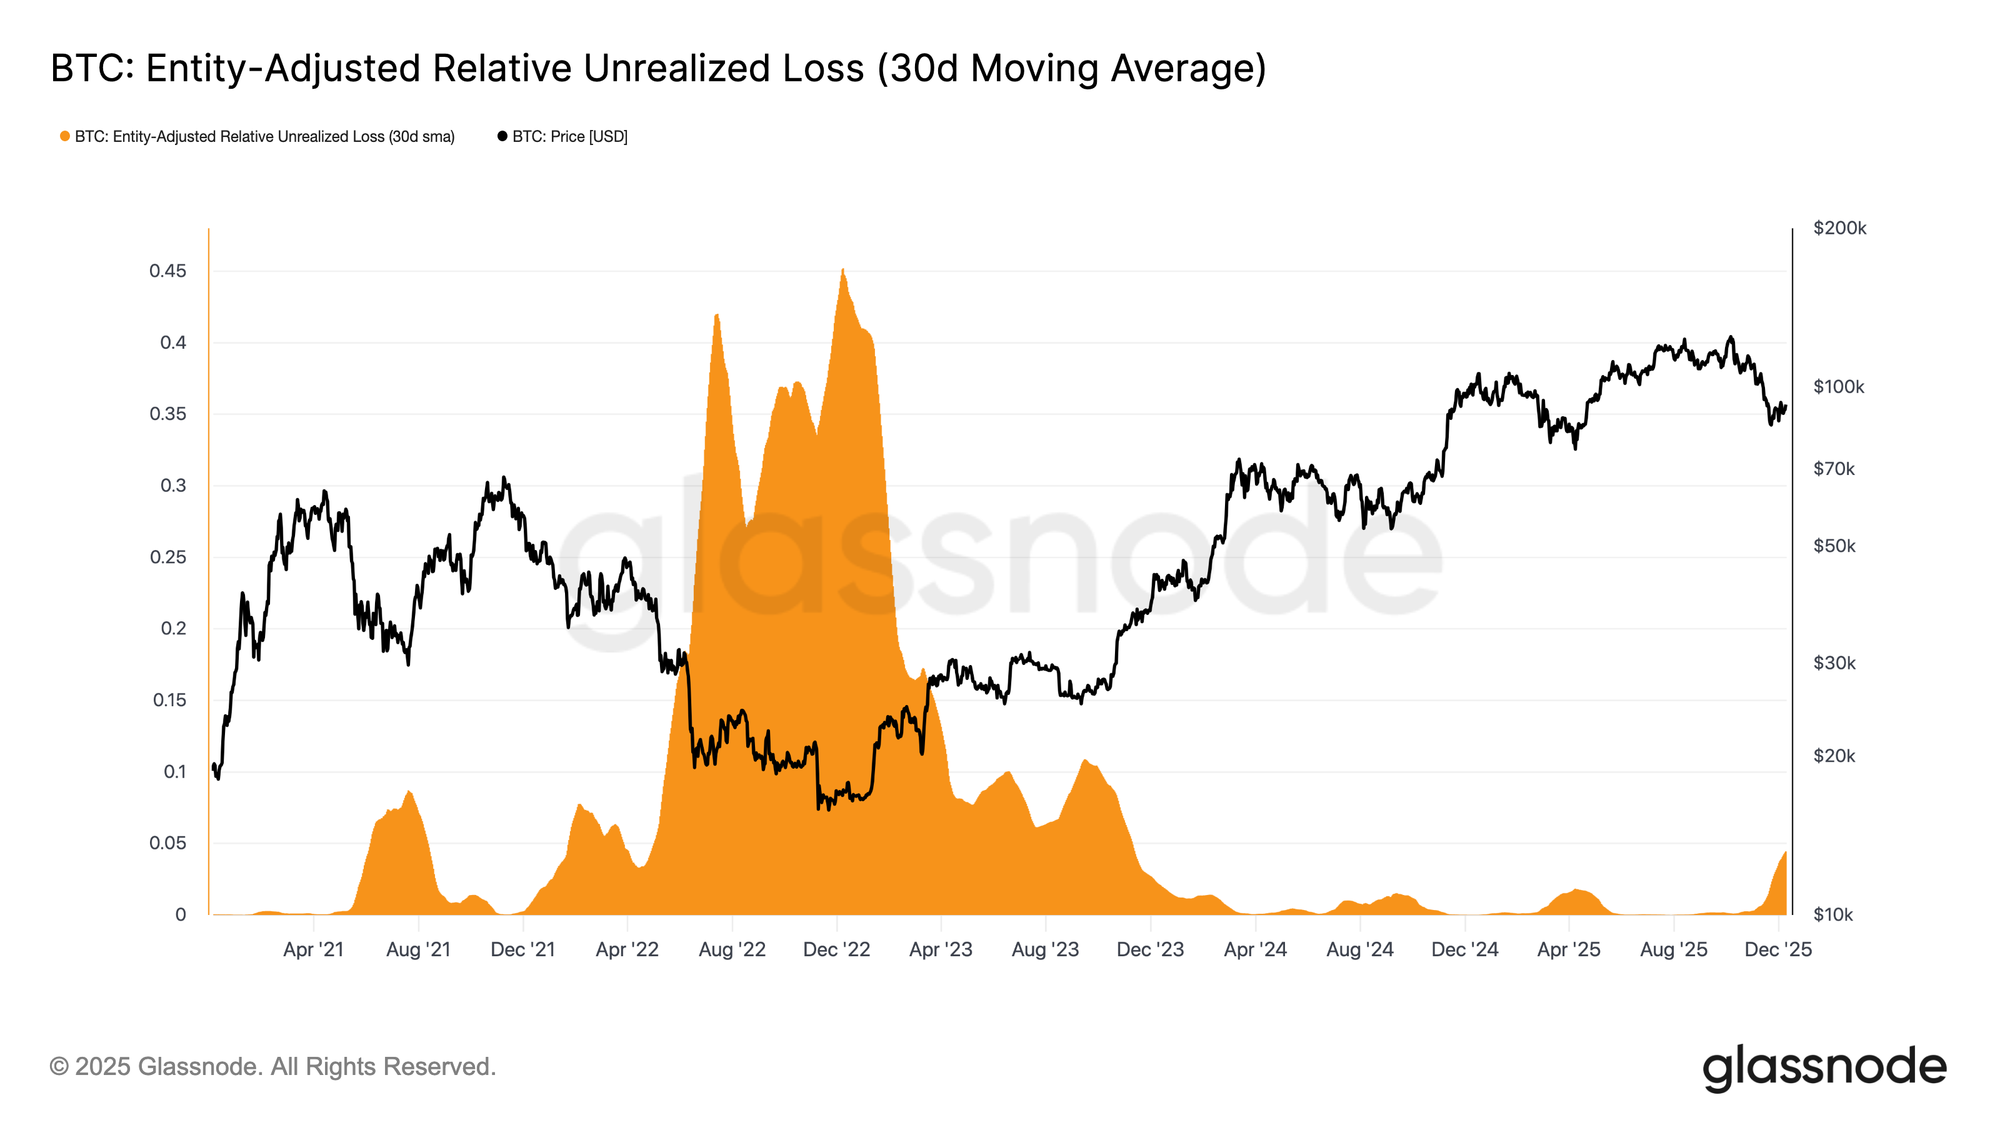
Remaining in a mild bearish phase reflects the tension between modest capital inflows and persistent sell pressure from top buyers. As the market holds within a weak but bounded range, time becomes a negative force, making unrealized losses harder for investors to endure and increasing the likelihood of loss realization.
The Relative Unrealized Loss (30D-SMA) has climbed to 4.4% after nearly two years below 2%, marking a shift from a euphoric phase to one of elevated stress and uncertainty. This hesitation now defines the range, and resolving it will require a renewed wave of liquidity and demand to rebuild confidence.
Losses Rising
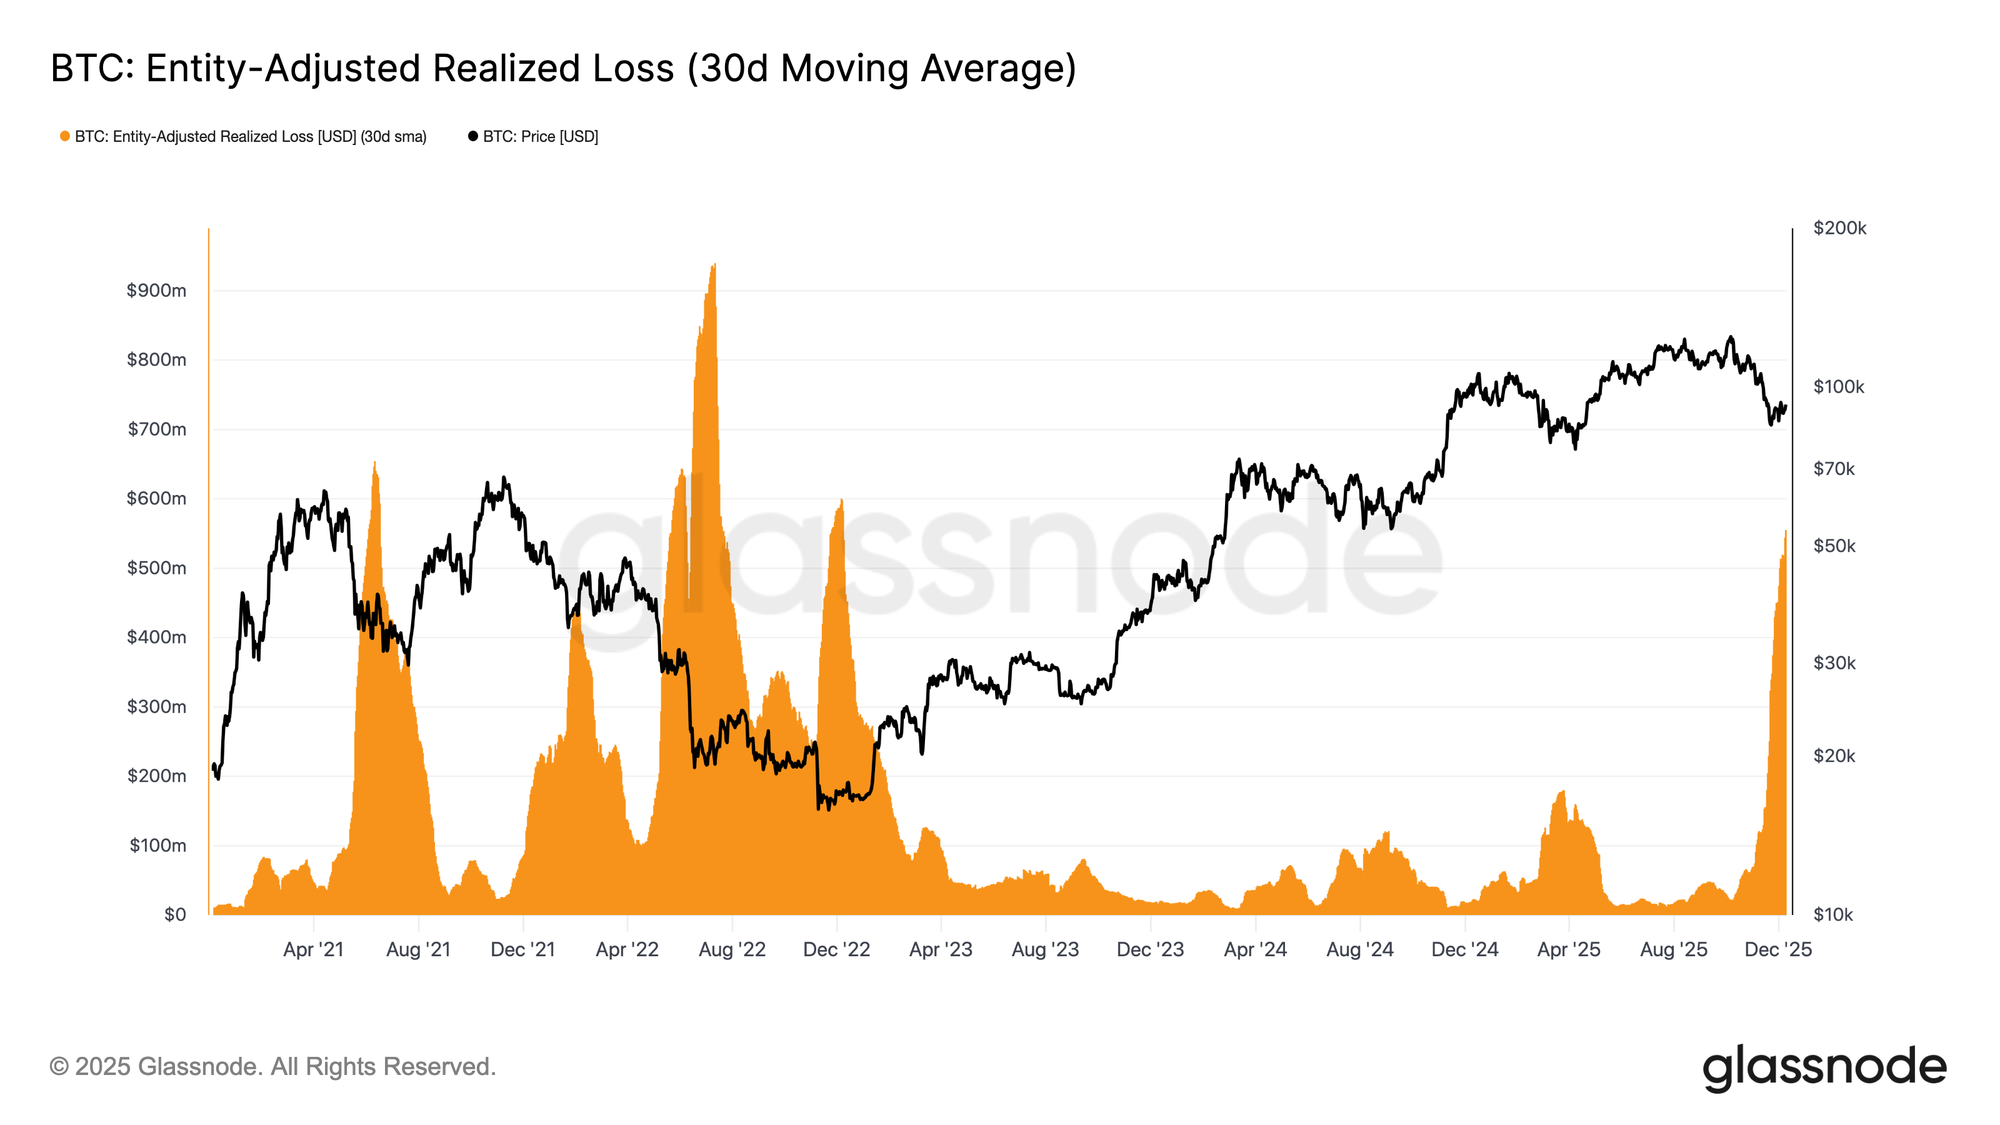
This time-driven pressure is further evident in spending behavior. Even as Bitcoin has rebounded from the November 22 low to roughly $92.7k, the 30D-SMA Entity-Adjusted Realized Loss has continued climbing, reaching $555 million per day, the highest level since the FTX collapse.
Such elevated loss realization during a moderate price recovery reflects mounting frustration among top buyers who are capitulating into strength rather than holding through the rebound.
Holding Back the Reversal
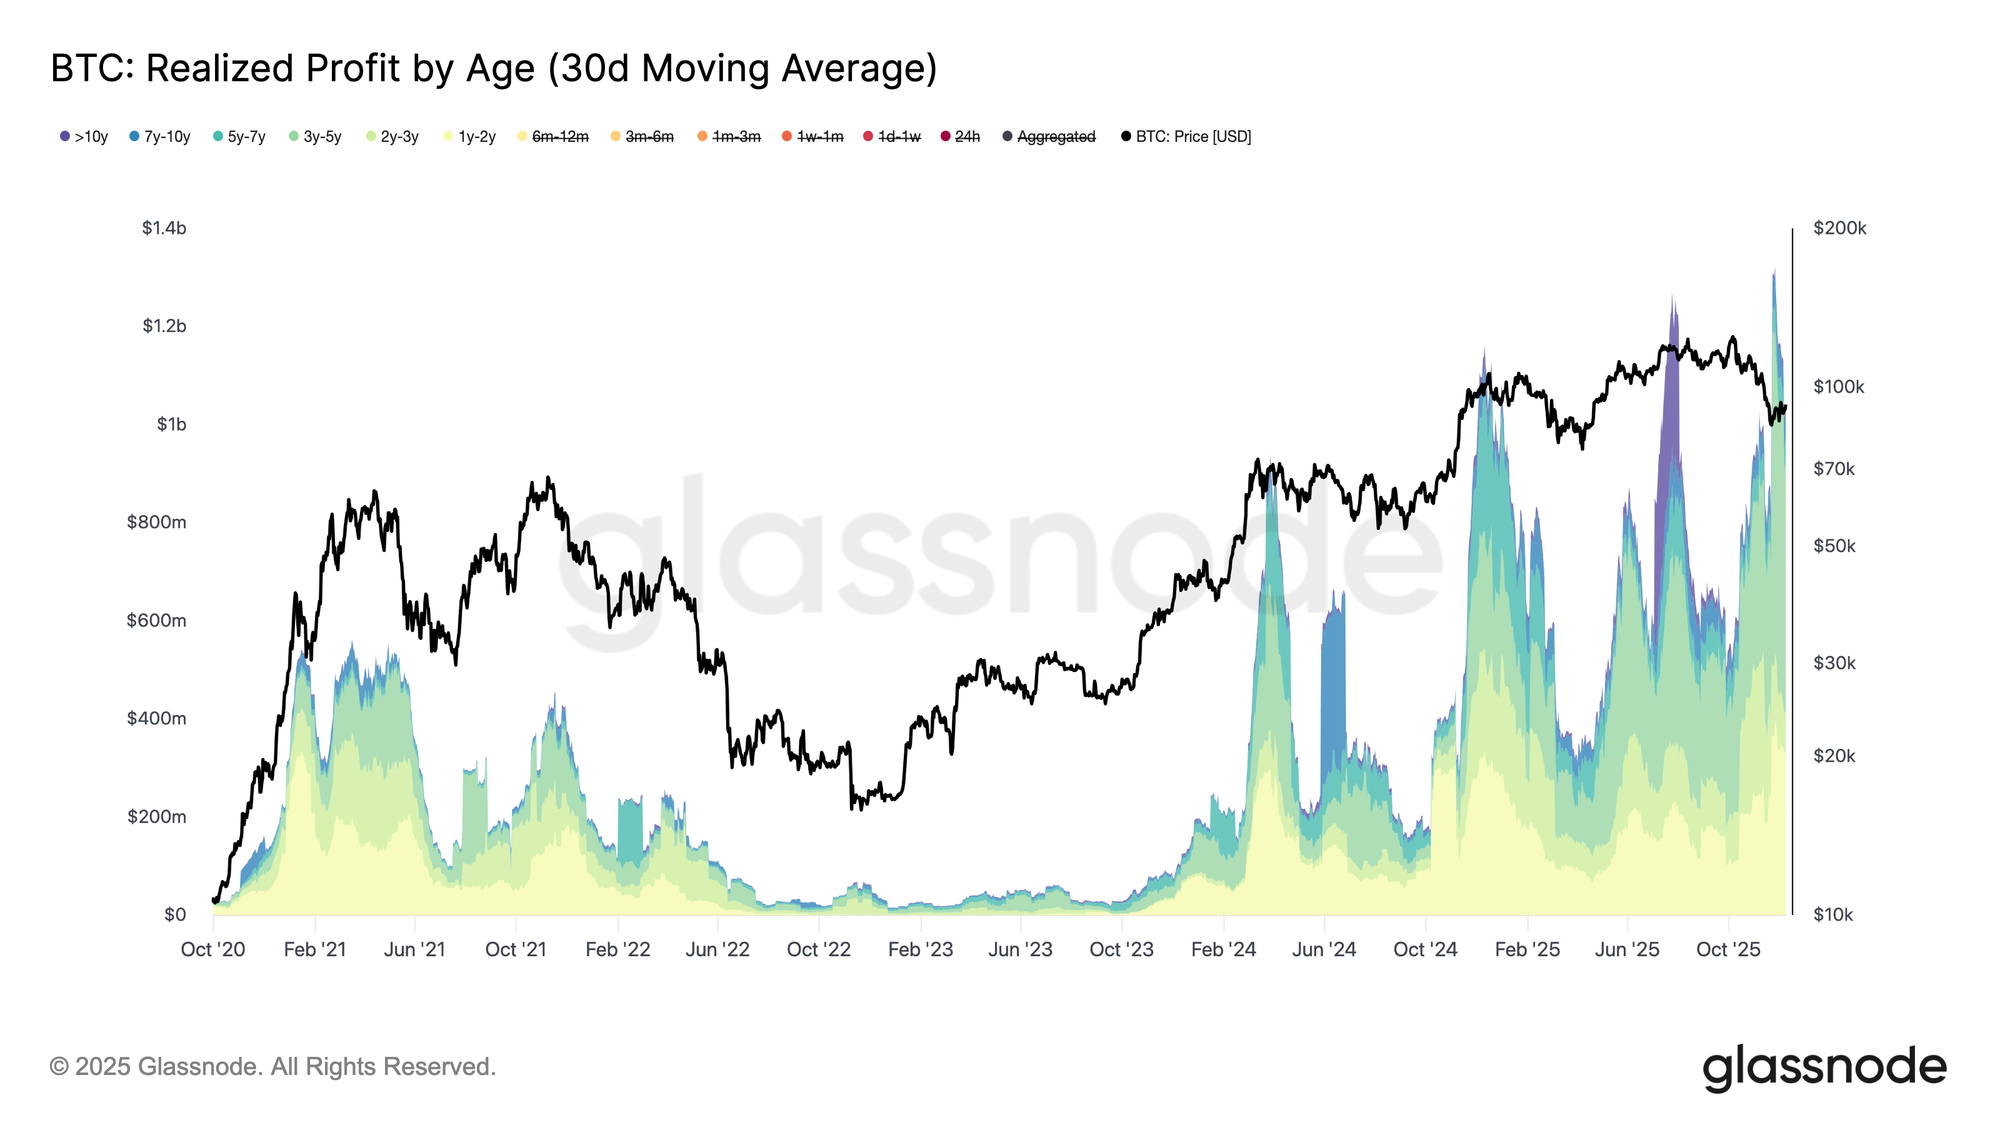
Rising realized losses are further anchoring the recovery, especially as they coincide with a surge in realized profit from seasoned investors. During the recent bounce, >1-year holders increased their realized profit (30D-SMA) above $1B per day, peaking at a new ATH of over $1.3B. Together, these two forces—time-driven capitulation by top buyers and heavy profit-taking by long-term holders ,explain why the market continues to struggle reclaiming the STH-Cost Basis.
Yet, despite this significant sell pressure, price has stabilized and even slightly recovered above the True Market Mean, signalling persistent and patient demand absorbing distribution. In the short term, if seller exhaustion begins to emerge, this underlying buy pressure could drive a retest of the 0.75 quantile (~$95k) and potentially the STH-Cost Basis.
Off-Chain Insights
ETF Woes
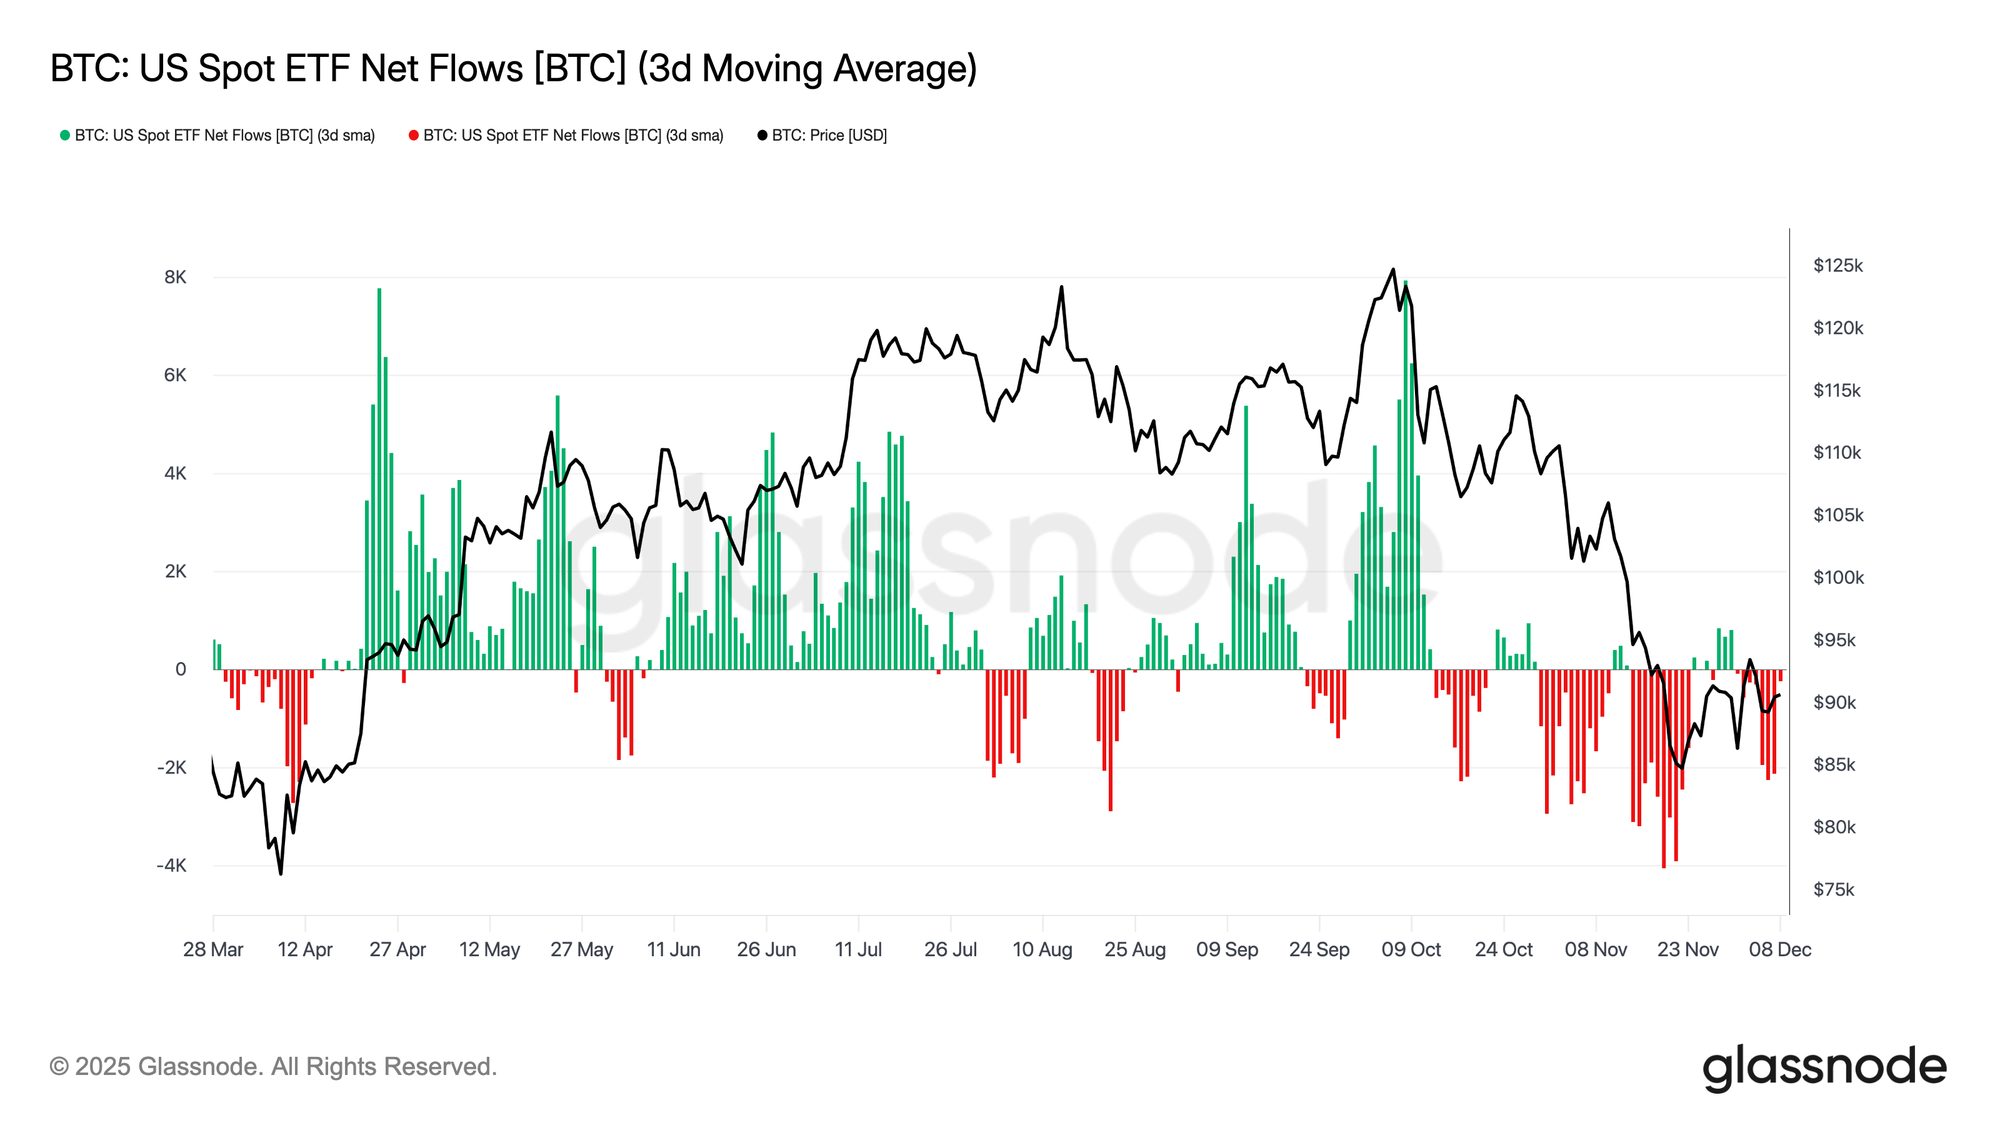
Turning to spot markets, US Bitcoin ETFs logged another quiet week, with the 3-day average of net flows remaining consistently below zero. This extends the cooling trend that began in late November and marks a clear departure from the robust inflow regime that supported price appreciation earlier in the year. Redemptions have been steady across several major issuers, underscoring a more risk-averse stance among institutional allocators as broader market conditions remain unsettled.
As a result, the spot market is operating with a thinner demand buffer, reducing immediate buy-side support and leaving price more vulnerable to macro catalysts and volatility shocks.
Liquidity Remains Subdued
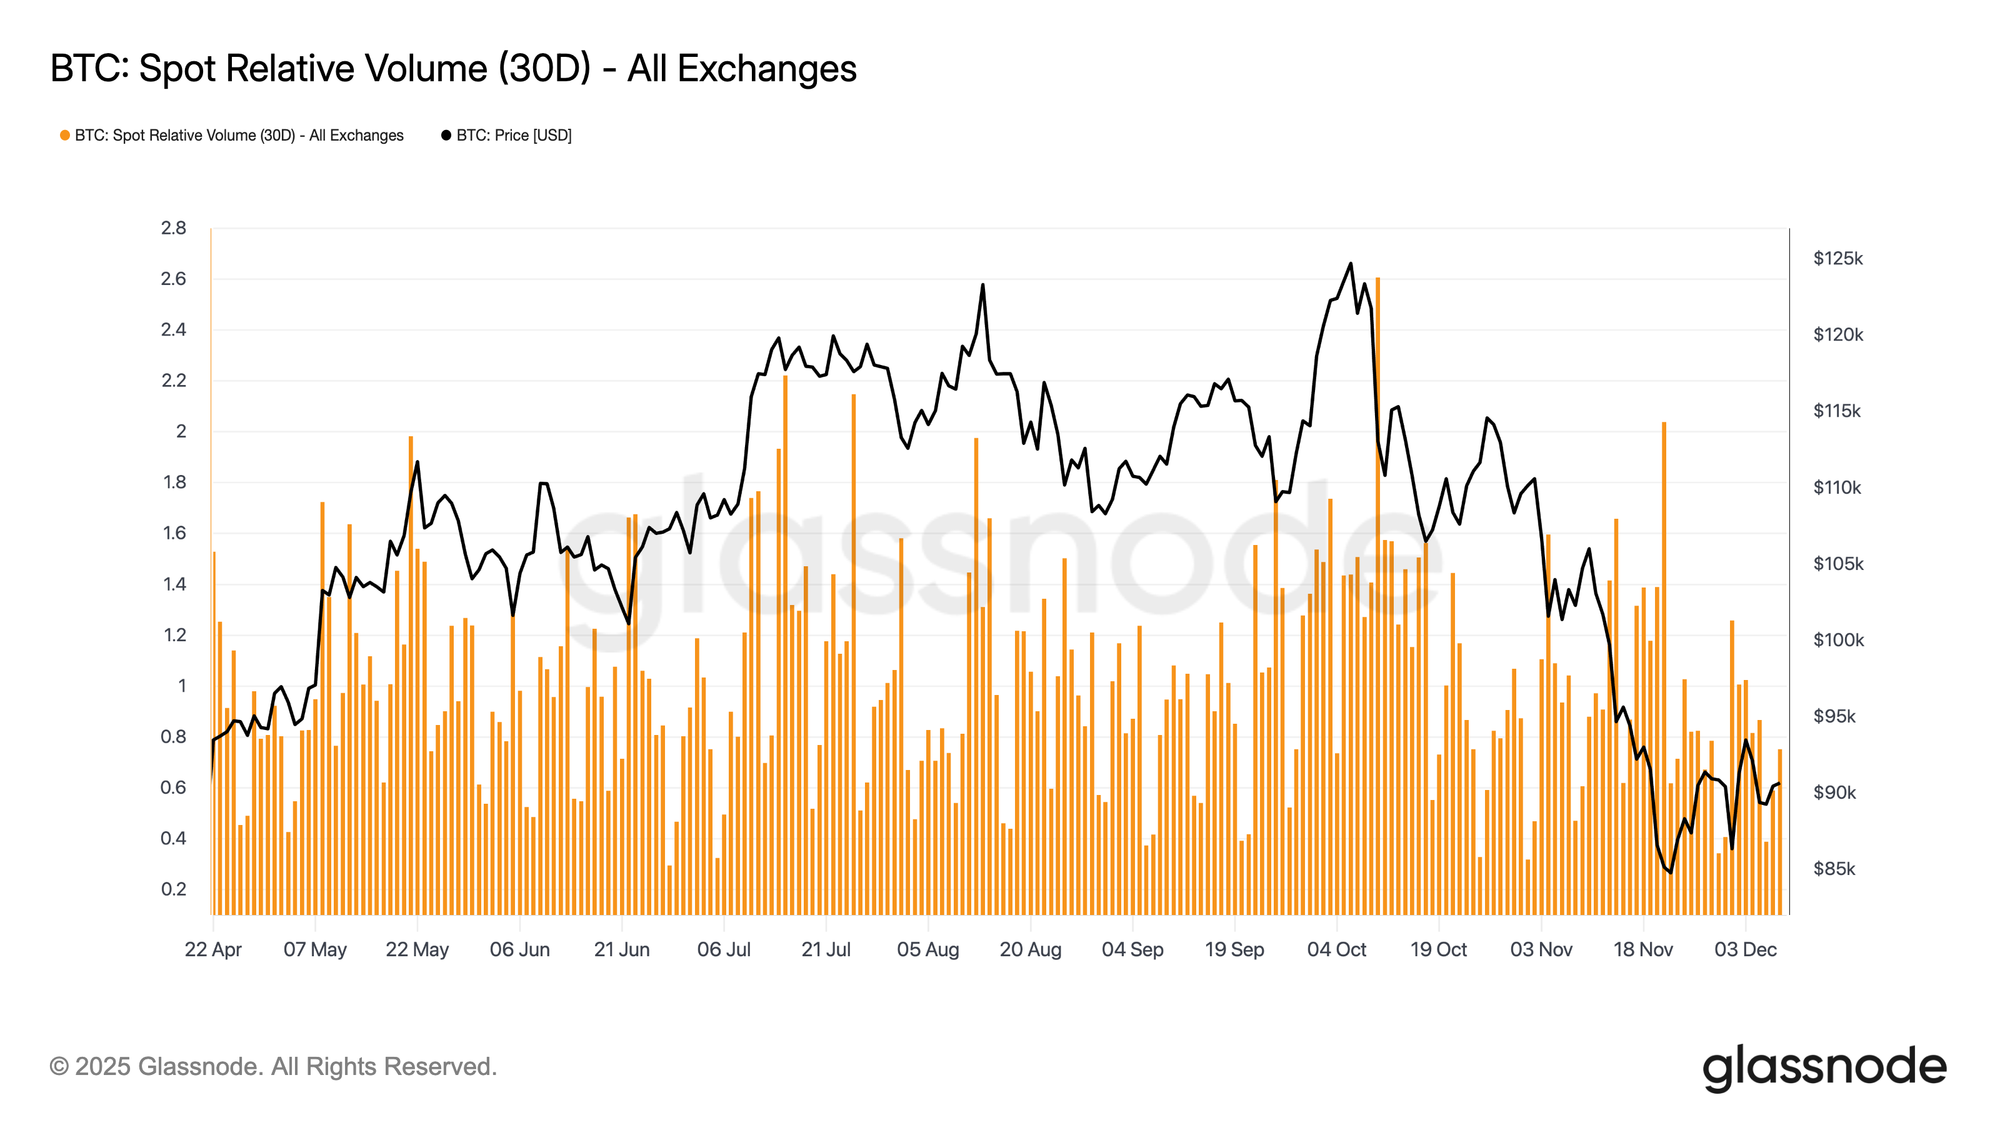
In parallel with softer ETF flows, Bitcoin’s spot relative volume continues to sit near the lower bound of its 30-day range. Trading activity has weakened through November and into December, mirroring the price decline and signalling a retreat in market participation. The contraction in volume reflects a more defensive positioning across the board, with fewer liquidity-driven flows available to absorb volatility or sustain directional moves.
With spot markets running quieter, attention now turns to the upcoming FOMC meeting, which could act as a catalyst for renewed participation depending on the policy tone.
Futures Ghost Town
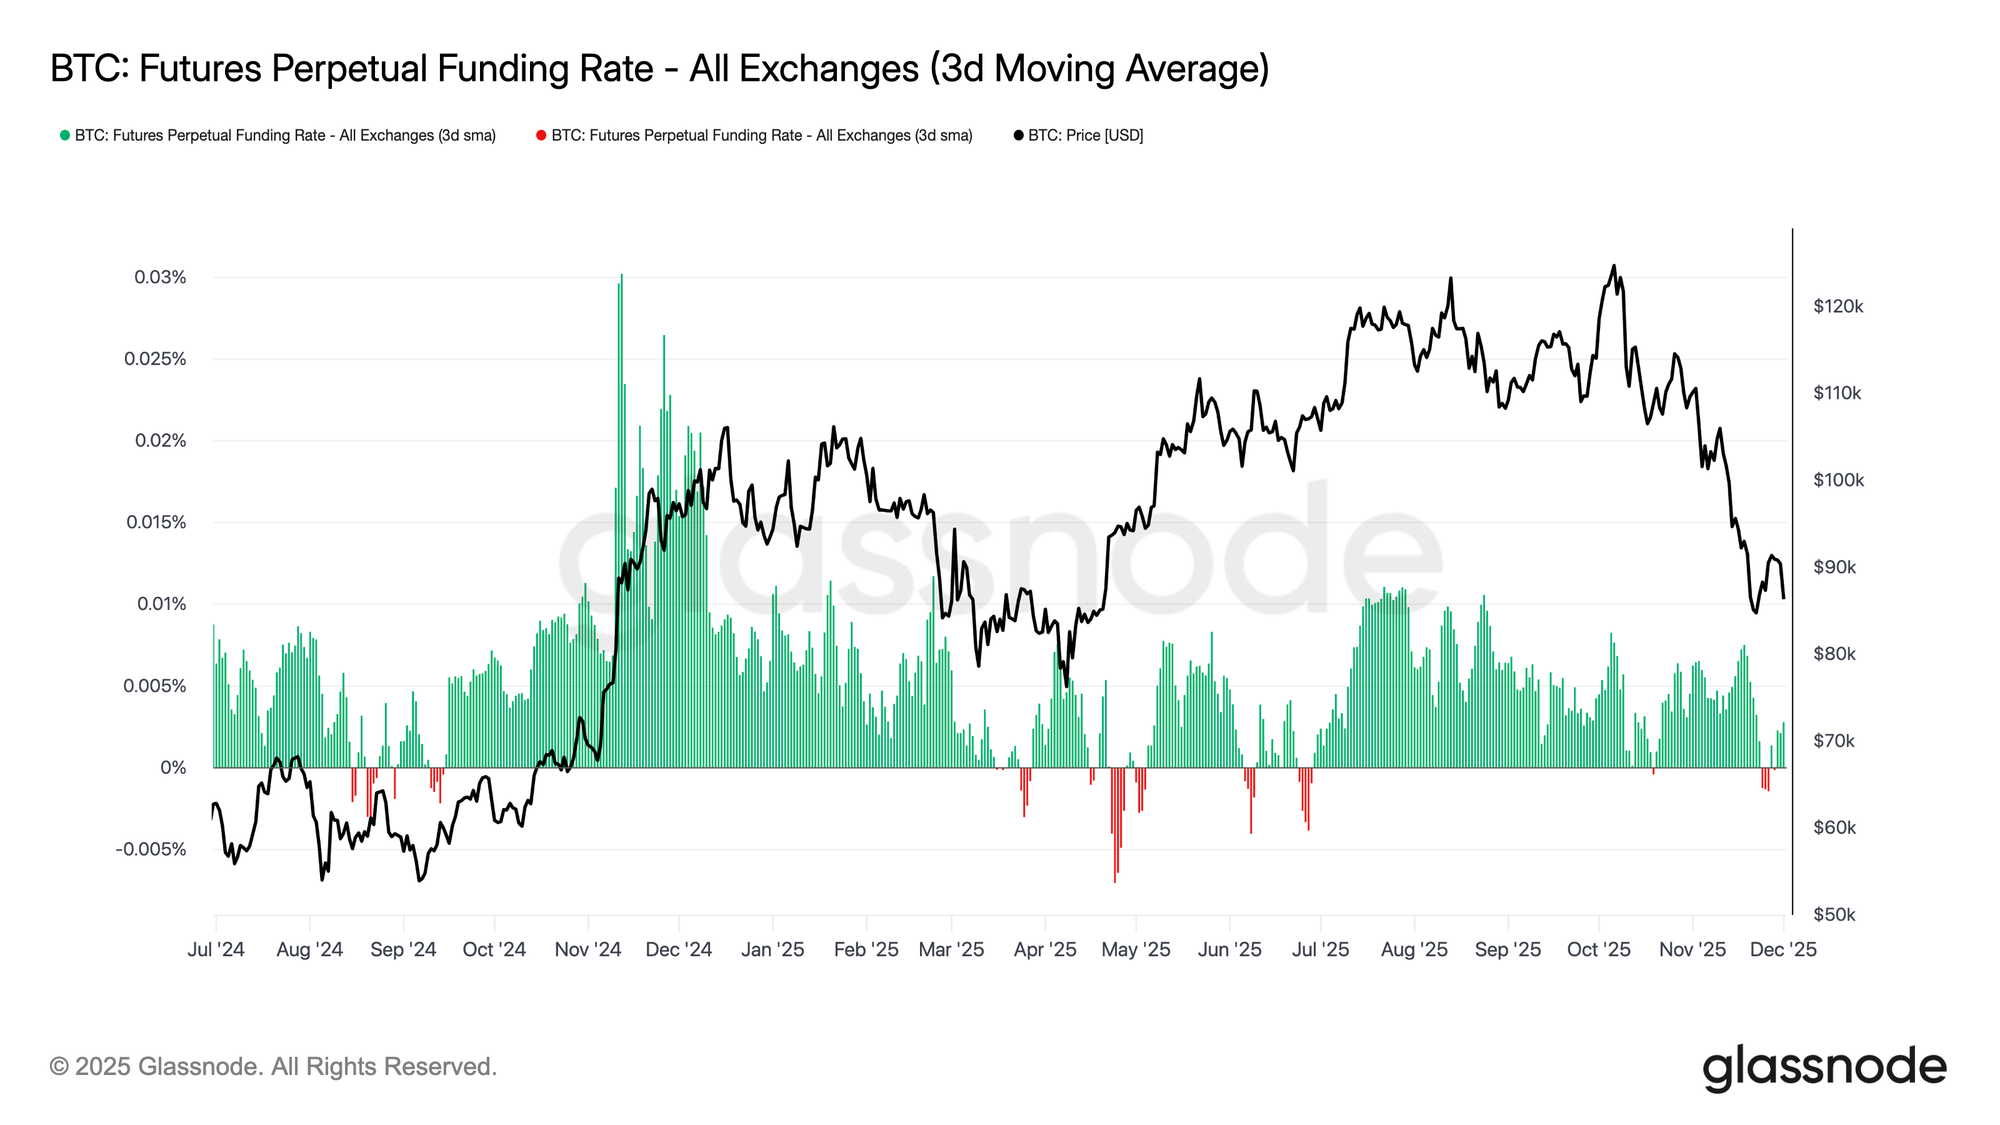
Extending this theme of muted participation, futures markets also show limited appetite for leverage, with Open Interest failing to meaningfully rebuild and funding rates pinned near neutral. These dynamics highlight a derivatives environment defined more by caution than conviction.
Across perpetual markets, funding hovered around zero to slightly negative during the week, underscoring the continued retreat in speculative long positioning. Traders remain balanced or defensive, contributing little directional pressure via leverage.
With derivatives activity subdued, price discovery tilts more heavily toward spot flows and macro catalysts rather than speculative expansion.
IV Pops at the Front End
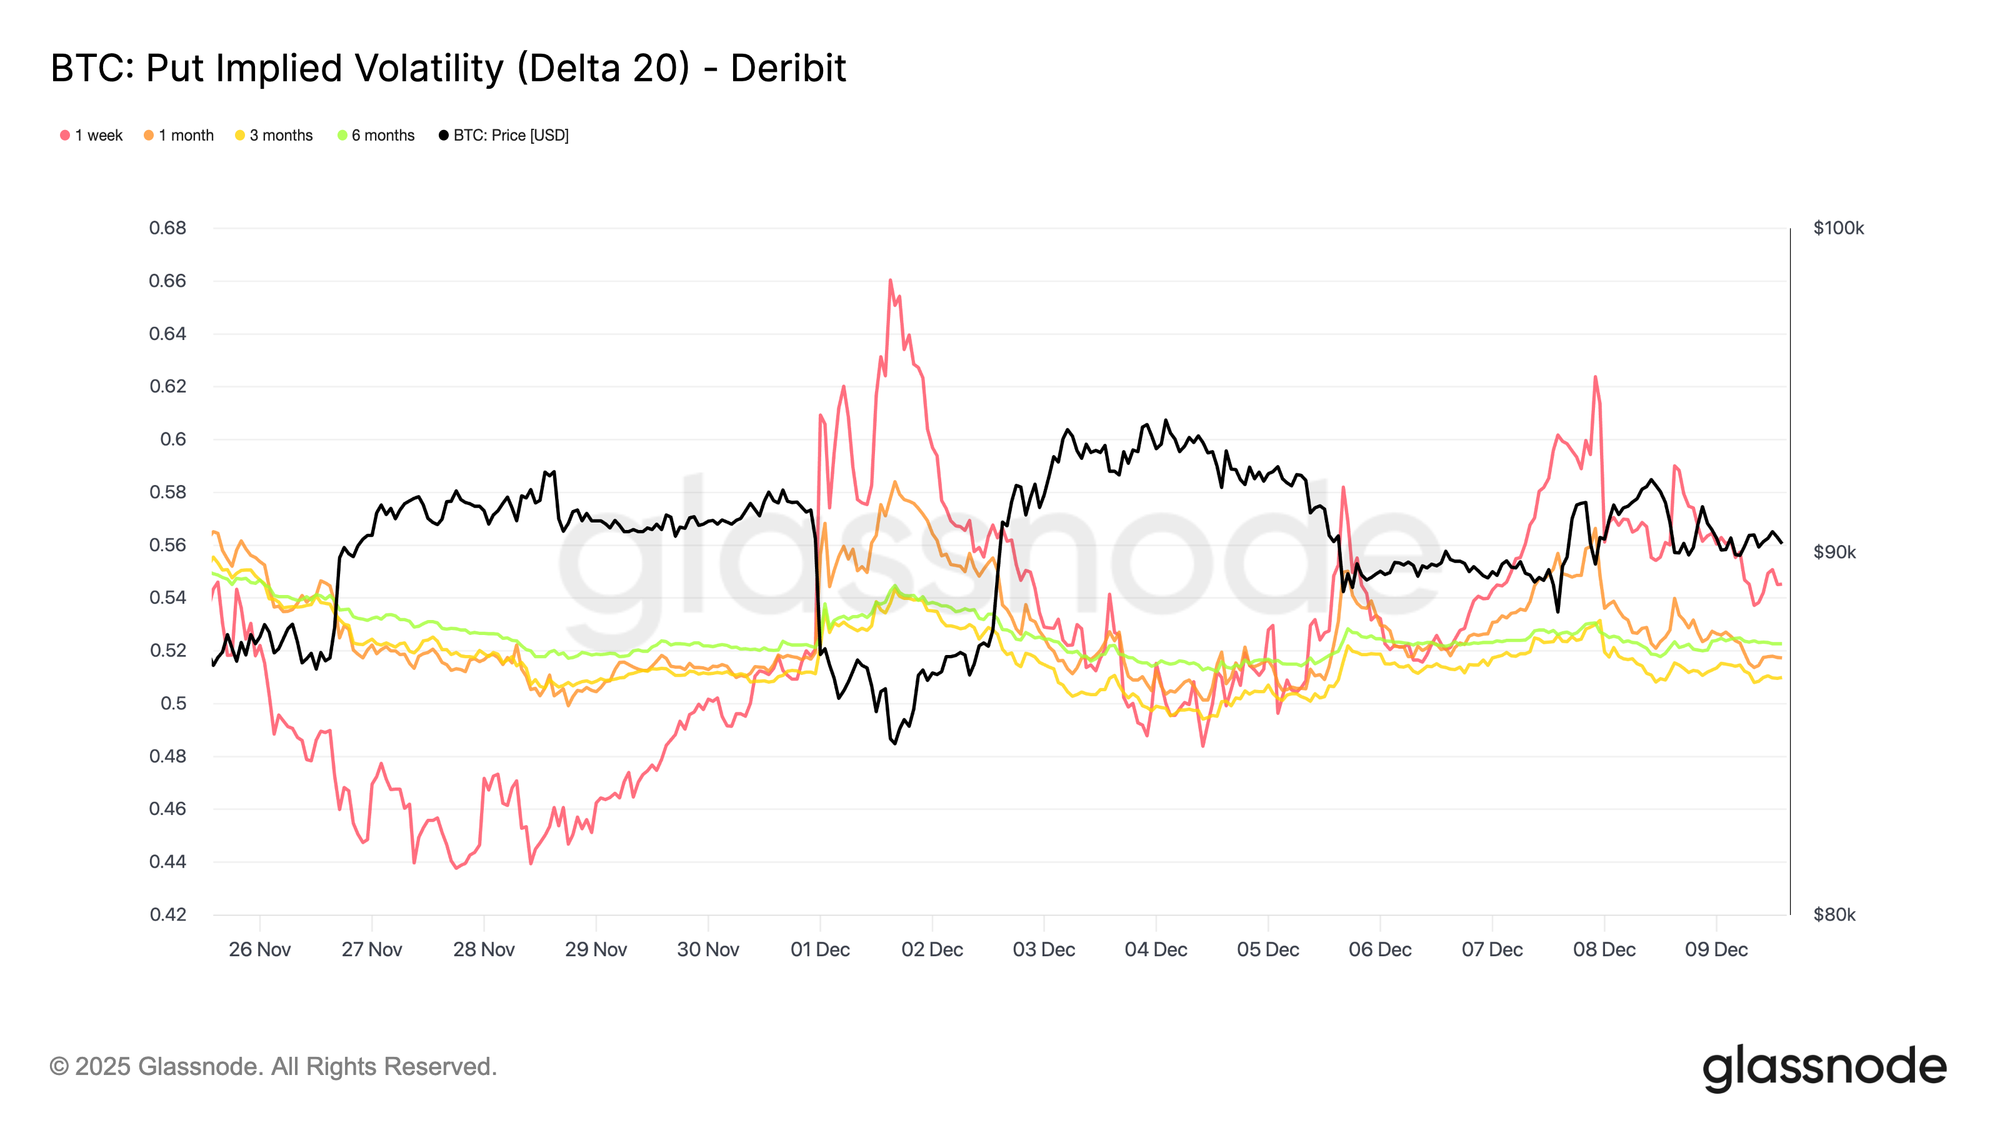
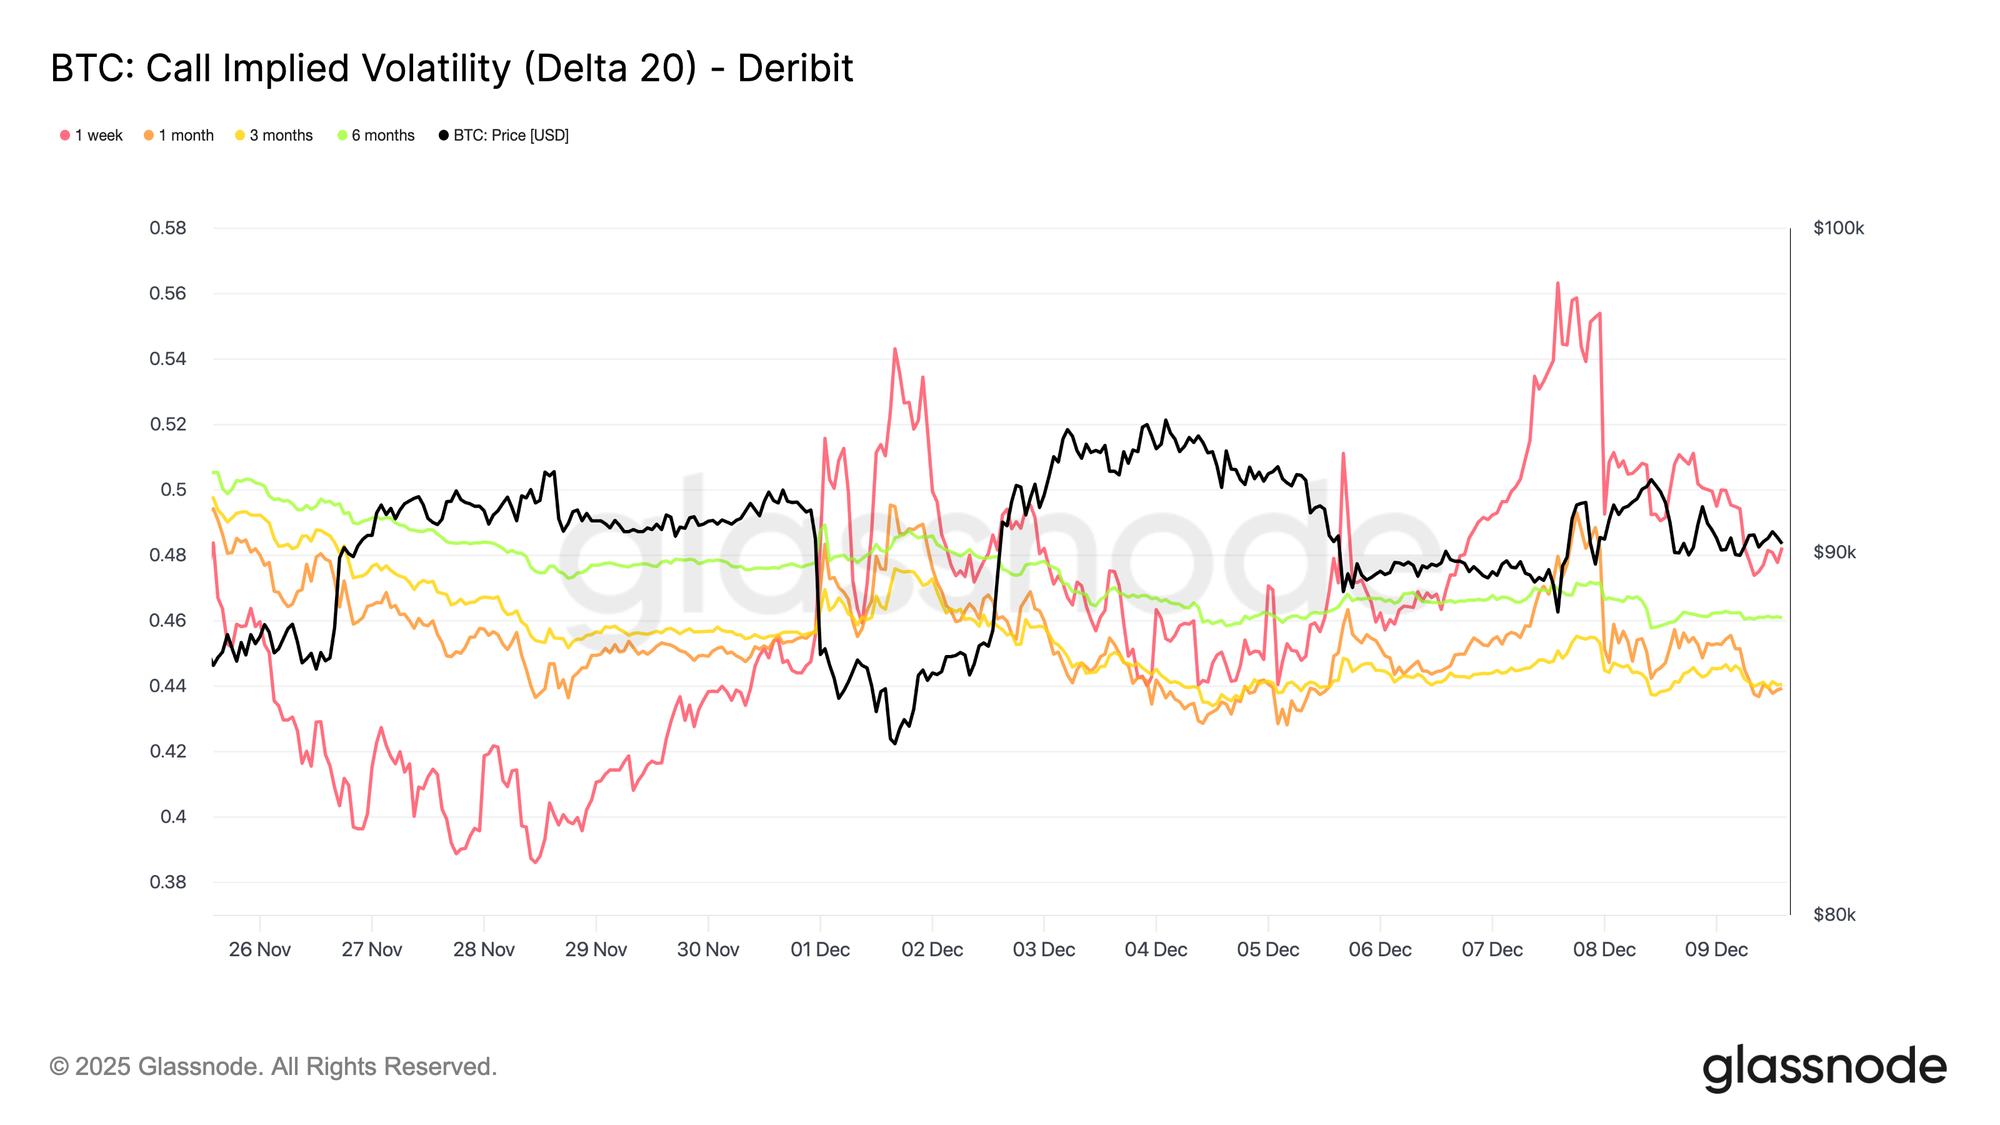
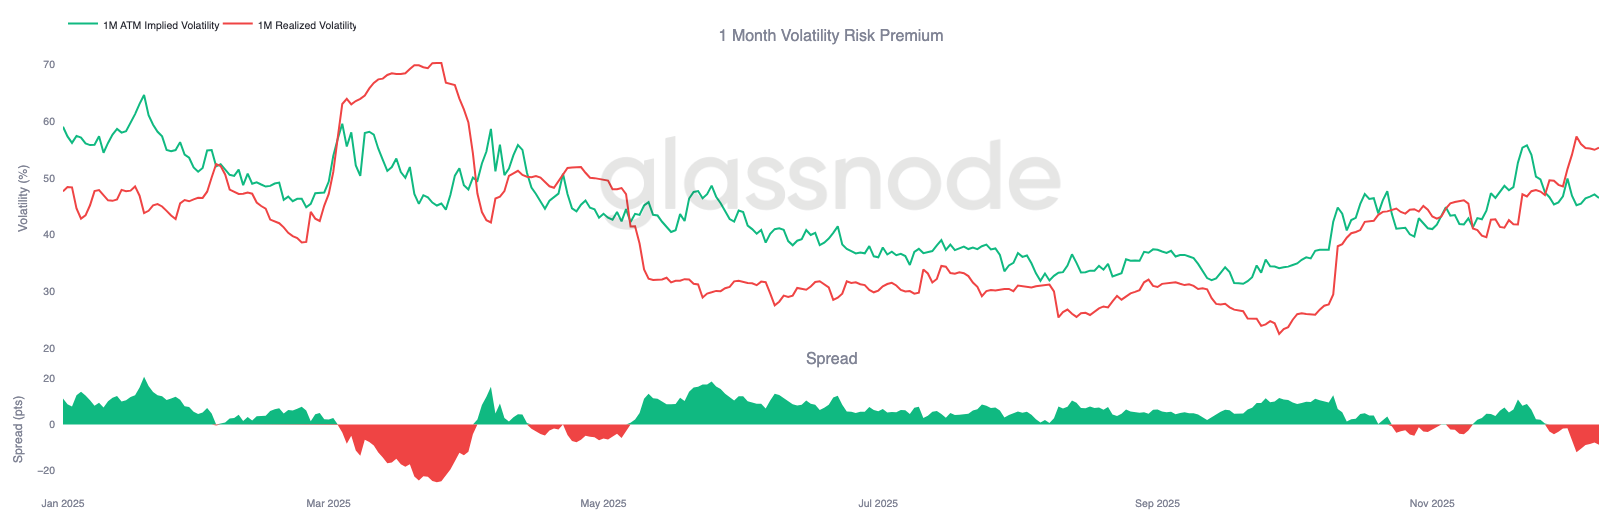
Turning to the options market, Bitcoin’s muted spot action contrasts sharply with a sudden rise in short-dated implied volatility, as traders position for a larger move. Interpolated Implied Volatility, which estimates IV at fixed deltas rather than relying on listed strikes, reveals a clearer structure of how risk is being priced across maturities.
On the 20-Delta CALL, the one-week tenor jumped by roughly ten vol points from last week, while longer maturities stayed relatively flat. The same pattern appears on the 20-Delta PUT, with short-dated downside IV lifting as longer expiries remain quiet.
Overall, traders are accumulating volatility precisely where they expect stress, preferring to own convexity rather than fade it ahead of the December 10 FOMC meeting.
Downside Demand Returns
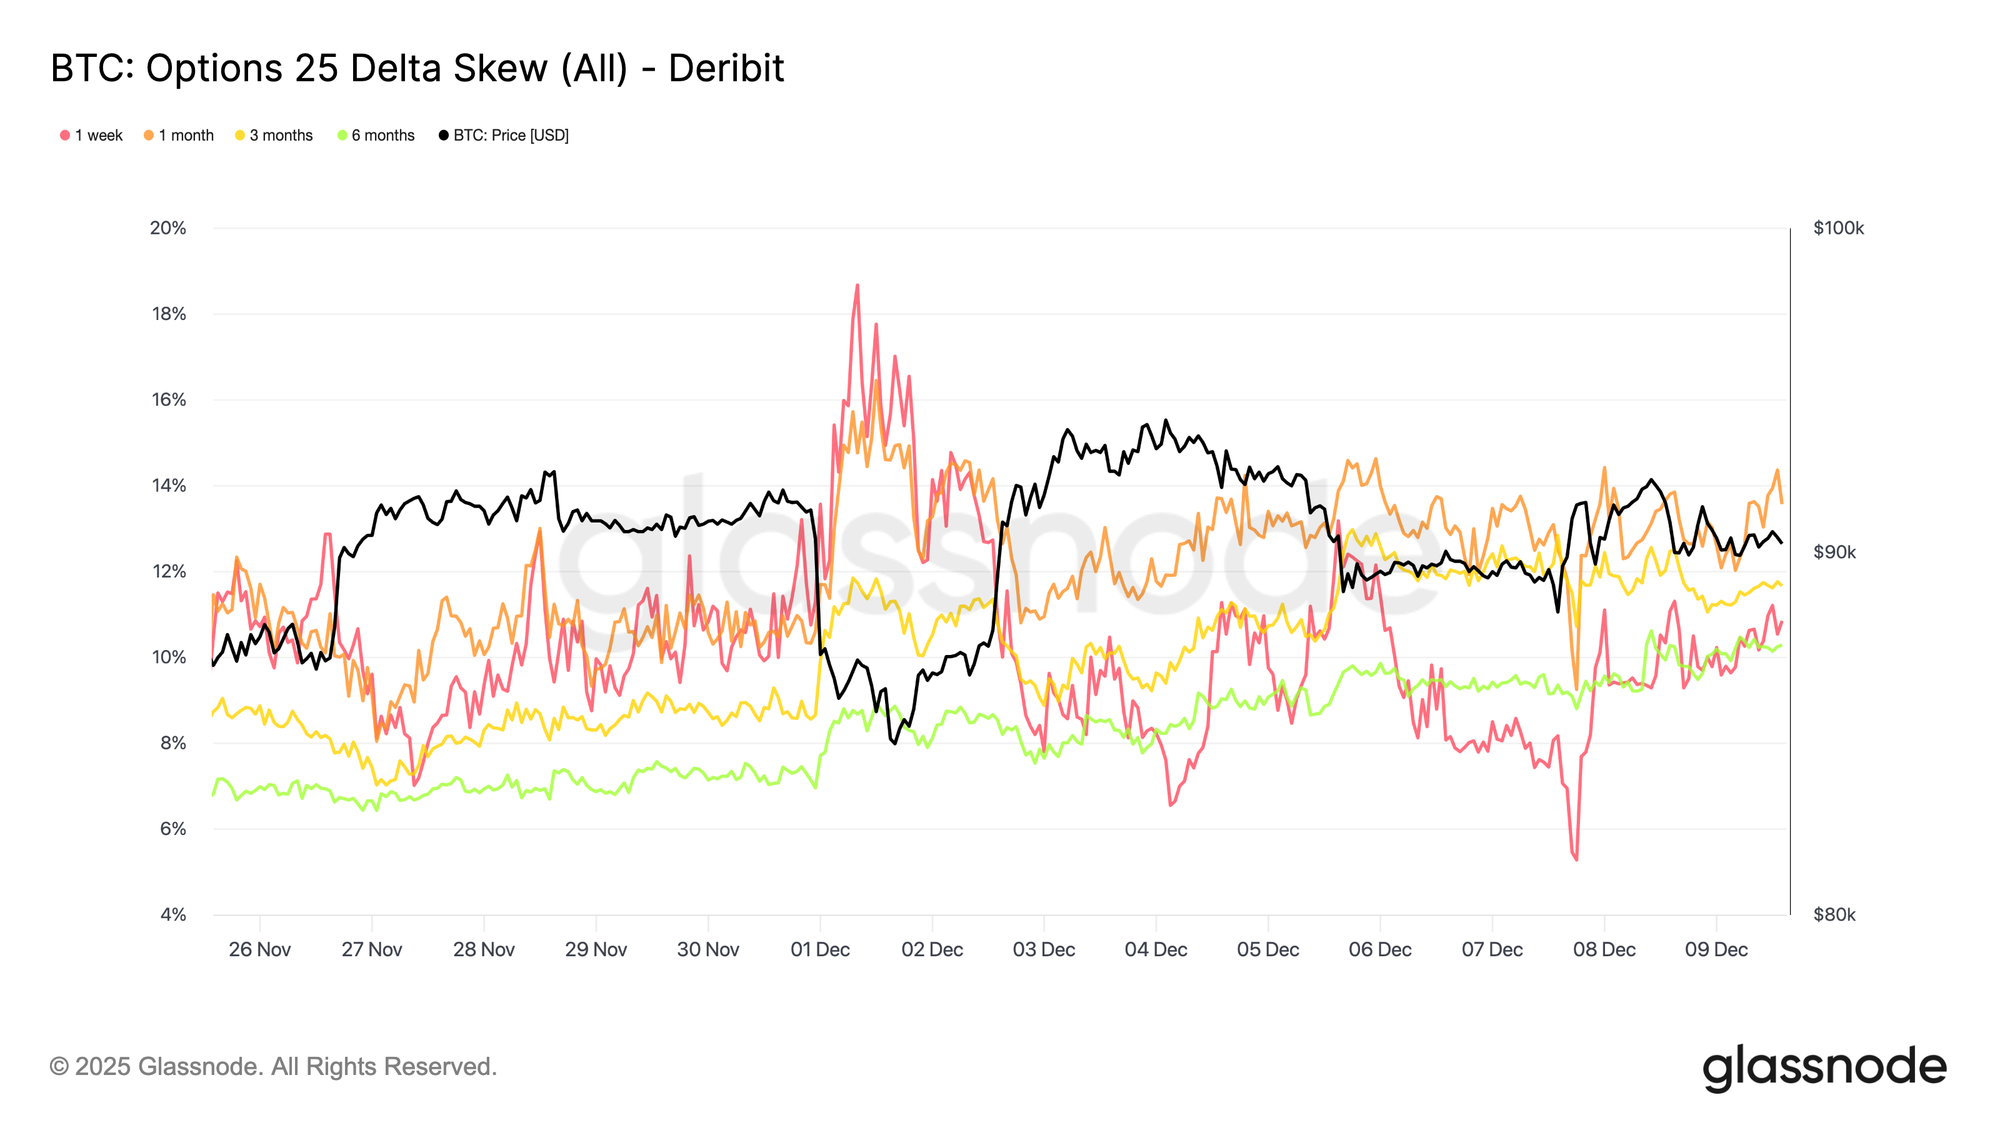
Complementing the rise in front-end volatility, downside protection is once again commanding a premium. The 25-delta skew, which measures the relative cost of puts versus calls at the same delta, has climbed to roughly 11 percent in the one-week tenor, indicating a clear pickup in demand for short-dated downside insurance ahead of the FOMC meeting.
Skew remains tightly clustered across maturities, ranging from 10.3 percent to 13.6 percent. This compression suggests that the preference for put protection is broad-based across the curve, reflecting a consistent hedging bias rather than isolated stress confined to the front end.
Skew Index Shows a Different Tone
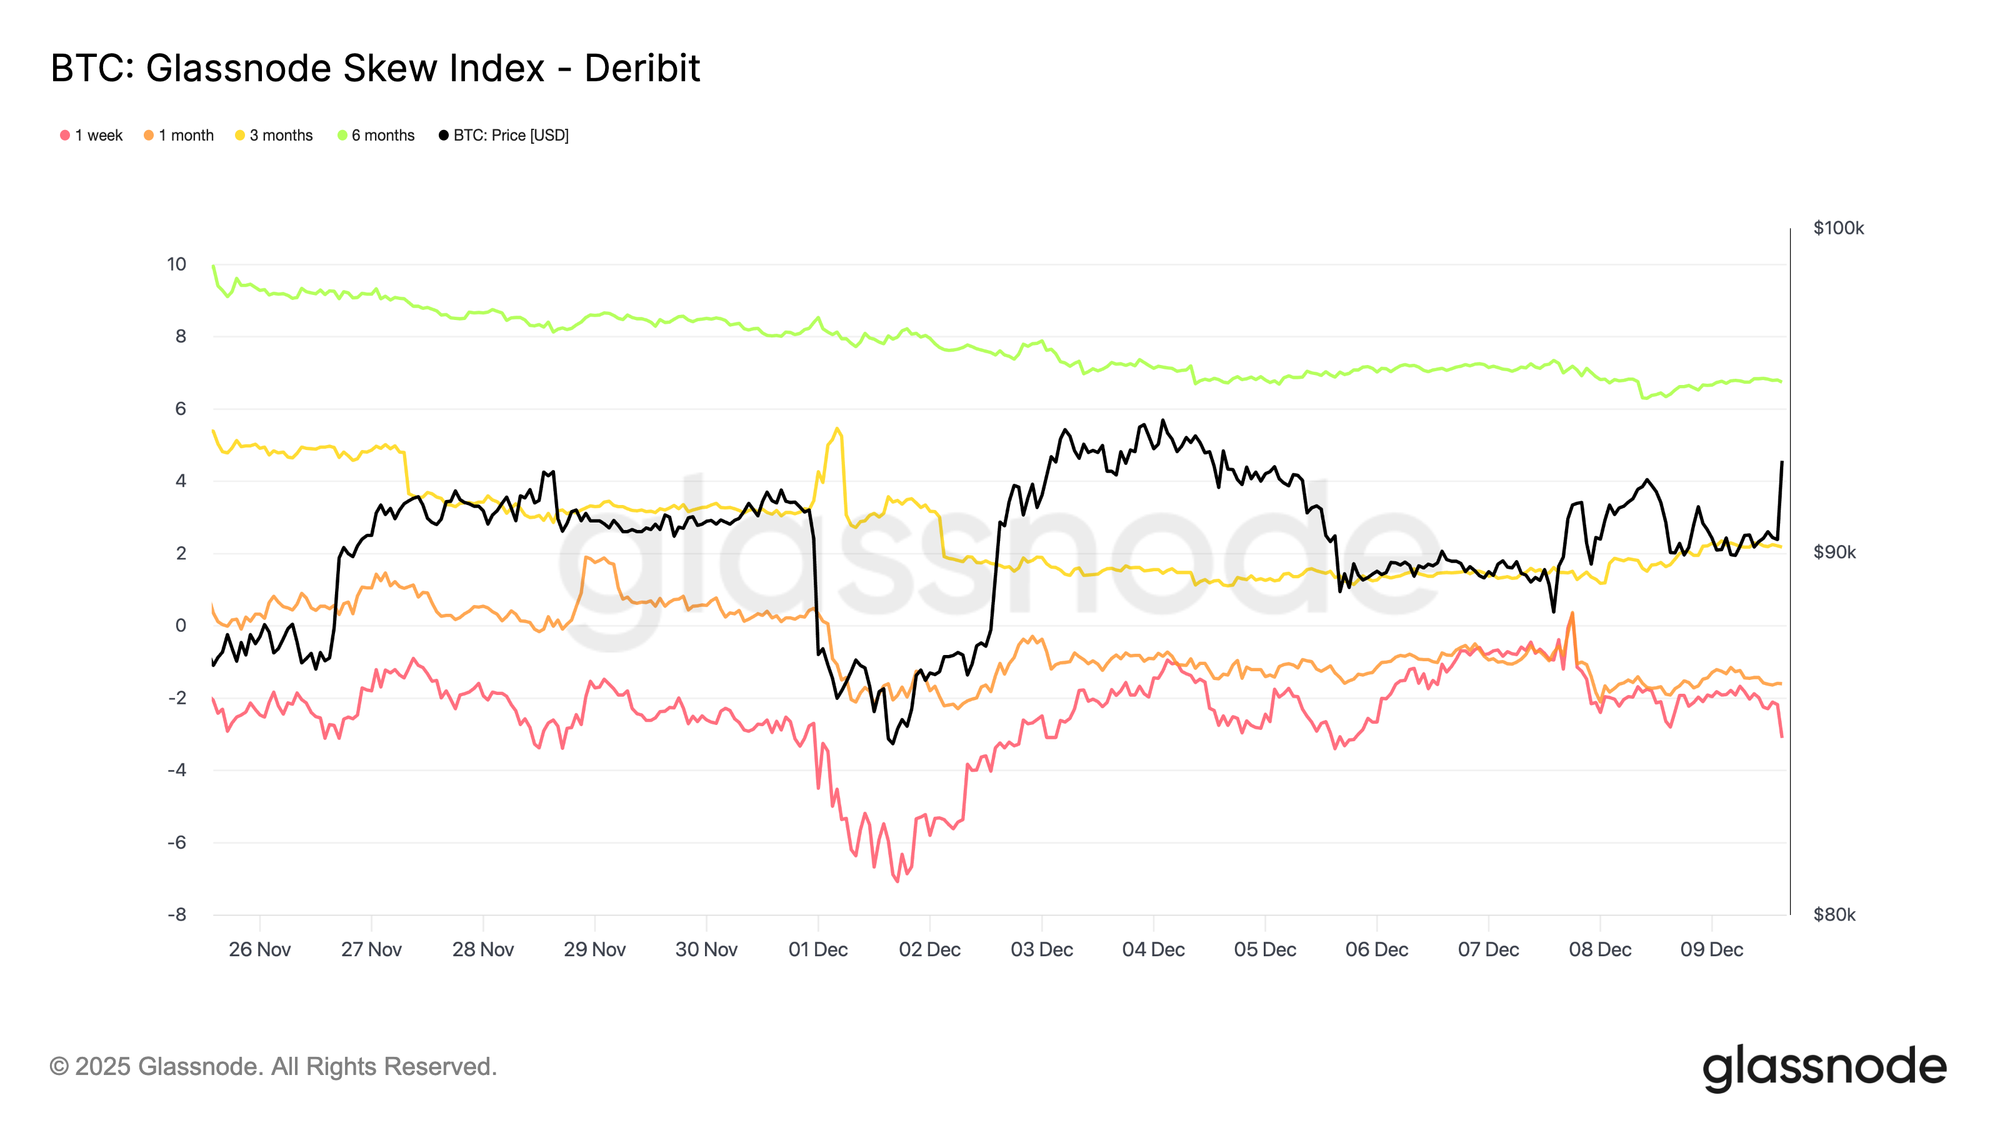
Adding another layer to the options picture, the skew index presents a more nuanced signal compared with the 25-delta skew. Because it is weighted toward low-delta options, it captures pricing across the full downside wing. The one-week and one-month readings sit in put territory, yet the three-month and six-month values, around 2.2 percent and 6.7 percent, fall into call territory, since the index is calculated as calls minus puts.
This creates a notable divergence: the 25-delta skew leans bearish across maturities, while the longer-dated skew index shows upside variance being priced more richly than downside. In essence, traders are not bidding deep OTM downside protection in the longer tenors, even though mid-delta puts remain supported. The surface therefore signals short-term caution, but a more balanced to mildly bullish tone further out the curve, a pattern typical in crypto where participants often hold far-OTM calls for asymmetric upside.
Volatility Accumulation
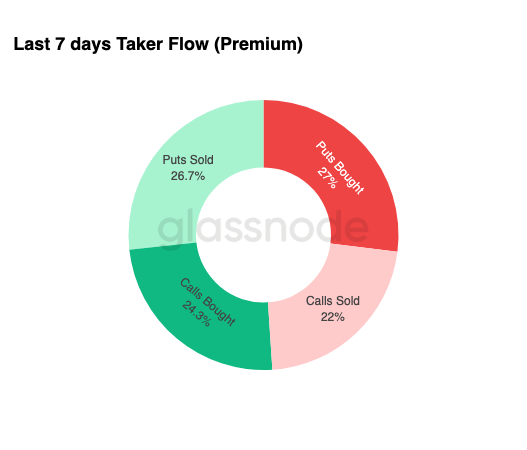
Rounding out the options landscape, weekly flow data reinforces a clear pattern: traders are buying volatility, not selling it. Premiums bought dominate total notional flow, with a slight lead from puts. This does not reflect a directional bias, but rather a regime of volatility accumulation. When traders purchase both wings, it signals hedging and convexity-seeking behaviour rather than sentiment-driven speculation.
Combined with rising implied volatility and a downside-leaning skew, the flow profile suggests that market participants are preparing for a volatility event with a bias toward the downside.
After FOMC
Looking ahead, implied volatility has already begun to ease, and historically, IV tends to compress further once the final major macro event of the year passes. With the December 10 FOMC meeting serving as the last meaningful catalyst, the market is preparing for a transition into a low-liquidity, mean-reverting environment.
After the announcement, gamma sellers typically re-enter, accelerating IV decay into year-end. Absent a hawkish surprise or a notable shift in guidance, the path of least resistance points toward lower implied volatility and a flatter surface through late December.
Conclusion
Bitcoin continues to trade within a structurally fragile environment where rising unrealized losses, elevated realized loss realization, and heavy profit-taking from long-term holders collectively anchor price action. Despite this persistent sell pressure, demand remains sufficiently resilient to keep price above the True Market Mean, suggesting patient buyers are still absorbing distribution. A short-term push toward the 0.75 quantile or even the STH Cost Basis remains possible if seller exhaustion begins to surface.
Off-chain conditions echo this cautious tone. ETF flows remain negative, spot liquidity is subdued, and futures markets lack speculative engagement. Options markets reinforce a defensive posture, with traders accumulating volatility, bidding short-dated downside protection, and positioning for a near-term volatility event ahead of the FOMC meeting.
Taken together, market structure suggests a weak but stable range, held up by patient demand yet constrained by persistent sell pressure. The short-term path hinges on whether liquidity improves and sellers relent, while the longer-term outlook depends on the market’s ability to reclaim key cost-basis thresholds and shift out of this time-driven, psychologically taxing phase.