The Ethereum price has finally been able to break above the $1,233 resistance mark. Over the last 24 hours, the coin has registered substantial gains. With the price moving above the $1,233 resistance level, Ethereum price has pictured a positive short-term bullish thesis on its one-day chart.
Technical outlook also agreed with the same and depicted a rise in demand for the king altcoin. Buyers will need to stick around for longer than the next couple of trading sessions for ETH to reach above the $1,300 price mark.
The price of ETH must remain above $1,200 and $1,230, or else the bears will return. This would mean Ethereum could drop to a psychological floor of $1,000. The altcoin has logged considerable gains over the past week’s duration, surging more than 11%. ETH’s chart depicts accumulation, which is good for short-term bullish momentum.
Ethereum Price Analysis: One-Day Chart
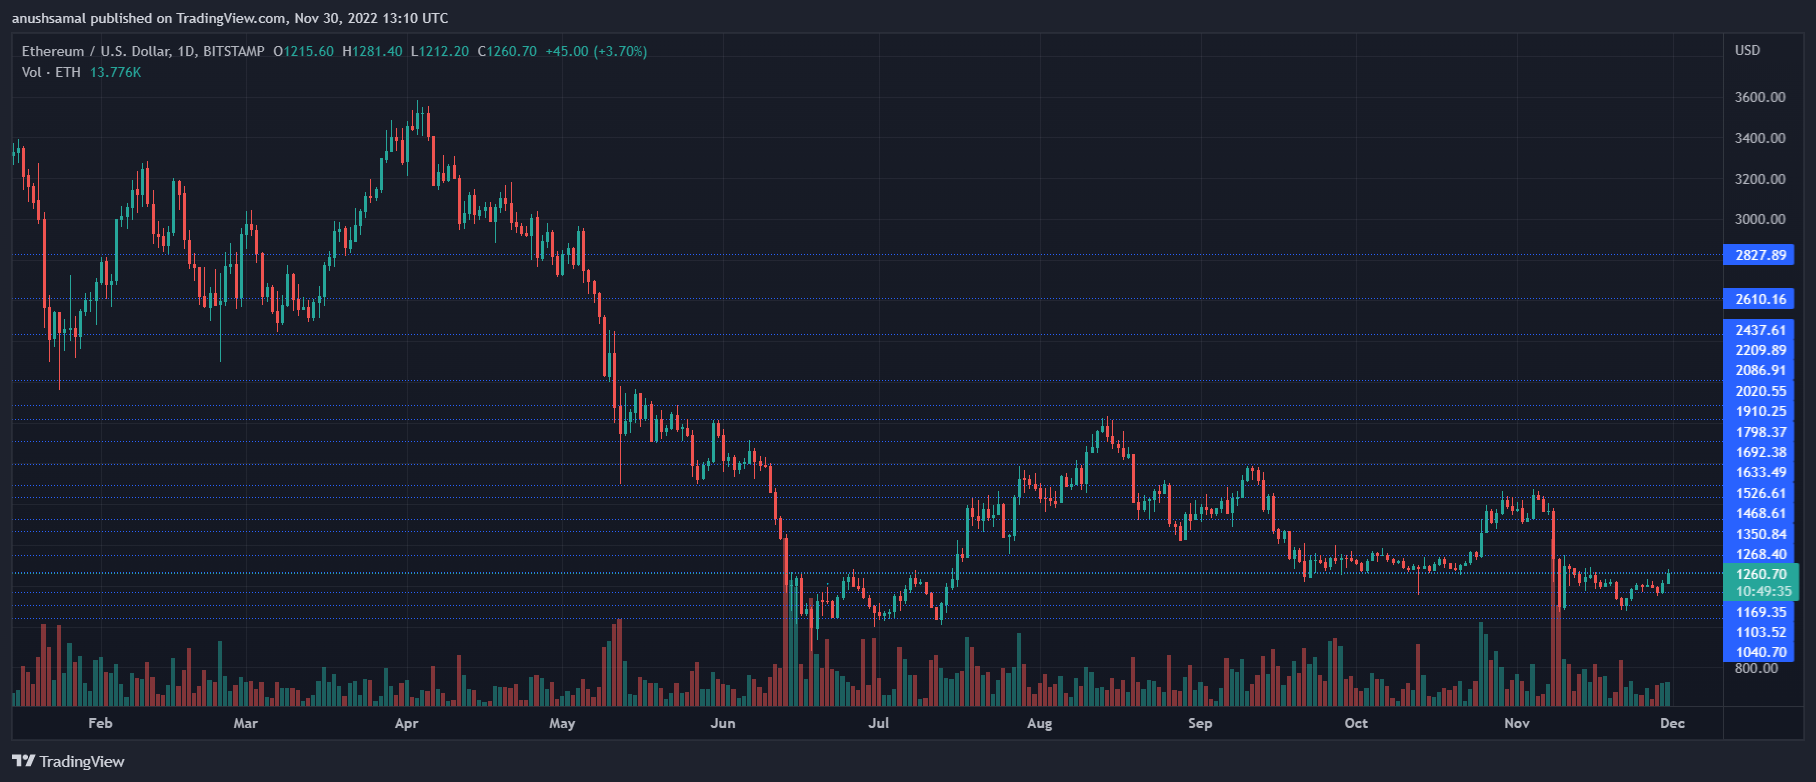
ETH was exchanging hands at $1,260 at press time. The next area of resistance for the altcoin stood at $1,280. It is, however, too early to determine if the altcoin has stabilized over the $1,230 price mark. It needs to trade above the $1,260 zone for the next trading sessions for the bulls to strengthen further.
In case of this, the other price ceiling crucial for ETH’s upward movement was $1,350. On the other hand, a fall from the current price zone will take the price to $1,200 and then straight to $1,000. The amount of Ethereum traded in the last session increased, which showed bullishness.
Technical Analysis
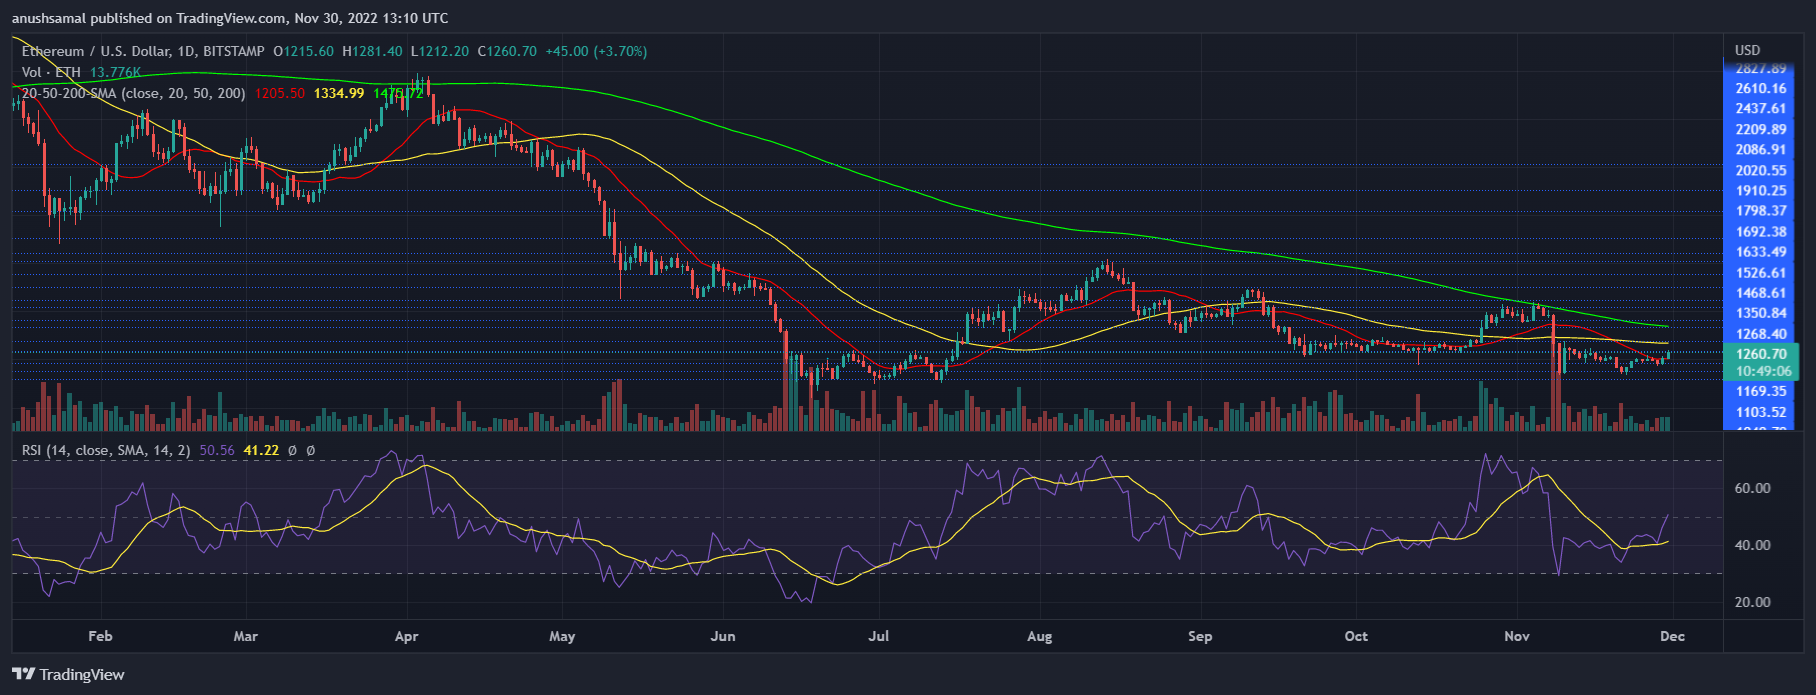
ETH had nosedived into the selling zone at the beginning of this month; however, the altcoin has finally moved closer to the positive buying zone. The Relative Strength Index shot up to the neutral zone after remaining in the selling zone most of the month.
This indicated that demand for the altcoin had returned to the market. A continued push from buyers will drag the indicator past the 50-mark, depicting more buyers than sellers. In relation to that, the Ethereum price moved above the 20-Simple Moving Average line, which meant that buyers were driving the price momentum in the market.
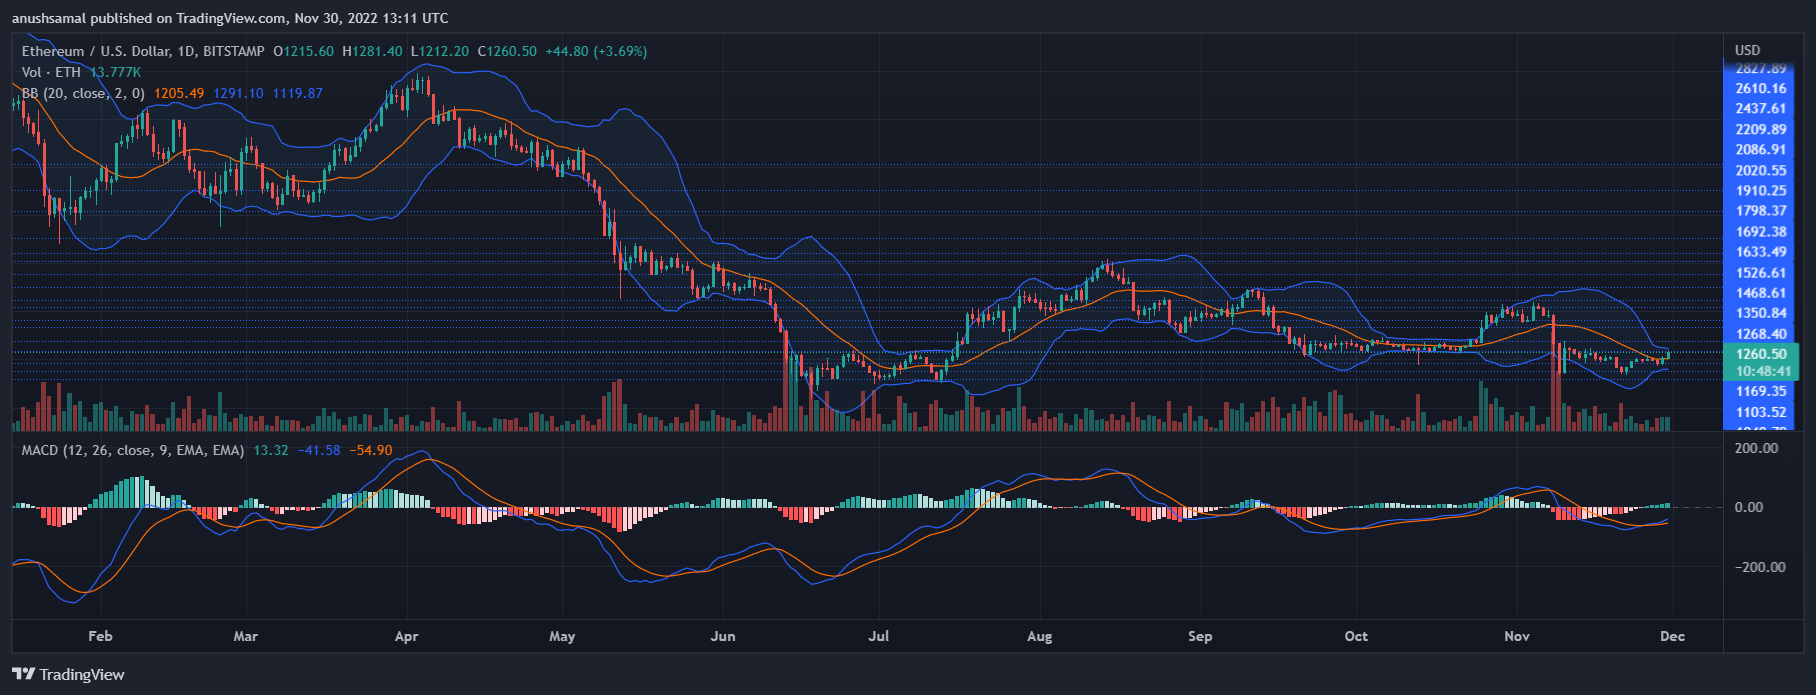
In correspondence to other indicators, the altcoin depicted a buy signal on the one-day chart. The Moving Average Convergence Divergence (MACD) indicates price momentum and trend reversal.
MACD formed green signal bars above the half-line, indicating that if buyers acted on them, ETH would give returns. Bollinger bands depict price volatility and fluctuation; the bands were narrow, indicating price stability for Ethereum.