On-chain data shows the Bitcoin NVT golden cross has now entered into the “sell” zone, something that could be bearish for the price of the crypto.
Bitcoin NVT Golden Cross Surges, Now Has A Value Of 2.44
As pointed out by an analyst in a CryptoQuant post, this sell signal might lead to BTC’s price dropping in the next ten days.
The “Network Value to Transactions ratio” (NVT ratio) is an indicator that’s defined as the market cap divided by the transacted volume in a specific period.
What this metric tells us is how the value of Bitcoin currently compares with the investors’ ability to transact coins, and thus if the crypto is undervalued or overvalued right now.
One application of this ratio is through the NVT golden cross, which compares the short-term (10-day moving average) and the long-term (30-day moving average) trends in NVT to indicate tops and bottoms in the crypto’s price.
Historically, the metric’s value being higher than 2.2 has usually been a signal to sell, while it being less than -1.6 has been a bullish sign.
Now, here is a chart that shows the trend in the Bitcoin NVT golden cross over the last year:
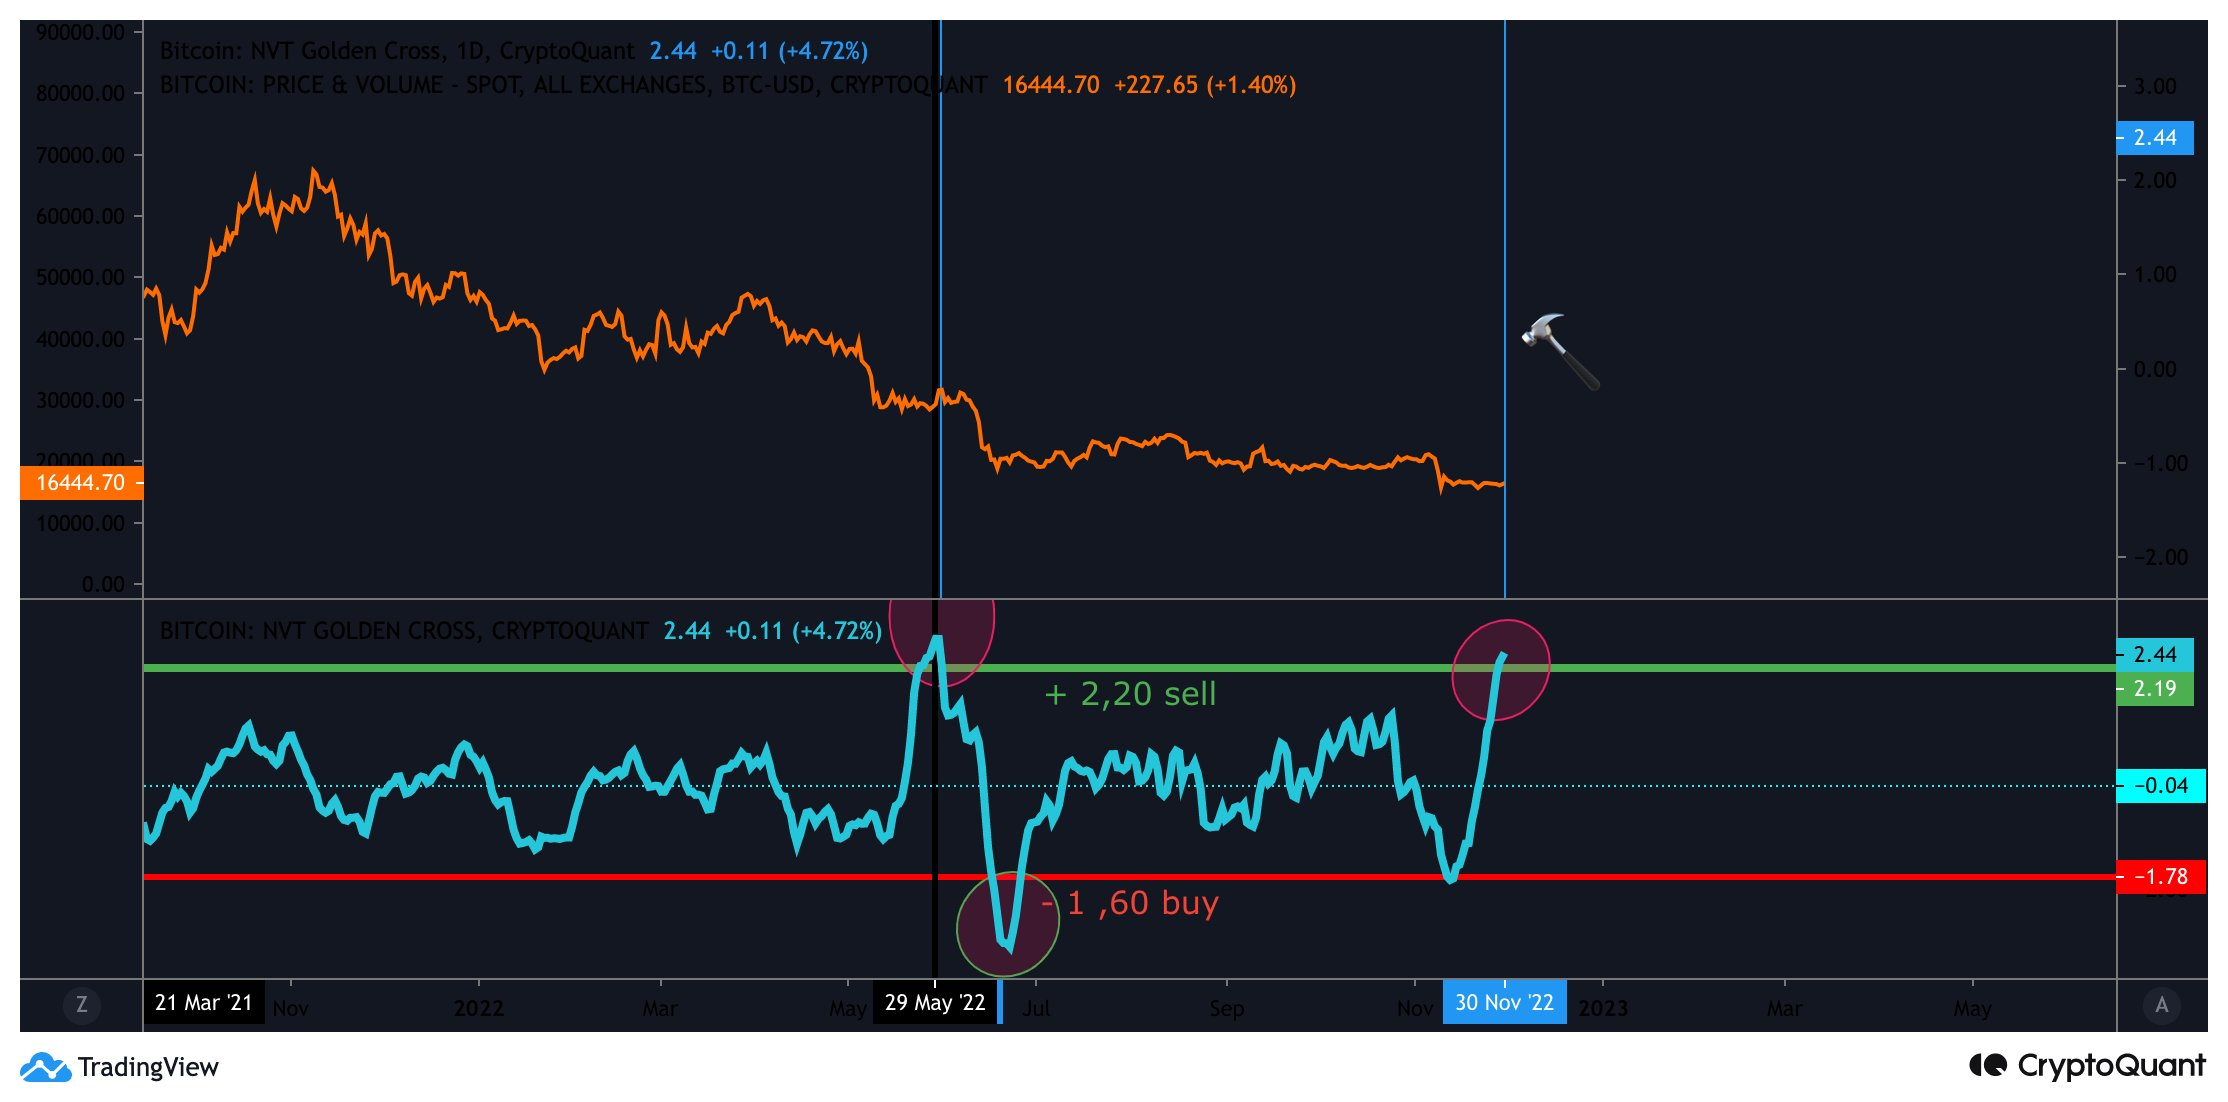
The value of the metric seems to have sharply gone up in recent days | Source: CryptoQuant
As you can see in the above graph, the Bitcoin NVT golden cross has observed some sharp uptrend recently.
The indicator now has a value of 2.44, meaning it has exceeded the 2.20 level that has historically implied sell signals.
During late May, the metric saw a similar surge and rose to a peak value of 2.77. When the following month rolled around, BTC went through a huge crash from $30k to $20k.
Since the crypto is once again overpriced according to the NVT golden cross, it’s possible the coin may go through more drawdown in the coming days.
However, as the metric’s value is still lower than what it was at the high preceding the June crash, there might be potential for it to rise further, before the actual sell signal is in.
BTC Price
At the time of writing, Bitcoin’s price floats around $16.8k, up 2% in the last seven days. Over the past month, the crypto has lost 19% in value.
Below is a chart that shows the trend in the price of the coin over the last five days.

Looks like the value of the crypto has shot up during the last couple of days | Source: BTCUSD on TradingView