Stellar [XLM] extended its decline after sellers retained firm control despite a pickup in market activity.
The token traded at around $0.1514 at press time, reflecting a 7.85% daily loss, while trading volume climbed 10.55% to $236.47 million. The combination suggests market participants actively traded into the decline instead of supporting a recovery.
XLM drifted toward its next demand zone
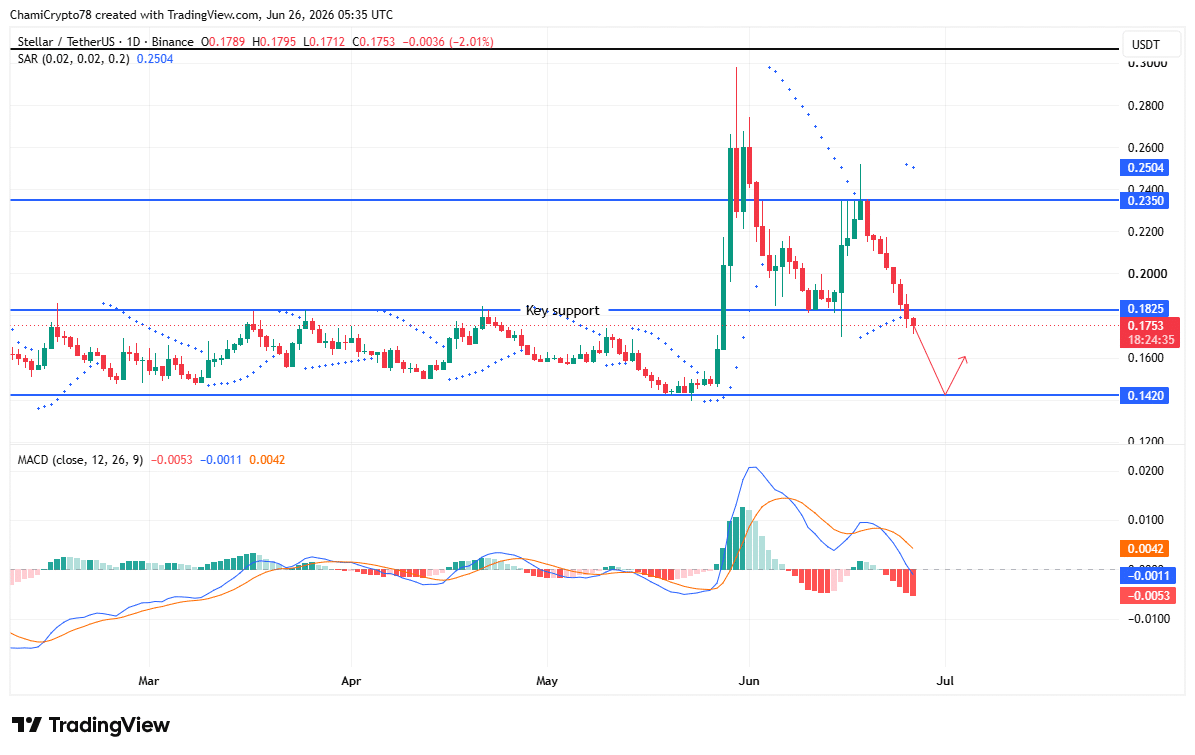
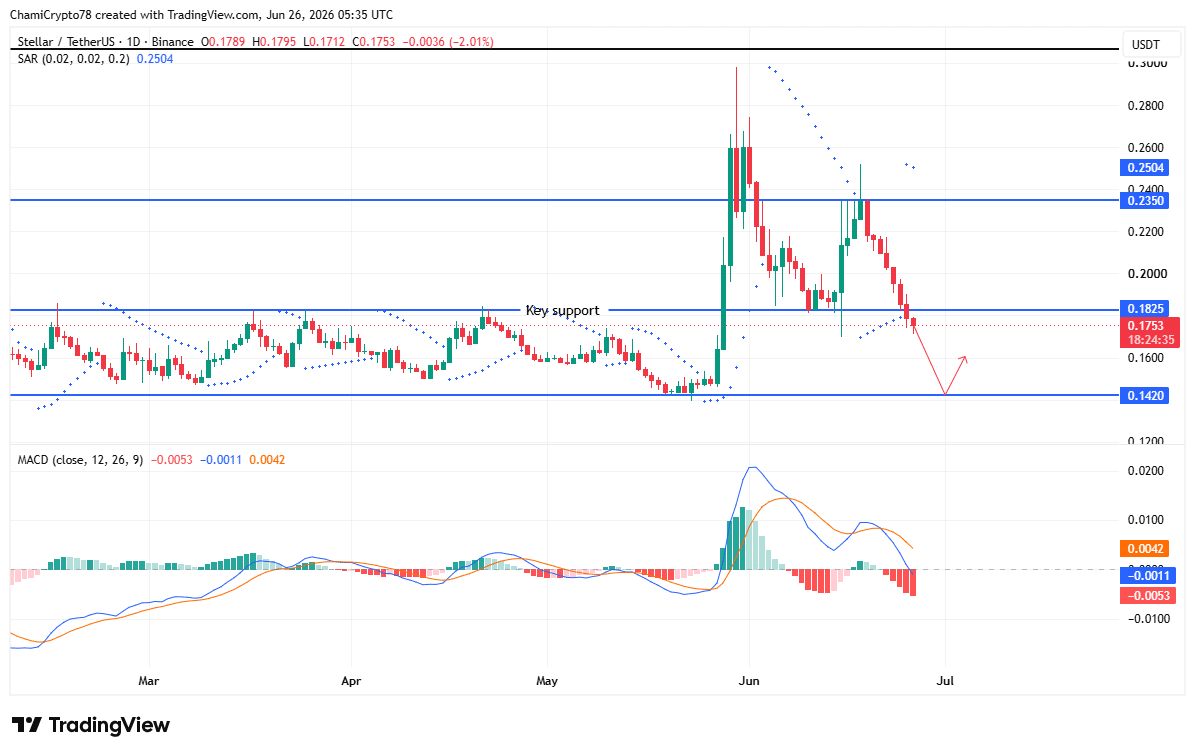
XLM broke below a key horizontal support after failing to preserve its previous trading structure, leaving the $0.142 demand zone as the next major downside objective.
Price remained below the descending trendline, reflecting continued bearish control across the chart.
The MACD maintained a bearish crossover as the histogram stayed below the zero line, showing downside pressure had not eased despite recent consolidation attempts.
In addition, the Parabolic SAR dots continued forming above the candles, reinforcing the existing downtrend instead of signaling a reversal.
Buyers repeatedly attempted to reclaim lost ground, yet every recovery stalled beneath former support, strengthening the bearish structure.
If sellers maintained control, XLM could continue drifting toward $0.142 before any meaningful recovery attempt emerged.
Buyers weakened as bears retained control
Momentum indicators continued favoring sellers as XLM approached another important technical test.
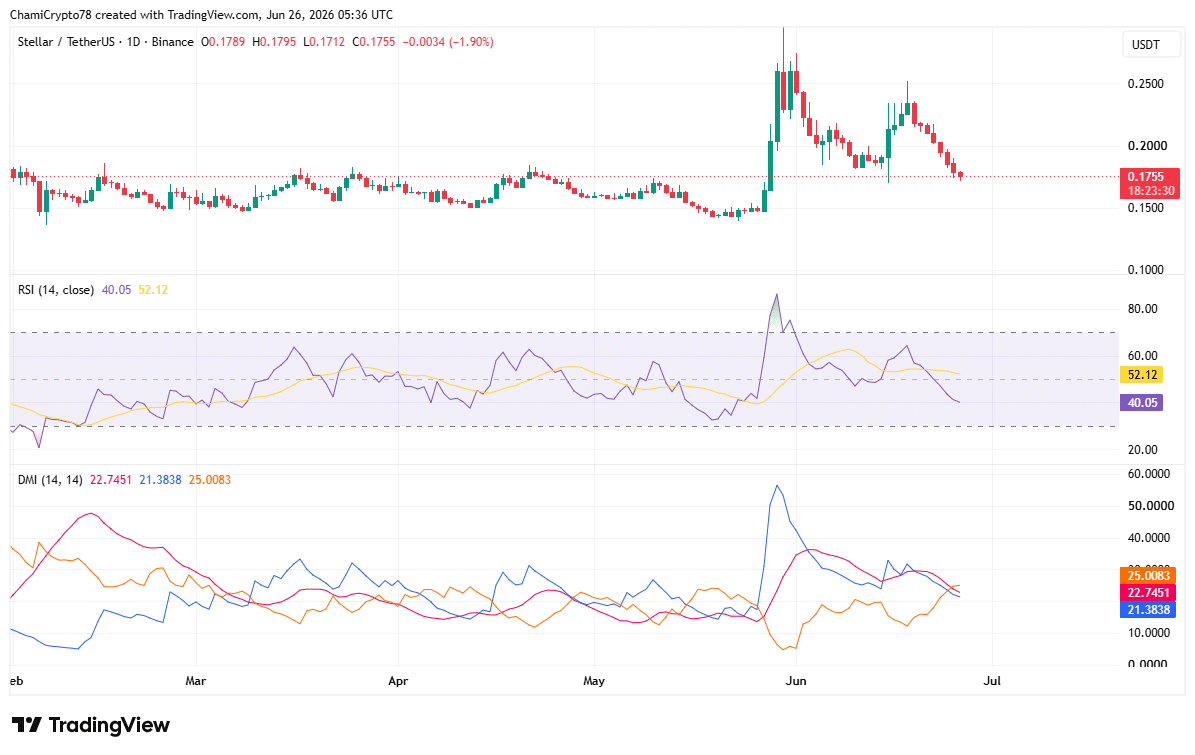
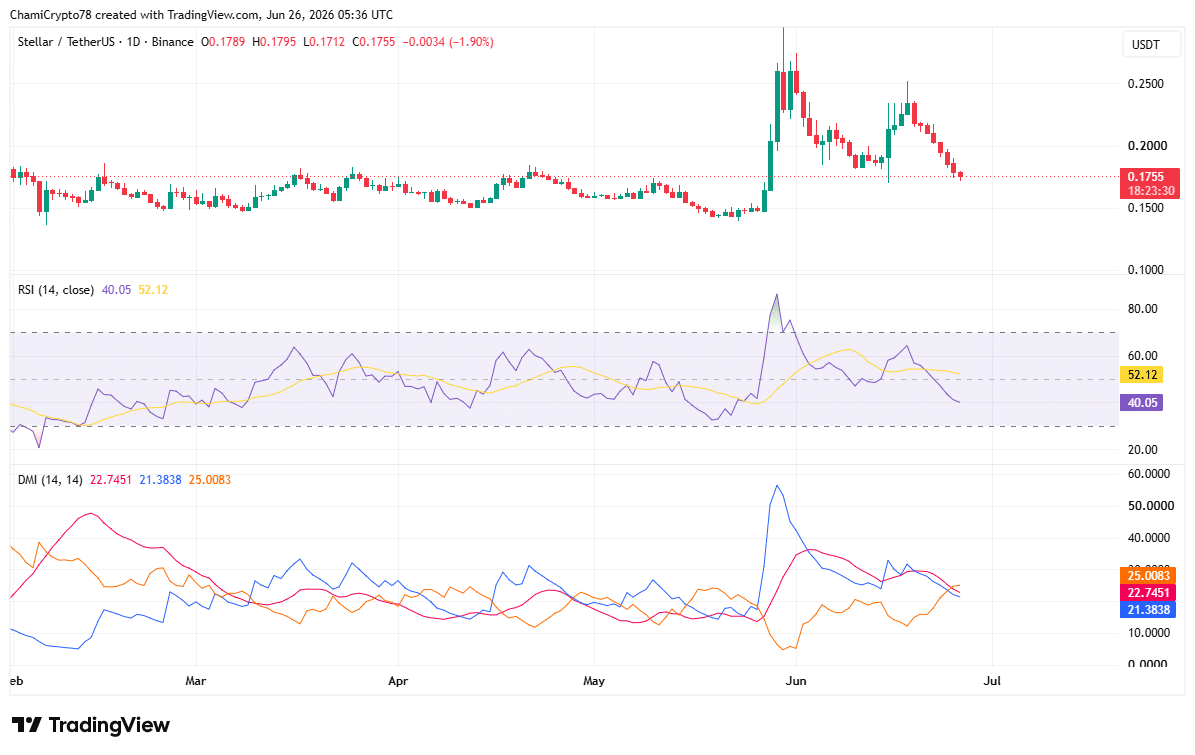
The Relative Strength Index (RSI) fell to 34.42, placing it close to oversold territory after extended selling pressure reduced buying participation.
Although the reading suggested the decline had become increasingly stretched, it had not yet confirmed a reversal signal.
Meanwhile, the Directional Movement Index (DMI) showed -DI at 25 remained well above +DI at 21.38, while the ADX climbed to 22.75.
This combination indicates the prevailing bearish trend retained enough strength to remain intact.
Buyers would likely need to reclaim control of directional movement before sentiment improves. Otherwise, weakening participation could continue supporting another leg lower toward the next demand area.
Is XLM headed for the $0.142 demand zone?
Current market conditions favored another decline toward the $0.142 demand zone before buyers could attempt a sustained recovery.
Selling pressure dominated both Spot order flow and price structure, while trend indicators continued supporting the bearish outlook.
However, if buyers successfully defend the demand zone and momentum indicators stabilize, XLM could begin building a recovery from that area. Until those signals emerge, the downside scenario remains the more probable outcome.
Final Summary
- Rising trading activity failed to slow XLM’s decline as sellers continued controlling the market.
- XLM could test the $0.142 demand zone before buyers attempt a meaningful recovery.