Bitcoin [BTC] is currently trading in one of its most opaque phases in recent years. Price action has repeatedly invalidated expectations of a sustained rally.
From its peak of $126,000, BTC declined by $48,000 to $78,000, a move that reflects just how deeply bearish sentiment has taken hold.
Even so, spot investors remain one of the most reliable indicators of both short- and long-term market direction, particularly during periods when sentiment begins to shift.
Spot market weakness persists
BTC has now recorded five consecutive months of negative spot netflows, with no meaningful bullish interruption. This sustained pressure reflects a broader contraction in capital, as investors steadily reduce exposure.
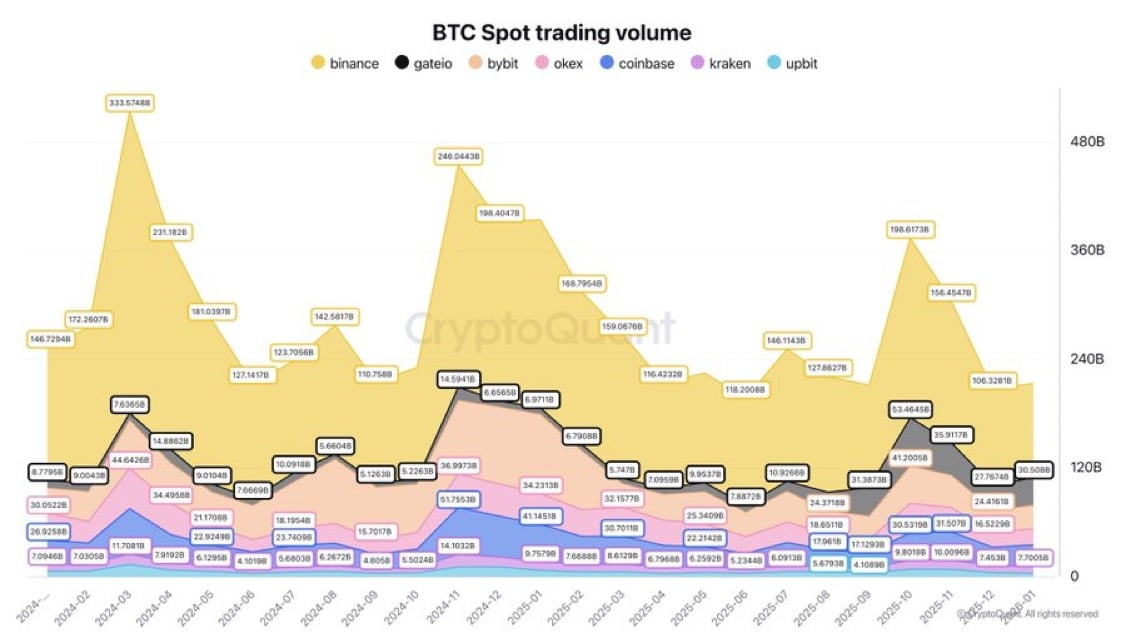
Spot trading volume has collapsed since the drawdown that began on the 10th of October. Binance data reinforces the trend; spot volume stood near $200 billion in October but has since fallen to about $104 billion.
Spot traders are a key source of market momentum. When their activity declines sharply, it signals weakening conviction and subdued demand, conditions that tend to weigh heavily on price.
Capital outflows are also evident in stablecoin markets. Stablecoin capitalization has declined by approximately $10 billion, pointing to reduced investor willingness to keep funds parked on-chain.
Stablecoins typically act as a buffer during volatile periods, allowing capital to re-enter once conditions stabilize. The current drawdown suggests investors are either reallocating elsewhere or exiting the market altogether.
Derivatives markets have mirrored this retreat. The October crash triggered a sharp contraction in open interest, with a single-day decline of roughly $8 billion, equivalent to about 70,000 BTC at the time. This highlights a broad reduction in leverage and risk appetite.
Can spot activity fuel a short-term rebound?
Despite shrinking capital and muted momentum, spot market data offers a narrow but notable basis for a potential short-term rebound.
Recent indicators point to a potential short‐term upside move for Bitcoin. Spot exchange netflows, which measure inflows and outflows to gauge buyer versus seller activity, support this view.
From January 19 to January 26, buyers accumulated approximately $2.1 billion worth of Bitcoin despite ongoing price pressure. This steady accumulation offers early signs that demand may be quietly returning.
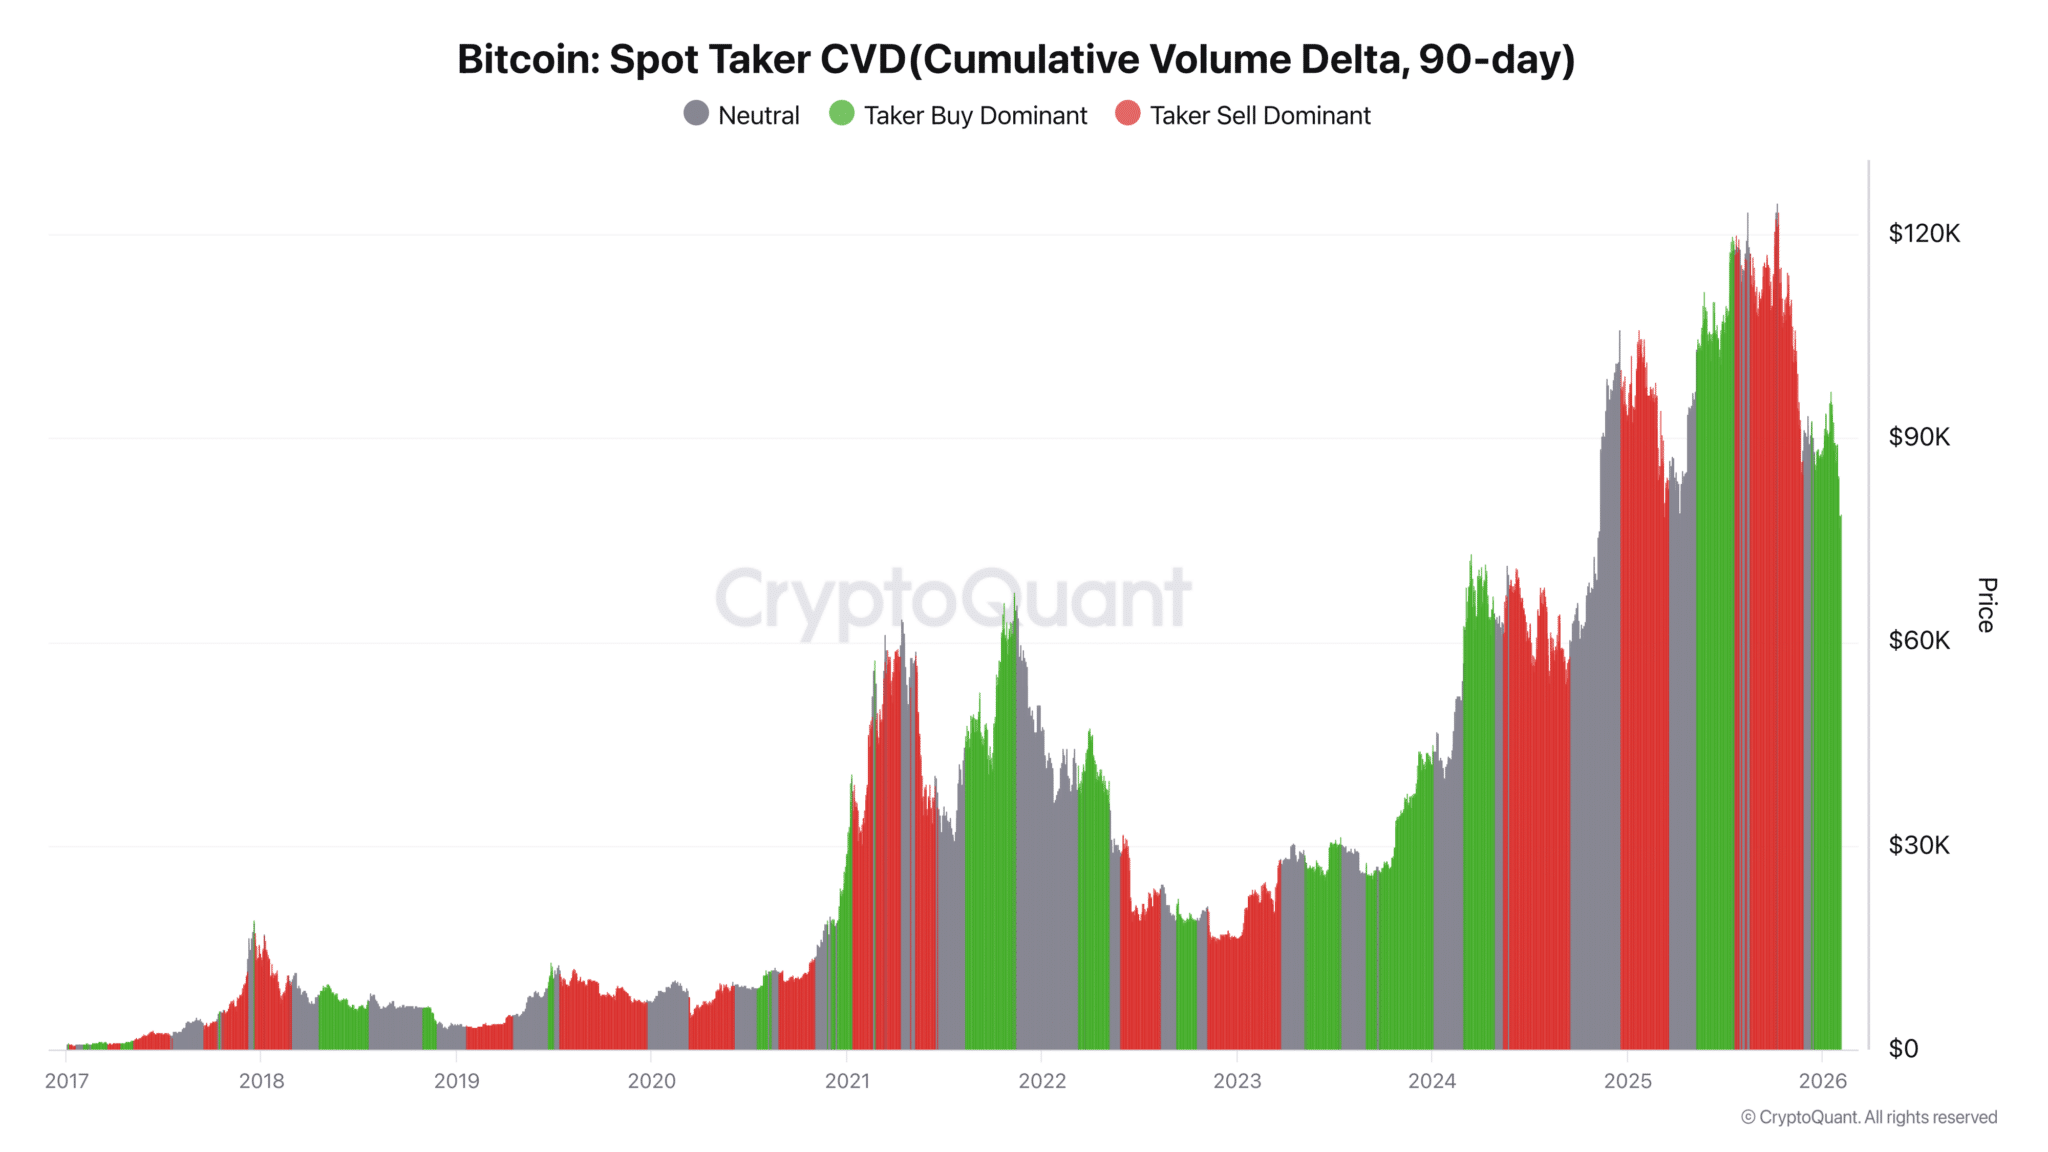
Additional confirmation comes from the Spot Taker CVD (cumulative volume delta). Over the past three months, the metric, which measures the difference between aggressive spot buying and selling, has turned positive.
This shift indicates that, despite Bitcoin’s weak performance since December, buyers have accounted for a larger share of spot volume. If this trend persists, sentiment could gradually tilt in their favor, setting the stage for at least a short-term rebound once confidence improves.
Why the signal remains fragile
Still, these signals remain insufficient to support a sustained recovery.
While recent spot activity points to conditions that could enable a rebound, overall participation remains thin. Retail trading frequency data from CryptoQuant indicates that the market is firmly in a neutral zone, with neither buyers nor sellers exerting clear dominance.
This neutrality implies that trading activity is too limited to influence price direction materially. Historically, stronger rebound signals emerge when a green dot appears on the spot retail activity chart, marking renewed buying interest after a drawdown.
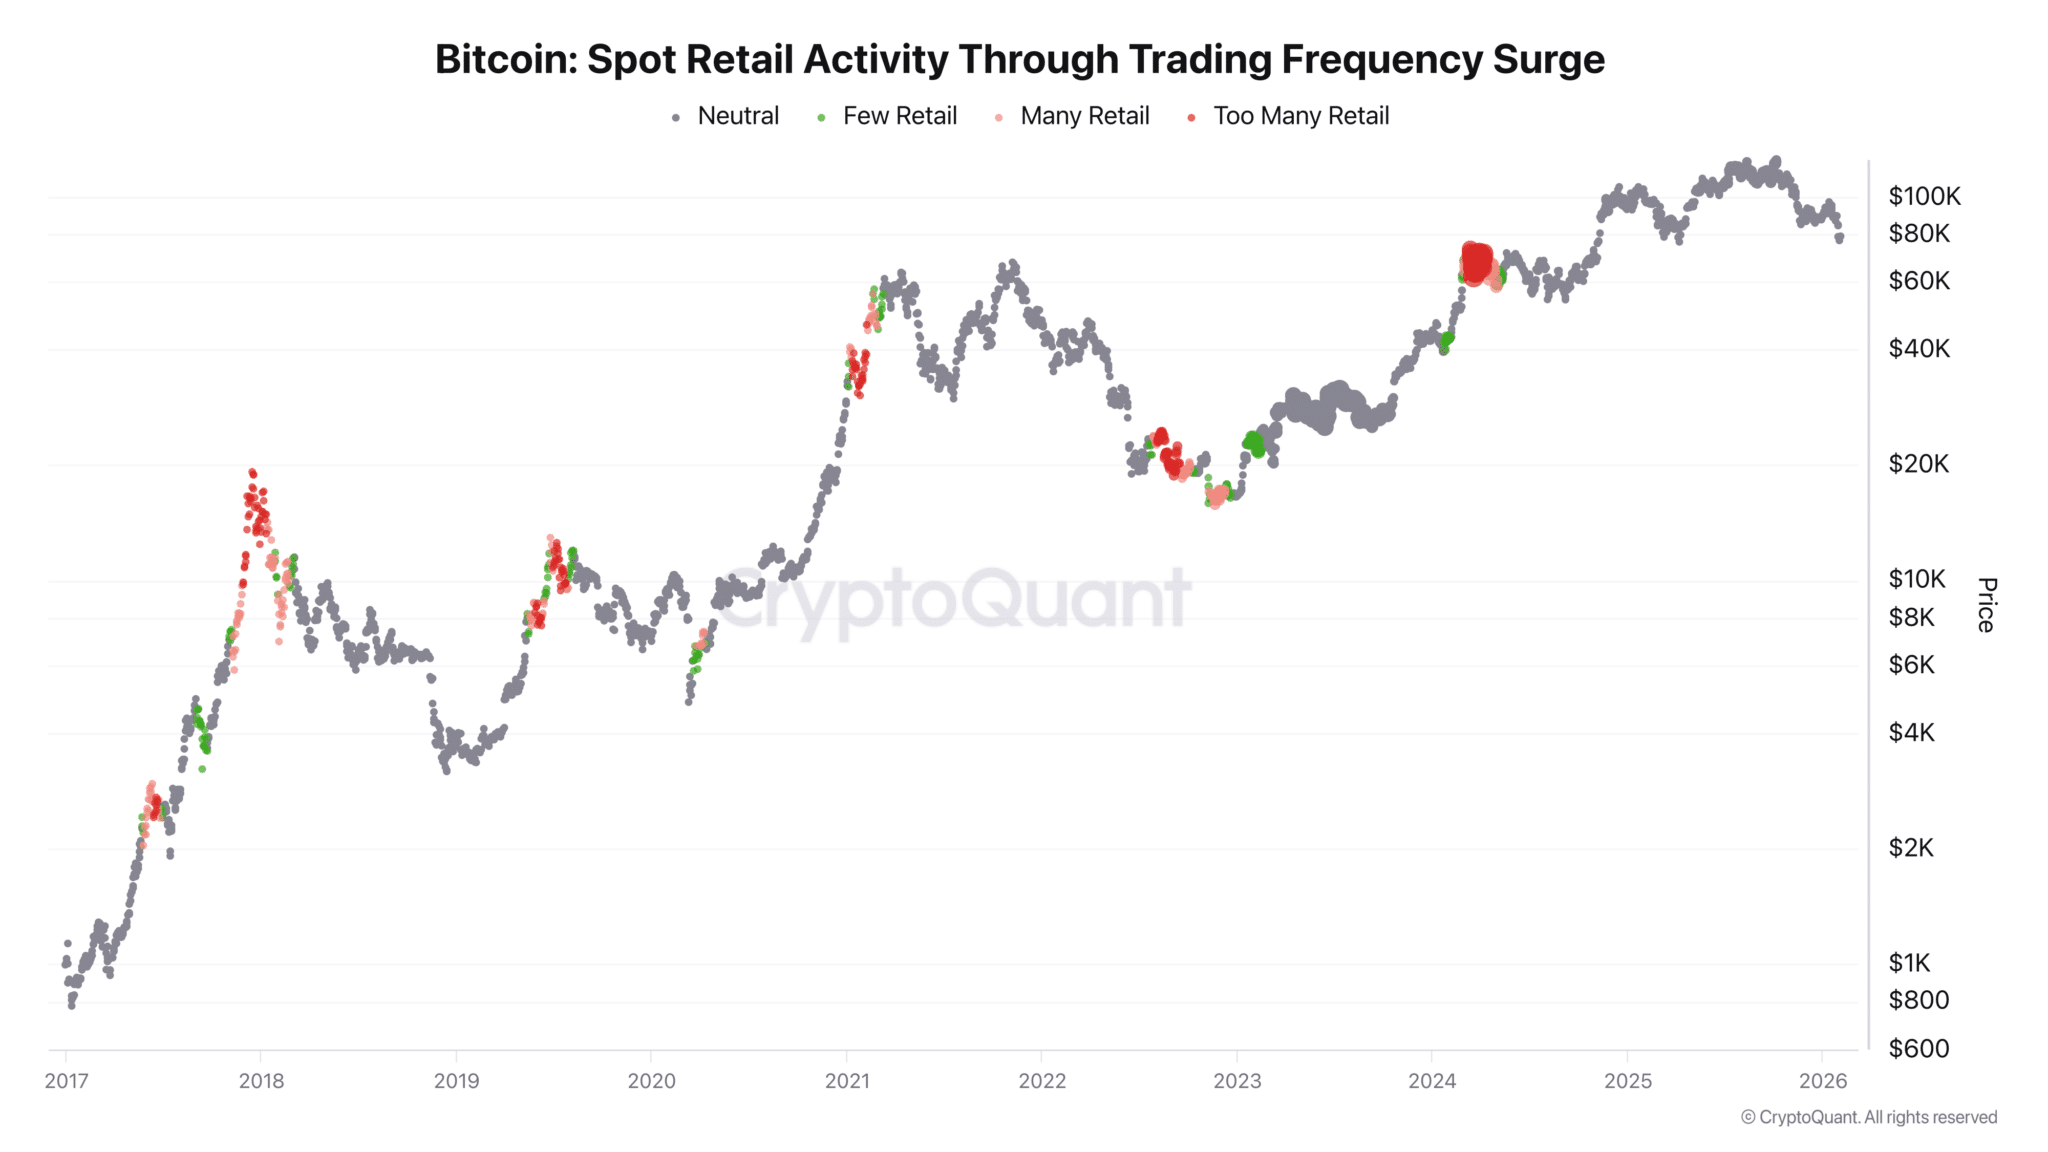
Past instances show that such formations often precede upside moves. While not a definitive signal, it remains a useful framework for tracking whether spot market strength is building enough to challenge the prevailing bearish trend.
Final Thoughts
- Since the October 2025 crash, activity in the spot market has thinned considerably, with trading volume sliding nearly in half to about $104 billion.
- Beneath the dominant bearish narrative, short-term spot investors may be quietly shaping conditions for a rebound.