Bitcoin and Ethereum look bullish: But they face the same pre-breakout risk

Ambcrypto发布于2026-01-05更新于2026-04-03

文章摘要

Bitcoin broke above the $90k resistance after weeks of consolidation, though declining whale balances signaled potential setbacks. Analyst CrypNuevo warned of a possible "liquidity run"—a false breakout above $94.5k that could trap bulls, followed by a sweep of lows near $84k before a true rally toward $100k. Alternatively, rejection at the $92k resistance could lead to a drop toward $80.6k. Ethereum shows a comparable pattern, with key liquidity levels at $3,500 and $2,700–$2,800. Traders are advised to wait for clearer momentum shifts and avoid premature long entries, as both assets face pre-breakout volatility risks.

Bitcoin [BTC] has managed to break the $90k round-number resistance after three weeks of sideways price action between the $85k – $90k region.

Declining whale balances was a warning sign that the rally might face setbacks and delays.

In a post on X, crypto analyst CrypNuevo highlighted another reason why Bitcoin’s expected price bounce might see a liquidity run before the true impulse move.

Analyzing the expected Bitcoin liquidity run

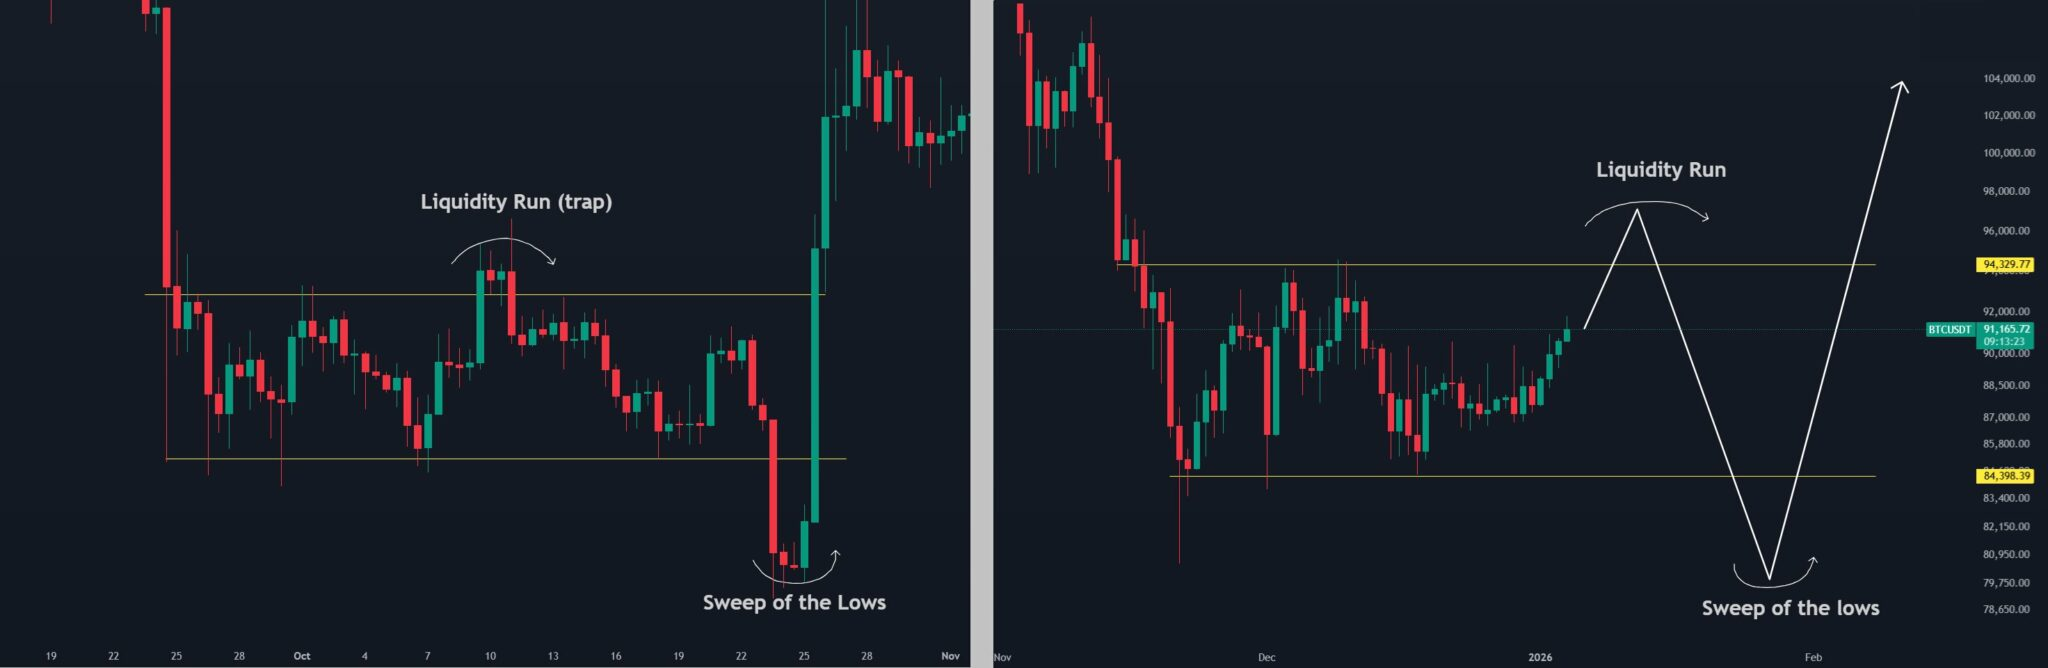
A liquidity run is an initial false price move that is designed to trap breakout traders, explained the analyst. In this scenario, a breakout past the $94.5k local resistance would persuade bulls that the breakout was underway.

The new long positions’ liquidation levels can then be hunted with a sweep of the lows below $84k. Thereafter, the true impulse move to $100k and beyond can commence.

At the same time, the analyst warned that it is possible that the resistance at the $92k from the 50-day EMA could reject Bitcoin.

In this scenario, the liquidity run to $96k might not happen, and instead BTC might directly head toward $80.6k in the coming days.

AMBCrypto had noted recently that a move toward $94k-$96k was likely this month but also warned of bearish ETF flows in the second half of December that gave traders a dilemma.

The similarities with Ethereum

Interestingly, Ethereum [ETH] could also see a similar outcome on the price charts. While the leading altcoin tends to follow Bitcoin, the liquidation heatmap outlined what swing traders can expect in January.

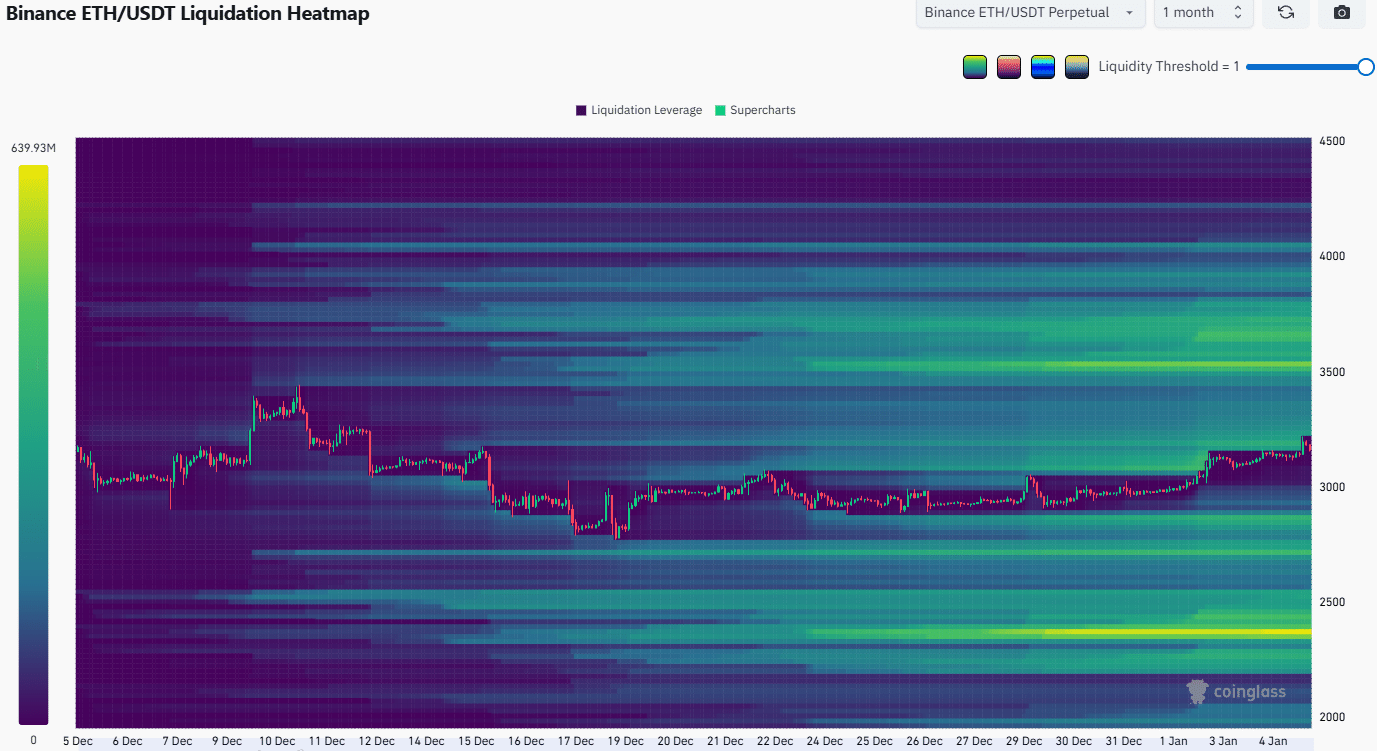
Ethereum has also collected the liquidity at $3,200 and has another strong magnetic zone at $3,500. It also has an attractive liquidity cluster at $2,700-$2,800.

A sweep of these lows could serve as a launchpad for the next ETH rally.

This meant that Bitcoin and Ethereum traders not already in long positions should be patient. Those in short-term profits could use a lower timeframe momentum shift to take profits.

A BTC breakout past the $94.5k is not an automatic signal to go long, and traders should beware of the possibility of a liquidity run.

Final Thoughts

  • A sweep of the $96k level and a subsequent reversal below $94k could be a warning sign that Bitcoin could drop to $84k and $80.6k.
  • Ethereum liquidation levels also showed similarities to Bitcoin’s, and a price drop to $2,800 was a possibility.

相关问答

QWhat is a liquidity run in the context, as explained by the analyst CrypNuevo?

AA liquidity run is an initial false price move designed to trap breakout traders. It involves a breakout past a key resistance level to persuade bulls that a rally is starting, only for the price to reverse and hunt the liquidation levels of the new long positions before the true upward move begins.

QWhat are the two possible price scenarios for Bitcoin if it faces rejection at the $92k resistance from the 50-day EMA?

AIf rejected at the $92k resistance, Bitcoin might not experience the liquidity run to $96k and could instead head directly toward the $80.6k support level in the coming days.

QAccording to the article, what similar price behavior does Ethereum exhibit compared to Bitcoin?

AEthereum exhibits a similar potential for a liquidity run, with a strong magnetic zone at $3,500 and an attractive liquidity cluster at $2,700-$2,800. A sweep of these lower levels could serve as a launchpad for its next rally, mirroring the potential behavior seen in Bitcoin.

QWhat warning sign does the article mention for traders considering going long if Bitcoin breaks past $94.5k?

AThe article warns that a breakout past $94.5k is not an automatic signal to go long. Traders should beware of the possibility of a liquidity run, where the price could reverse and sweep lower liquidation levels, causing significant losses for those who entered long positions.

QWhat are the key liquidity levels identified for Ethereum on the price charts?

AThe key liquidity levels identified for Ethereum are the already collected liquidity at $3,200, a strong magnetic zone at $3,500, and an attractive liquidity cluster in the $2,700-$2,800 range.

你可能也喜欢

交易

现货
合约

热门文章

加密市场宏观研报:《GENIUS Act》法案取得重大进展,BTC突破历史新高,后市全新展望

2025年5月22日,比特币价格正式突破11万美元大关,创下历史新高。在政策面、宏观经济、资金面与投资者结构共同作用下,一场结构性牛市浪潮正在展开。而此轮上涨背后的核心驱动,是美国《GENIUS稳定币法案》的实质性进展以及多项利好的叠加。本文将从政策端突破、宏观环境转向、链上与ETF资金结构、交易行为演化,以及重点受益赛道五大维度,全面解析此轮BTC再创新高的深层逻辑,并前瞻下半年市场的潜在趋势。

1.2k人学过发布于 2025.05.22更新于 2025.05.22

加密市场宏观研报:《GENIUS Act》法案取得重大进展,BTC突破历史新高,后市全新展望

相关讨论

欢迎来到HTX社区。在这里,您可以了解最新的平台发展动态并获得专业的市场意见。以下是用户对BTC(BTC)币价的意见。

活动图片