17% Pump Ignites Bitcoin SV (BSV) Charts: Will It Boost or Block a $30 Run?

TheNewsCrypto发布于2026-01-05更新于2026-01-05

文章摘要

Bitcoin SV (BSV) surged 17.26% in 24 hours, breaking key resistance levels and reaching $21.91, with trading volume spiking over 491%. Technical indicators like MACD and Chaikin Money Flow signal strong bullish momentum and buying pressure. However, the RSI at 83.22 suggests an overbought condition, raising the possibility of a short-term pullback. If bullish trends continue, BSV could target $25.34 or even $29.51. Conversely, a bearish reversal might push it down to support near $17.48 or lower.

With the 1.25% spike in the crypto market, bullish momentum is attempting to reclaim the lost ground. The active mixed sentiment is pushing the assets to trade in both red and green zones, which include Bitcoin and Ethereum. Meanwhile, among the altcoins, Bitcoin SV (BSV) has registered a steady and solid 17.26% surge in the last 24 hours.

The asset’s crucial resistance zones have been broken to confirm the uptrend. BSV opened the day trading at a low mark of $18.50, and with the bullish encounter in the market, the price has risen to a high of $21.91. If the bullish support sustains, it could witness higher targets.

The CoinMarketCap data has reported that Bitcoin SV is currently trading at the $21.91 mark, with its market cap found at $427.58 million. Significantly, the daily trading volume of BSV has increased by over 491.25%, reaching the $78.22 million zone.

Can Bitcoin SV Keep Its Bullish Momentum Alive?

The technical indicators of Bitcoin SV show a bullish shift, with the Moving Average Convergence Divergence (MACD) line crosses above the signal line. This crossover serves as an early signal for potential price gains. Besides, the Chaikin Money Flow (CMF) indicator at 0.24 signals strong buying pressure in the BSV market. The money is flowing into the asset, implying accumulation, supporting the price movement and the positive market bias.

Moreover, the Bull Bear Power (BBP) value of Bitcoin SV settled at 4.22, which hints at strong bullish dominance. The bulls are pushing the price above, and this aligns with strong upside momentum. BSV’s daily Relative Strength Index (RSI) reading at 83.22 reflects the overbought condition, with very strong bullish sentiment. With the buyers in control, such high levels increase the risk of a short-term pullback as the market cools off.

Bitcoin SV’s recent price chart exhibits upside pressure. Assuming the bulls continue to gain more traction, the price could climb toward the $25.34 resistance range. With the formation of the golden cross, the asset’s price might climb and test the $29.51 level or even higher.

On the flip side, a bearish reversal would trigger Bitcoin SV to slip down and find the nearest support at around $17.48. Upon the asset’s market turning aggressively bearish, the death cross could emerge, and likely send the price to its former low below the $13.15 range.

Top Updated Crypto News

Onyxcoin (XCN) Jumps 22%: Can It Keep Flying, or Will Profit-Taking Strike?

TagsAltcoinBitcoin SVBSVCryptocurrency

热门币种推荐

相关问答

QWhat is the percentage increase in Bitcoin SV (BSV) price over the last 24 hours as mentioned in the article?

ABitcoin SV (BSV) has registered a 17.26% surge in the last 24 hours.

QAccording to the technical analysis, what does the MACD line crossing above the signal line indicate for BSV?

AThe Moving Average Convergence Divergence (MACD) line crossing above the signal line serves as an early signal for potential price gains, indicating a bullish shift.

QWhat is the current RSI reading for BSV, and what market condition does it suggest?

AThe daily Relative Strength Index (RSI) reading for BSV is 83.22, which reflects an overbought condition with very strong bullish sentiment, but also increases the risk of a short-term pullback.

QWhat key resistance level could BSV price test if the bullish momentum continues?

AIf the bullish momentum continues, the BSV price could climb toward the $25.34 resistance range and might even test the $29.51 level.

QWhat significant change was reported in BSV's daily trading volume?

AThe daily trading volume of BSV has increased by over 491.25%, reaching the $78.22 million zone.

你可能也喜欢

比特币价格突破65,000美元:价值5600万美元的“轧空行情”惩罚了押注下跌的交易者

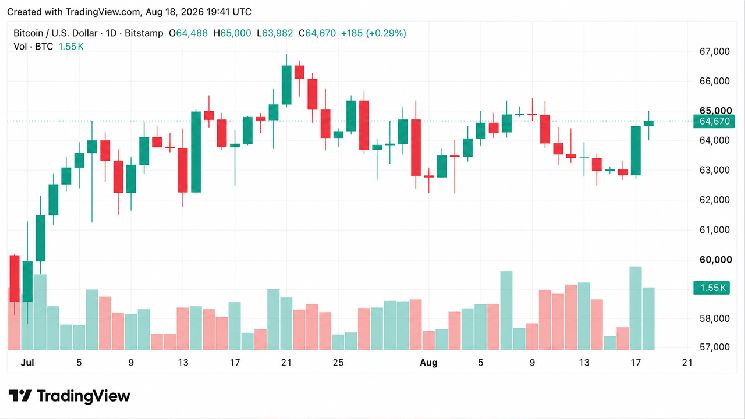
周二,比特币短暂触及65,000美元,尽管中东地缘政治紧张局势因美伊谅解备忘录到期而进入关键阶段。在此之前,比特币已回升至64,000美元以上。 市场数据显示,比特币在午夜前两小时一直保持在64,200美元上方,随后卖方压力几乎将其压至64,000美元以下。之后经历了近10小时的波动,价格在64,300至64,000美元间震荡。然而,在东部标准时间上午9:30后不久,比特币在一小时内飙升约1,000美元,达到65,000美元。虽然此后涨势减弱,价格一度回落至64,744美元,但当日仍收涨0.5%,周涨幅超过2%。其市值接近1.3万亿美元。 在衍生品市场,这次上涨再次重创了做空比特币的交易者。据Coinglass数据,过去24小时的波动导致价值5600万美元的杠杆空头头寸被清算,而清算的多头头寸仅为400万美元。尽管如此,在加密货币市场总清算额中,多头头寸仍占1.08亿美元。 此次上涨似乎始于有消息称某大型持有者上周并未出售比特币。但一些分析师警告,65,000美元附近存在大量卖单,表明突破可能难以持续。 相反,Skybridge Capital创始人安东尼·斯卡拉穆奇持不同观点,他认为尽管比特币处于明显的熊市,但当前55%的跌幅远小于以往周期中75-80%的跌幅,这表明许多坚定买家正在为下一次上涨做准备。 区块链分析平台Glassnode的数据支持了这一观点,指出“坚定持有者”正在积极买入比特币。该公司表示,市场底部通常随着获利了结放缓和新买家入场而形成,这与2022年的市场结构相似。Glassnode强调,当1月份比特币价格跌至60,000美元时,坚定持有者的持仓量增长最为显著。

cryptonews.ru39分钟前

比特币价格突破65,000美元:价值5600万美元的“轧空行情”惩罚了押注下跌的交易者

cryptonews.ru39分钟前

交易

现货

热门文章

相关讨论

欢迎来到HTX社区。在这里,您可以了解最新的平台发展动态并获得专业的市场意见。以下是用户对PUMP(PUMP)币价的意见。

活动图片