Understanding Leverage Dynamics in Crypto: A New Approach to Position Tracking
Leverage is a defining feature of cryptocurrency markets, driving and exacerbating both explosive rallies and dramatic downturns. Derivatives, particularly crypto-native perpetual swaps, often far exceed spot trading volumes, amplifying market sentiment and volatility. Understanding how traders enter and exit leveraged positions is critical for gauging short-term price movements and identifying broader market trends.
Traditionally, the industry has relied on liquidation data and funding rates to assess leverage and positioning behavior. However, these metrics have significant shortcomings. Liquidation data, while widely adopted, focuses solely on forced exits and thereby captures only a small fraction of total position changes. This approach is further hampered by inconsistent reporting across exchanges, where some platforms delay or omit data, and its post-event nature limits its utility for real-time decision-making.
For instance, a major liquidation event might only become visible after prices have already shifted significantly, missing the initial market stress or build up of risk. Funding rates, on the other hand, measure the cost of holding positions based on perpetual-spot price dislocations, offering a proxy for net positioning. Yet, they react sluggishly to rapid market shifts, fail to indicate the scale of position adjustments, and can remain subdued during large deleveraging events.
A case in point is a massive long liquidation where spot and perpetual prices move in tandem, resulting in minimal funding rate changes despite substantial position unwinding. Similar latency can be observed during short squeezes.
To address these gaps, this article introduces the Leverage Position Openings and Closures (LPOC) metrics, designed to infer positioning shifts by analyzing the relationship between price and open interest (OI). Unlike traditional metrics, LPOC provides a more immediate and comprehensive view of leverage dynamics, leveraging OI data to capture both voluntary and forced position changes across diverse market conditions.
The Foundation: Price and Open Interest Alignment
The LPOC methodology hinges on the interplay between price trends and open interest, which tracks all outstanding derivative contracts. By analyzing how these two metrics align, we can infer four distinct positioning behaviors (see Figure 1):
- Long Position Openings: When price and OI rise together, traders are adding long exposure into an upward trend.
- Short Position Openings: A declining price with increasing OI suggests traders are opening short positions.
- Long Position Closures: A simultaneous drop in both price and OI indicates long positions are being closed.
- Short Position Closures: Rising prices alongside falling OI point to short positions being exited.
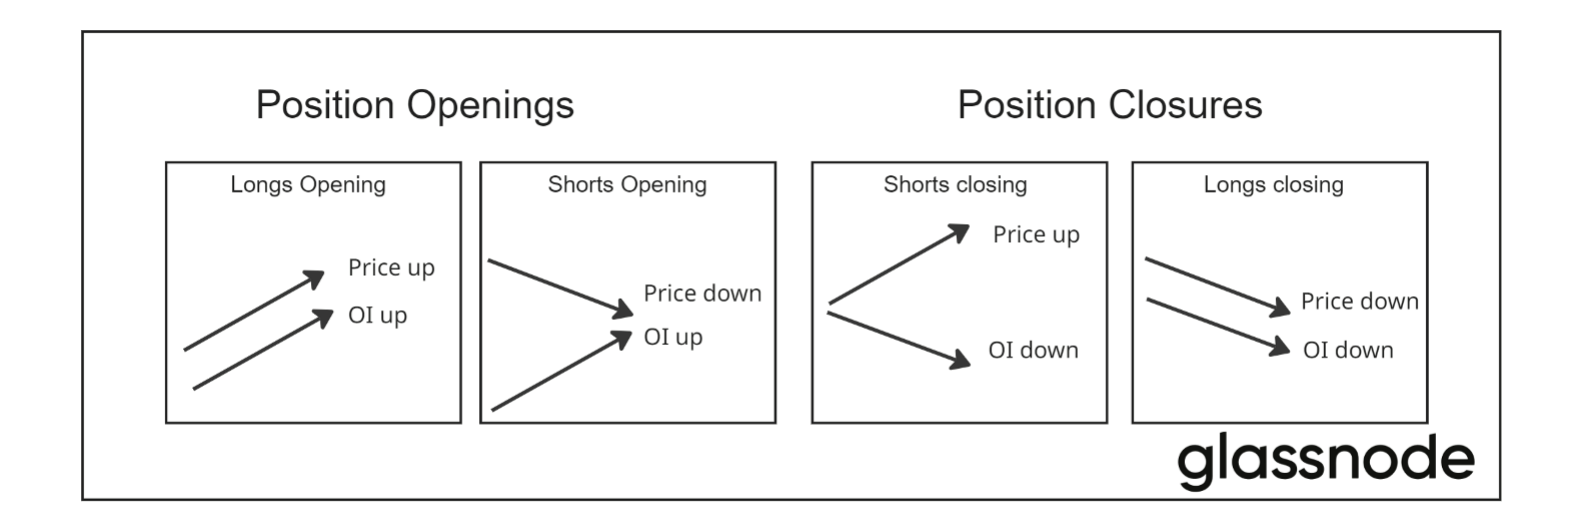
An underlying assumption of the LPOC metrics is that, on average, the positioning reflected within open interest consists mostly of trades opening in the direction of prevailing price movements. This implies that increases in OI while price is rising typically correspond to new long positions, while increases coinciding with falling prices suggest new short positions, with closures inferred when OI and price trends diverge.
This approach is asset-agnostic and can be applied to any asset with available OI data, offering a consistent lens across diverse market segments. The signal is processed by calculating short-term trends in price and OI, then deriving a composite indicator through the product of these trends to reflect their directional alignment.
Notably, short-side signals (short openings and closures) are generally considerably lower in magnitude compared to long-side signals due to differences in market participation and an inherent long-bias within crypto markets. We therefore provide a scaled version of the metric to ensure comparability and highlight relative intensity across all position types.
Insights from Bitcoin: Marking Tops and Bottoms
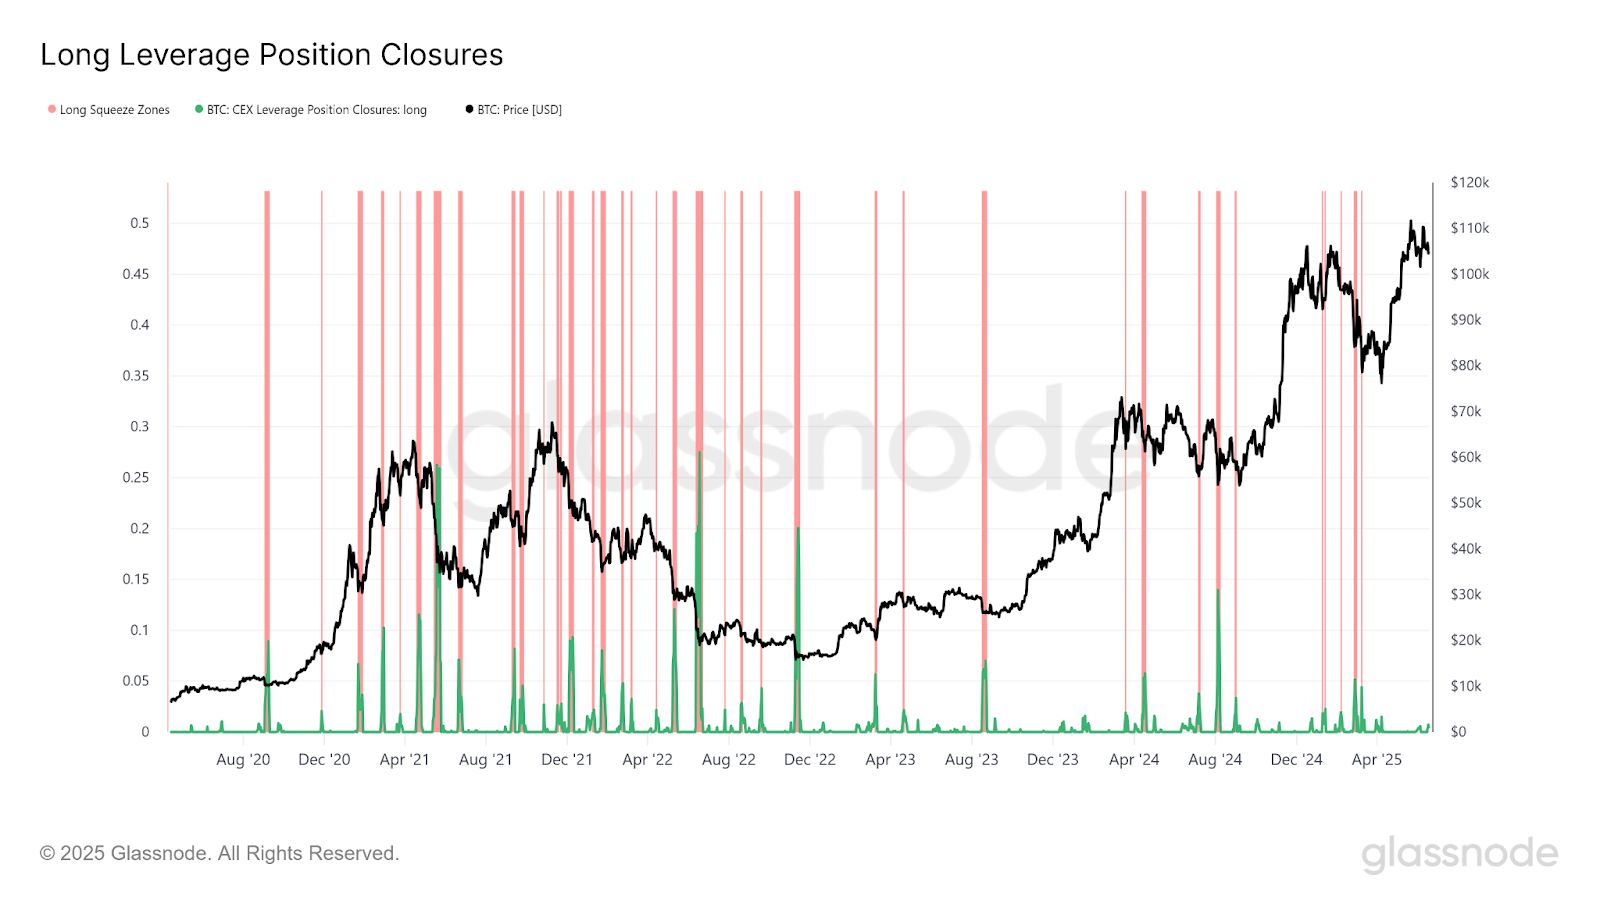
Applying LPOC to Bitcoin reveals clear patterns that align with historical market turning points. The above image (Figure 2) clearly shows how long position closures often mark local bottoms after downward price movements. Especially during sustained uptrend periods, such as June 2020 to mid-2021 and late 2022 to the present, the signal accurately identifies many local bottoms. This becomes especially clear when viewing the red shaded areas, which often coincide with low points, especially, during sustained uptrends.
The accuracy of these signals appears highest when the signal strength is elevated, suggesting that more extreme deleveraging events increase the likelihood of a price rebound. This aligns with the idea that forced deleveraging creates inefficiencies by driving prices down more rapidly than an orderly sell-off.
Identifying Periods of Exuberance and Froth
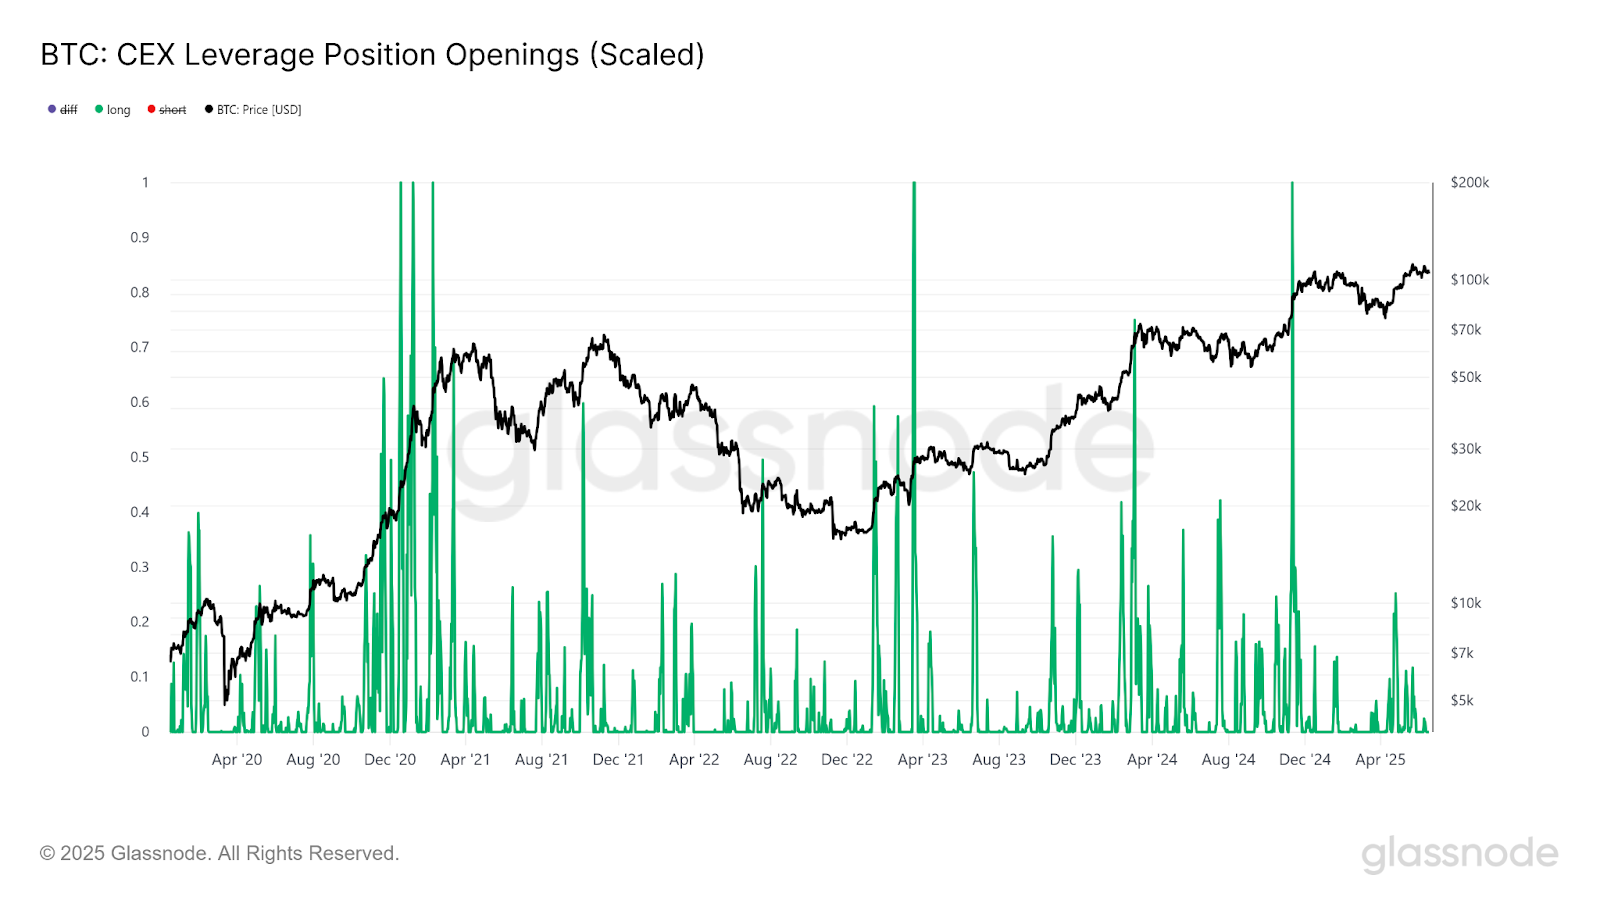
Figure 3 illustrates how ramps in BTC long positioning often mark areas of exuberance and froth. Periods of significant long position openings are frequently observed just prior to, or leading up to, market tops, reflecting overexuberance among traders. This buildup of long exposure tends to signal potential reversal zones, as the market often peaks shortly after these ramps, highlighting the LPOC metric’s utility in identifying zones of elevated risk.
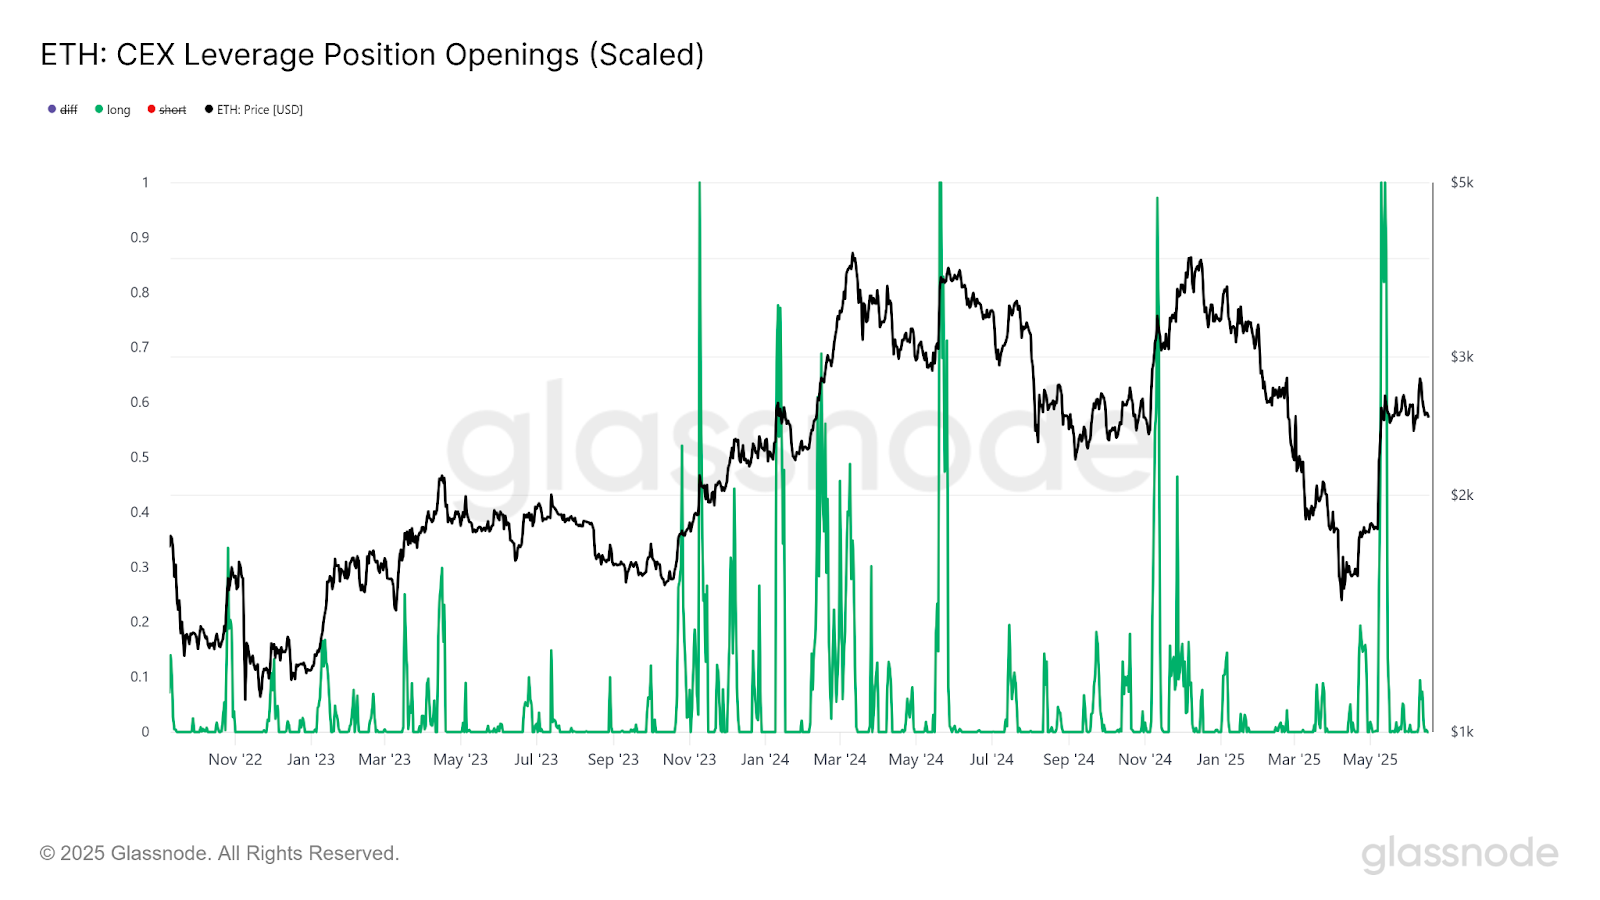
The pattern is even clearer when applied to ETH in Figure 4. Here, ramps in long position openings similarly precede market tops or come very close to them. Shortly after these increases in long exposure, the market tends to reach its peak, underscoring the consistency of this signal across assets and its value in anticipating overextended positioning.
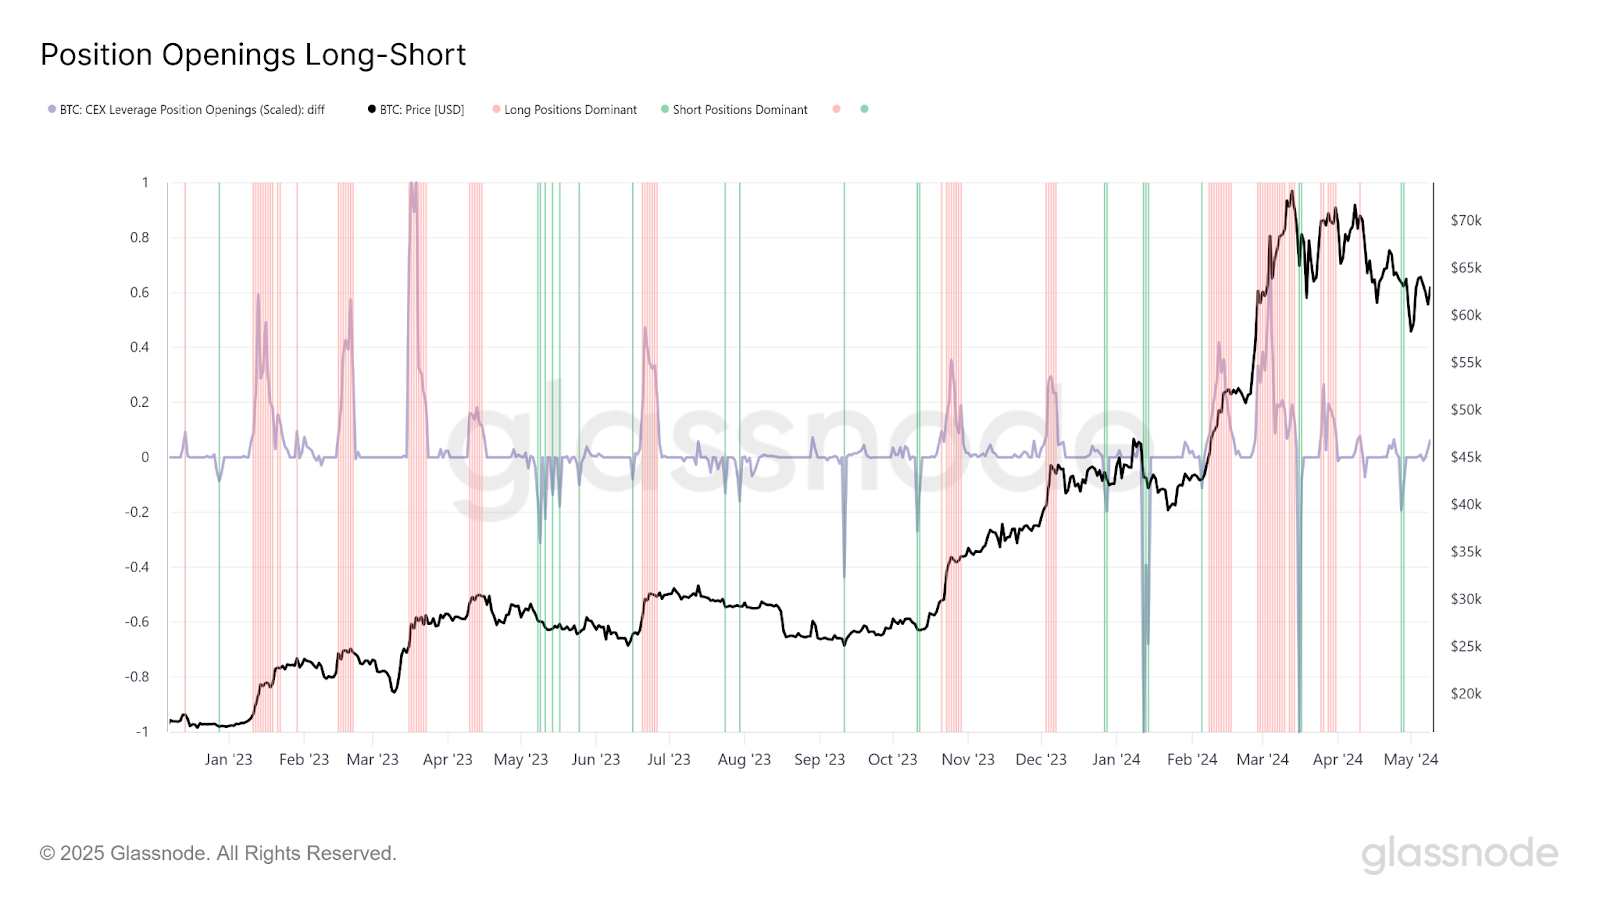
The Long-Short Position Openings Difference, calculated by subtracting scaled short position openings from scaled long position openings, highlights periods of dominant market sentiment. Figure 5 visualizes this difference, with red shading for long dominance and green for short dominance, using an arbitrary threshold.
Typically, long positions surge during price uptrends, while short positions peak during downtrends. This aligns with the nature of the LPOC metrics, which detect long openings during uptrends and short openings during downtrends based on elevated open interest. However, the key observation is that when positioning intensity peaks and then subsides, the trend often reverses, signaling potential market turning points.
Market Dissection and Generating Narratives
The LPOC metrics provide a detailed lens for understanding dominant positioning during key market events. A prime example is the November 2022 FTX crash, which can be traced through the positioning dynamics of both BTC and SOL.
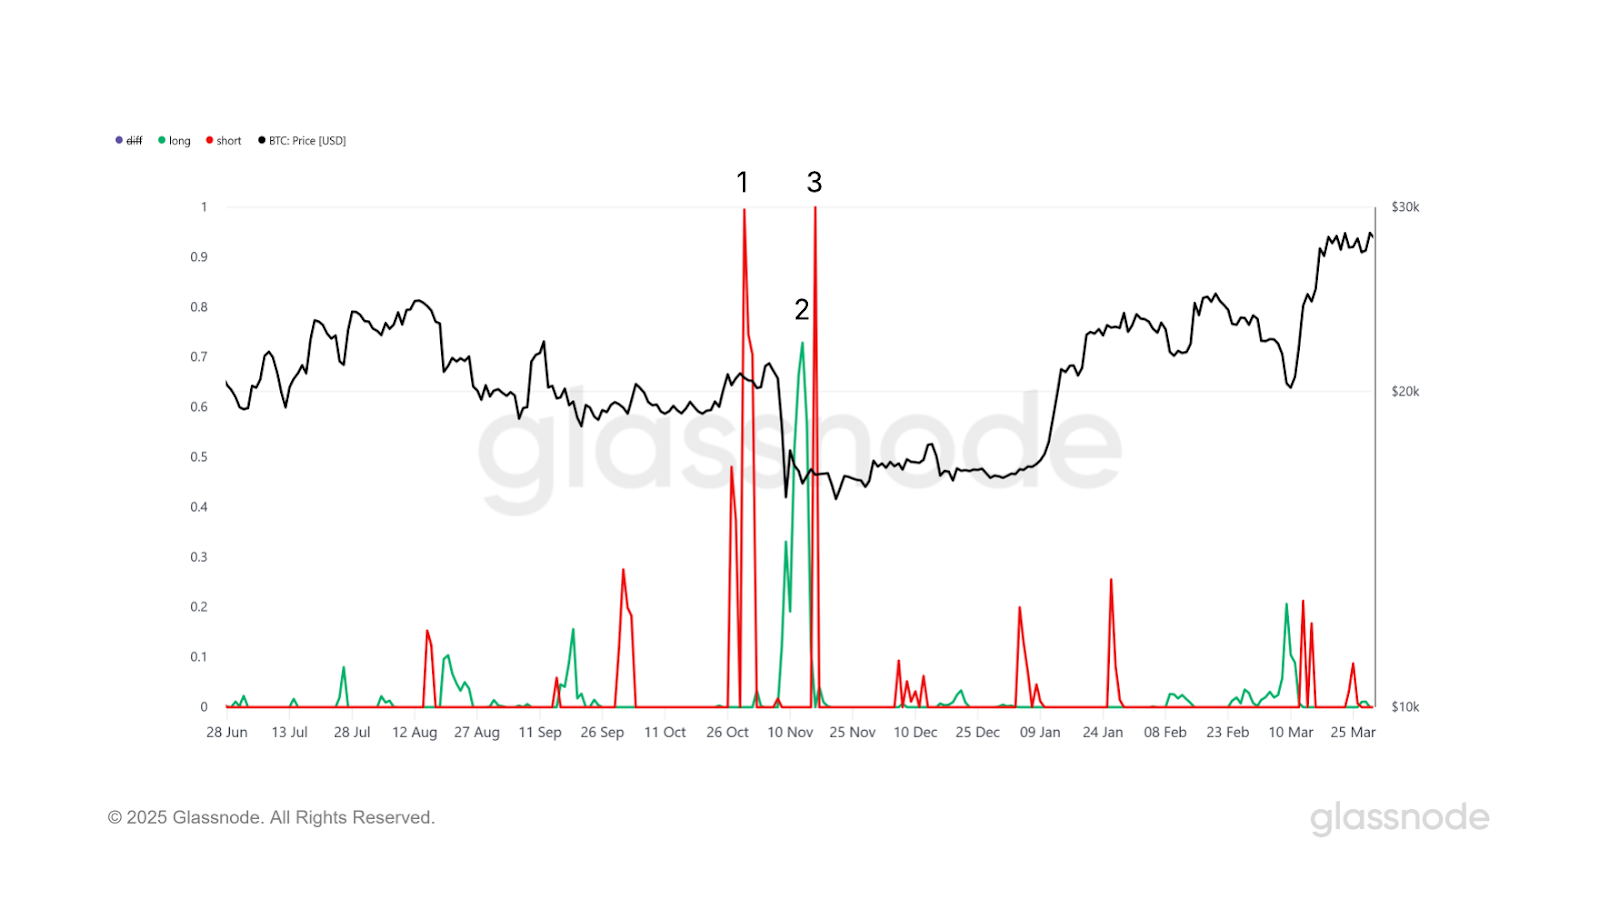
For BTC, depicted in Figure 6, the pre-crash period saw a slow upward price movement following a ranging phase, with Event 1 indicating initial short position closures. The collapse on November 5, 2022, triggered a sharp spike in long position closures (Event 2), reflecting panic-driven exits and liquidations as prices plummeted. As the market rebounded, short positions that had been opened during the downturn were squeezed, leading to their forced closures (Event 3).
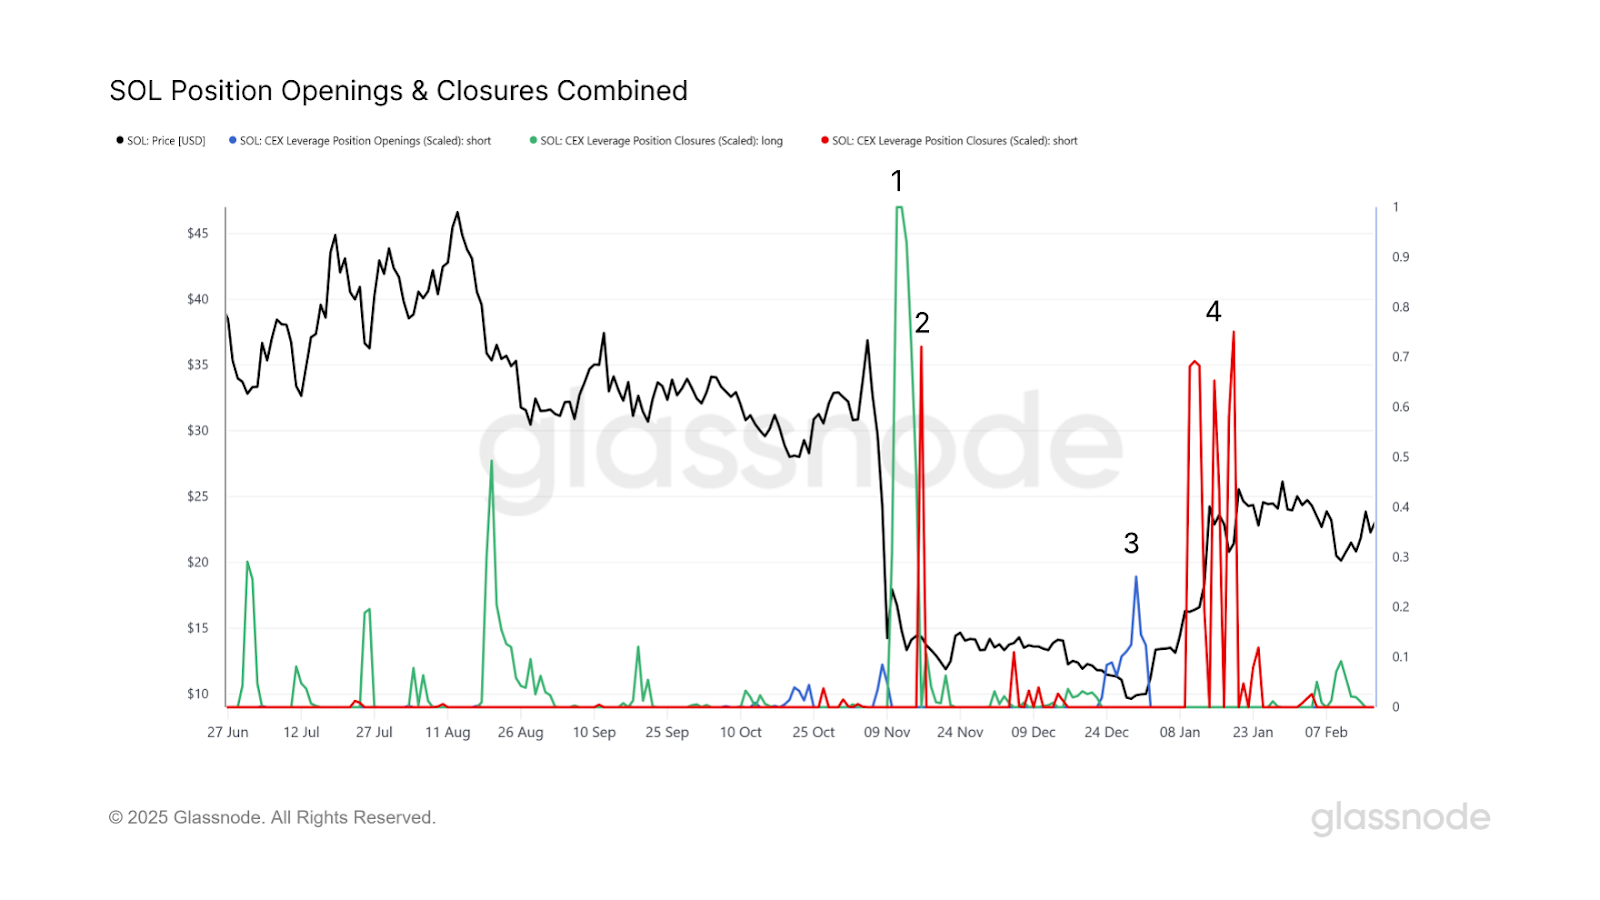
For SOL (Figure 7), LPOC metrics reveal a pronounced pattern during the same period. SOL faced a severe price drop due to the FTX collapse, with large amounts of long positions liquidated as prices fell below $10 (event 1 on the diagram). As the market recovered, short positions which had been opened during and after this downturn (not visible) were squeezed, followed by shorts opening (blue event spike 3) and then closing rapidly and repeatedly as SOL surged past $20 within days (event spike 4).
The clear squeeze cycle in SOL underscores the metric’s ability to track idiosyncratic market responses, showing how misaligned dominant positioning amplified volatility and provided insights into trader behavior under stress. This repeated short squeeze while SOL gained over 100% within around 1 month, illustrates one limitation of the LPOC: it can only classify a single predominant pattern of positioning at any one time.
This recurring mis-positioning, where on average, the market builds exposure in the wrong direction, underscores the LPOC tool’s value in decoding market narratives and identifying opportunities where leverage dynamics create inefficiencies.
Cross-Asset Perspective: Market-Wide Leverage Flushes
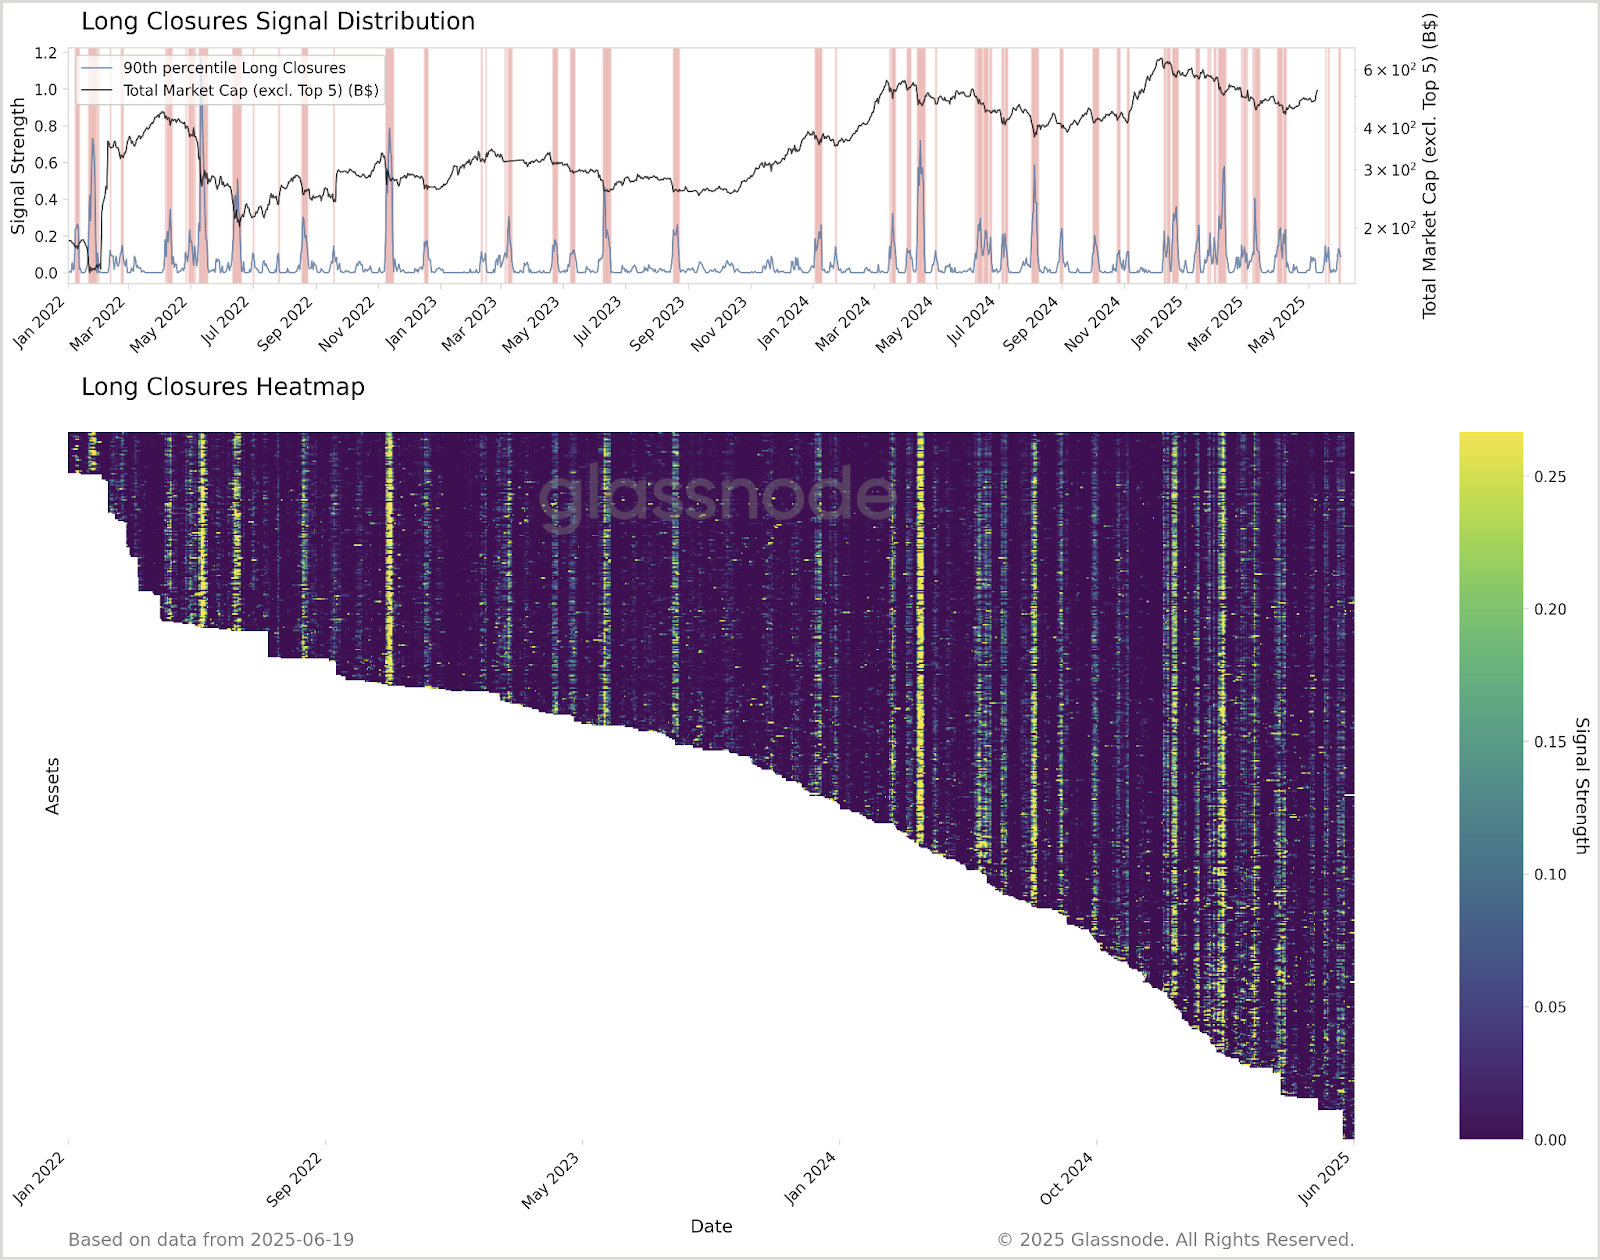
Extending the LPOC analysis across hundreds of crypto tokens, the third image (Figure 8) presents a heatmap alongside the 95th percentile of leverage ratios. This visualization underscores a striking pattern: long closures tend to co-occur across assets during systemic deleveraging events, such as May 2021 and November 2022.
These synchronized spikes signal mass deleveraging, often coinciding with local market-wide minima and a return to a less frothy market state. The coherence of long closures across assets highlights their role as a leading indicator of market-wide stress and recovery.
Deleveraging events serve as a healthy market mechanism by shedding excess leverage, though they also introduce inefficiencies due to panic-driven closures that exaggerate downward price movements. This regularity in crypto markets positions them as potential entry points or offering opportunities for traders.
Practical Applications
The LPOC metrics provide several actionable insights:
- Bottom Fishing: Elevated long closure signals often signal high-probability entry points post-capitulation
- Top Risk Management: Massive spikes in long openings indicate over-eager longs, suggesting potential risk going forward
- Short Squeeze Detection: Rising short openings followed by short closures may precede squeeze-driven rallies
- Market Health Monitoring: Cross-asset views highlight systemic leverage trends, supporting portfolio risk assessment
Considerations and Future Enhancements
- Temporal Resolution Limitations: LPOC metrics excel for observing multi-week/month positioning but lag in capturing intraday/intra-week shifts. Future versions could be designed to provide a higher-resolution view of market positioning.
- Winner-Takes-All Classification: LPOC identifies one dominant signal, missing concurrent positioning behaviors in volatile markets. Future iterations could calculate probabilities for all position types, offering a more nuanced view into competing positioning.
- Integration with Complementary Metrics: LPOC could be enriched by combining with exchange flow data or social media sentiment to distinguish liquidation-driven closures from profit-taking and detect market manipulation. Hybrid models would enhance accuracy.
Conclusion
The Leverage Position Openings and Closures metric offers a valuable tool for interpreting leverage dynamics in crypto markets. By examining the alignment of price and open interest, it provides a real-time, asset-agnostic perspective on trader positioning under varying conditions. Compared to liquidation feeds and funding rates, LPOC offers a more comprehensive and timely insight, aiding in the identification of tops, bottoms, squeezes, and systemic shifts.
- Leverage Position Opening
- Leverage Position Closures
- Leverage Position Openings Scaled
- Leverage Position Closures Scaled