Bitcoin is entering a critical consolidation phase after weeks of strong buying pressure pushed the price to a new all-time high near $112,000. Despite the bullish momentum seen in recent months, the leading cryptocurrency is now struggling to maintain upward traction. As macroeconomic uncertainty and rising global tensions—particularly trade conflicts between the US and China—continue to rattle financial markets, Bitcoin appears to be waiting for its next catalyst.
Currently trading just above the $105,000 level, BTC is showing signs of exhaustion. According to fresh data from CryptoQuant, the Average Directional Index (ADX), which measures trend strength, has dropped to its lowest reading in over a month on the hourly timeframe. This decline in ADX suggests that the current bullish trend may be losing momentum, and a period of sideways movement or a deeper correction could follow.
Market participants are now closely watching support levels and key indicators for signs of the next move. A breakdown from current levels could trigger increased volatility, while a strong bounce backed by volume might reignite the bullish momentum. For now, the market remains on edge, with Bitcoin caught between macro-driven headwinds and hopes for a broader risk-on recovery.
Bitcoin Holds Steady Above $105K as Trend Strength Weakens
Amid rising global tensions and persistent macroeconomic uncertainty, Bitcoin continues to demonstrate resilience, holding firmly above the $105,000 level. While many risk assets have shown weakness, BTC remains relatively strong, benefiting from its status as a hedge in times of systemic stress. However, it now faces a pivotal test: can it gather enough momentum to retest and break above its all-time high near $112,000?
Bitcoin is currently trading at a critical demand zone, but upward momentum appears to be stalling. Analysts are increasingly divided in their outlook, with some warning of a possible correction while others point to signs that the bull market remains intact. One major driver of market uncertainty is the bond market, where yields have surged and volatility has returned. This has created new dynamics for institutional flows and broader risk appetite across global markets.
Top analyst Axel Adler shared technical insights indicating that the strength of Bitcoin’s current trend is fading. According to his analysis, the Average Directional Index (ADX) on the hourly chart has fallen to its lowest level in over a month. Additionally, the Signal Line—often used to confirm momentum—has dipped below the 20% zone, suggesting limited strength behind recent moves.
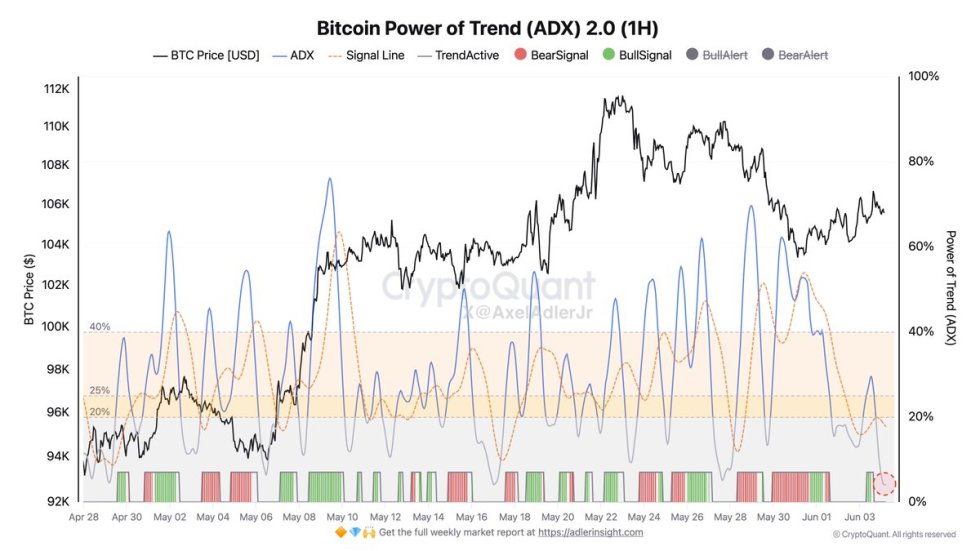
Despite this, the setup is not entirely bearish. Adler notes that if bulls step in with strong volume and conviction, the market could see a renewed surge to challenge the all-time high. With Bitcoin holding a structurally bullish posture above key moving averages, the next few days will be critical in determining whether this consolidation will evolve into another breakout or give way to deeper retracement. For now, all eyes remain on trend strength and global catalysts that could shape BTC’s next major move.
BTC Tests Support at $103.6K As Bulls Attempt Recovery
Bitcoin is holding just above $105,000 after a volatile retrace from the $112,000 all-time high. The chart shows BTC consolidating in a tight range between $103,600 and $109,300, forming a critical decision zone. Price action has remained stable above the 34-day EMA ($103,274) and the 50-day SMA ($99,911), signaling that bulls are still in control despite short-term weakness.
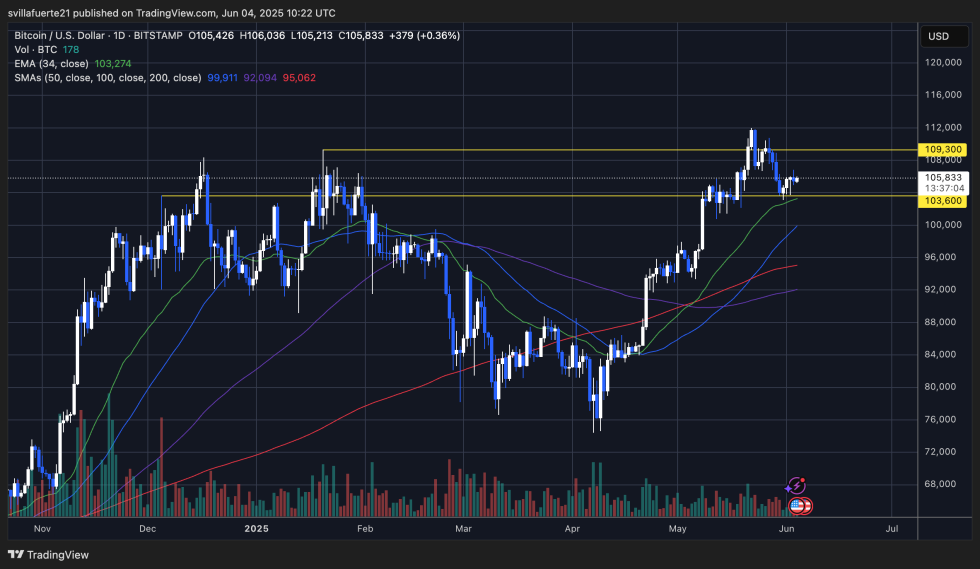
The key support level at $103,600 has been tested multiple times since early June and continues to act as a strong demand zone. If this level fails, BTC could revisit the $100,000 psychological mark or drop further toward the 100-day SMA around $92,094. However, as long as Bitcoin holds above this support, there’s room for a potential rebound.
To the upside, BTC must reclaim the $109,300 resistance zone, which has capped multiple attempts in recent weeks. A successful breakout above that level would open the door for a retest of the ATH and possibly higher price discovery. Volume remains moderate, suggesting traders are cautious while awaiting macroeconomic clarity and further technical confirmation.
Featured image from Dall-E, chart from TradingView

Related Posts


















![随着TVL达到22亿美元,Maple Finance [SYRUP] 的涨势能否延续?这些指标表明……](https://d1x7dwosqaosdj.cloudfront.net/images/2026-07/4e3b0433345c4ea8a9dd04a53e363624.jpg)