Executive Summary
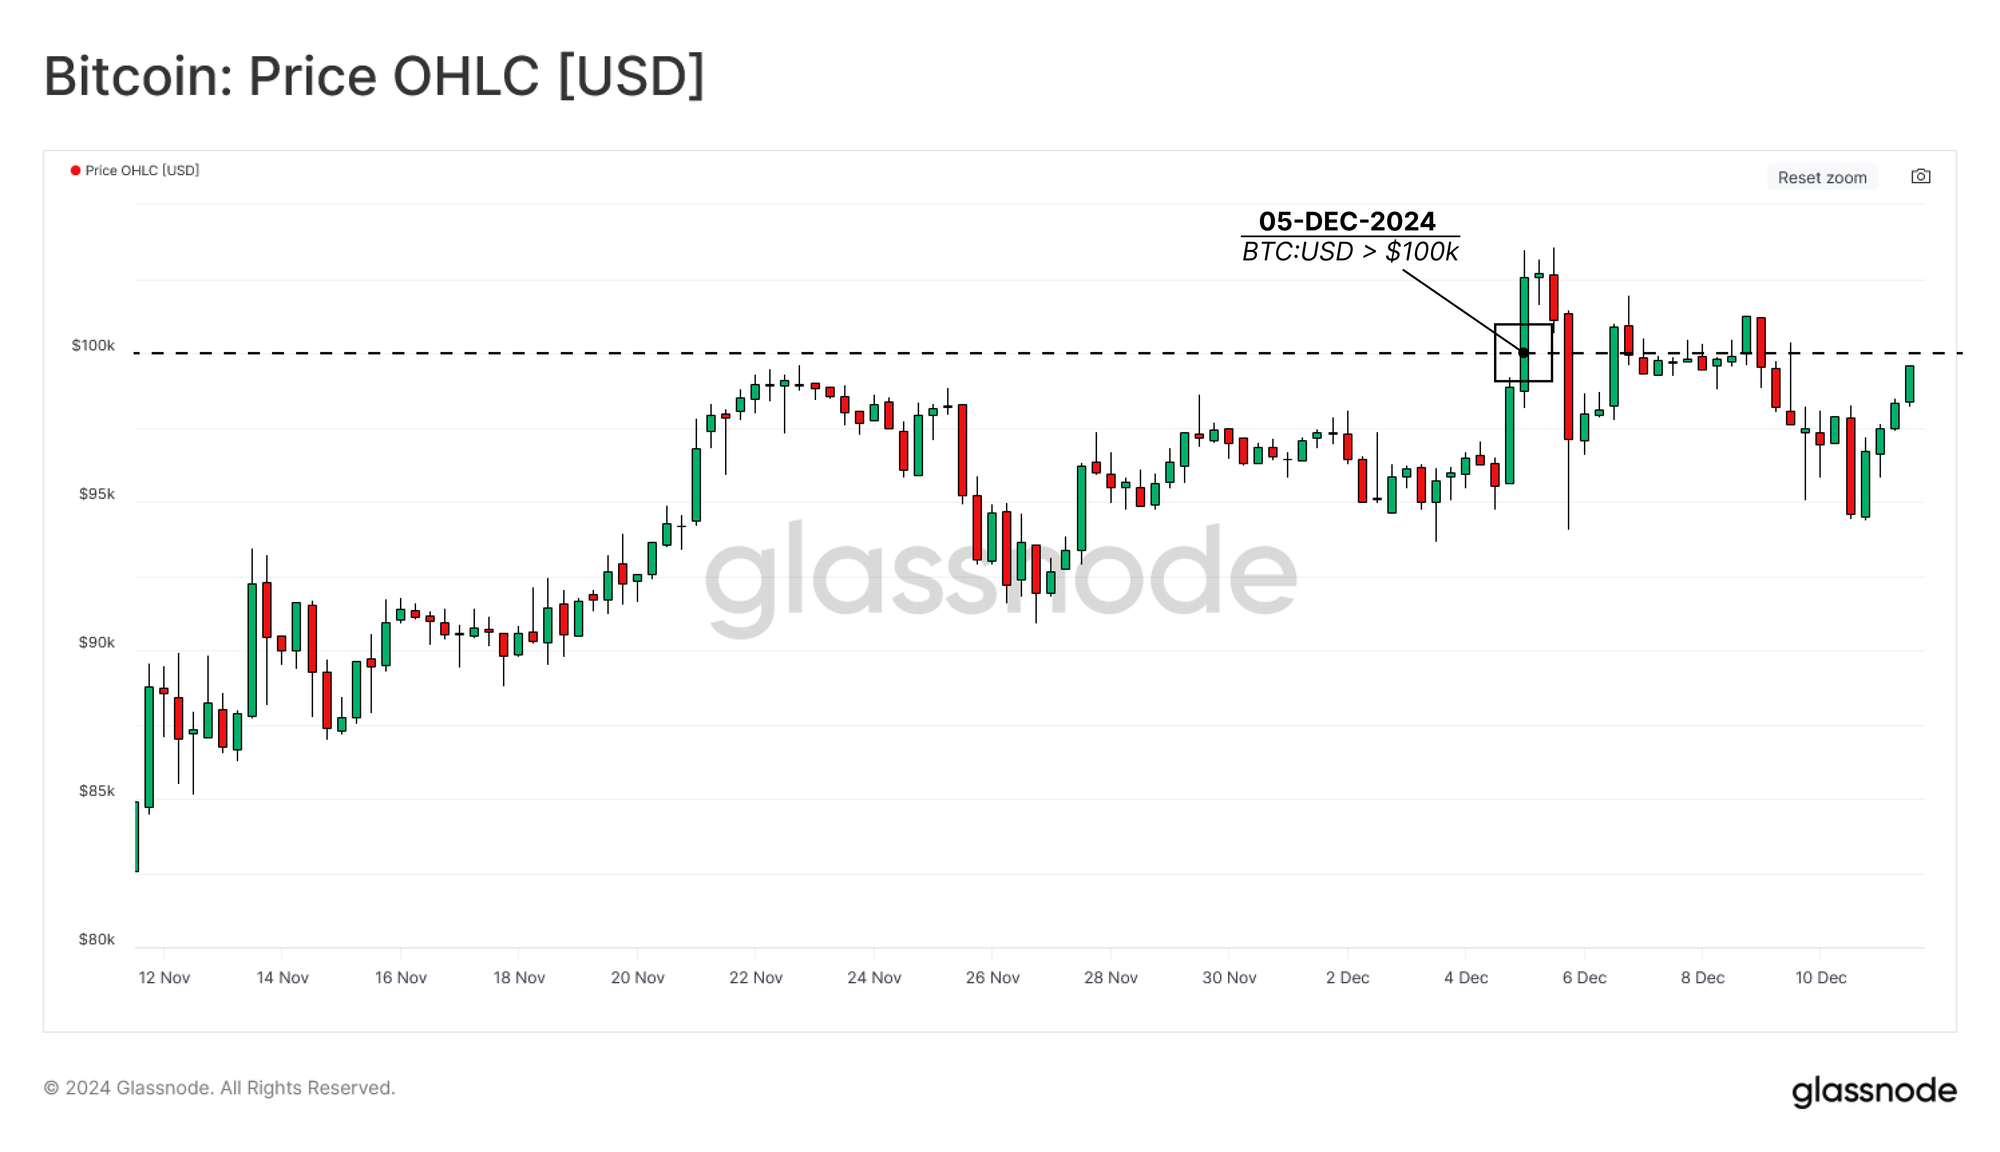
- The Bitcoin price crossed the $100k mark for the first time on 5 December, after 5,256 trading days, and hitting a market cap briefly exceeding $2 Trillion.
- Miners have earned a cumulative $71.49 Billion since inception, reflecting the network's robust security and economic incentives.
- The network has processed a total of 1.12 Billion transactions and settled $131.25 Trillion in transfer volume, with entity-adjusted figures providing an even clearer view of genuine economic activity.
- A breakdown of supply held by various cohorts highlights a broad distribution of Bitcoin ownership, ranging from retail investors to institutional-scale holders.
This week's newsletter examines Bitcoin's remarkable journey from its Genesis Block to surpassing the $100,000 mark per BTC. On December 5th, Bitcoin reached this monumental milestone for the first time, taking three days to achieve a daily candle close above $100k.
This report explores the evolution of the Bitcoin network and its economic foundations, tracing the incredible path from zero to this groundbreaking achievement.
Market Expansion
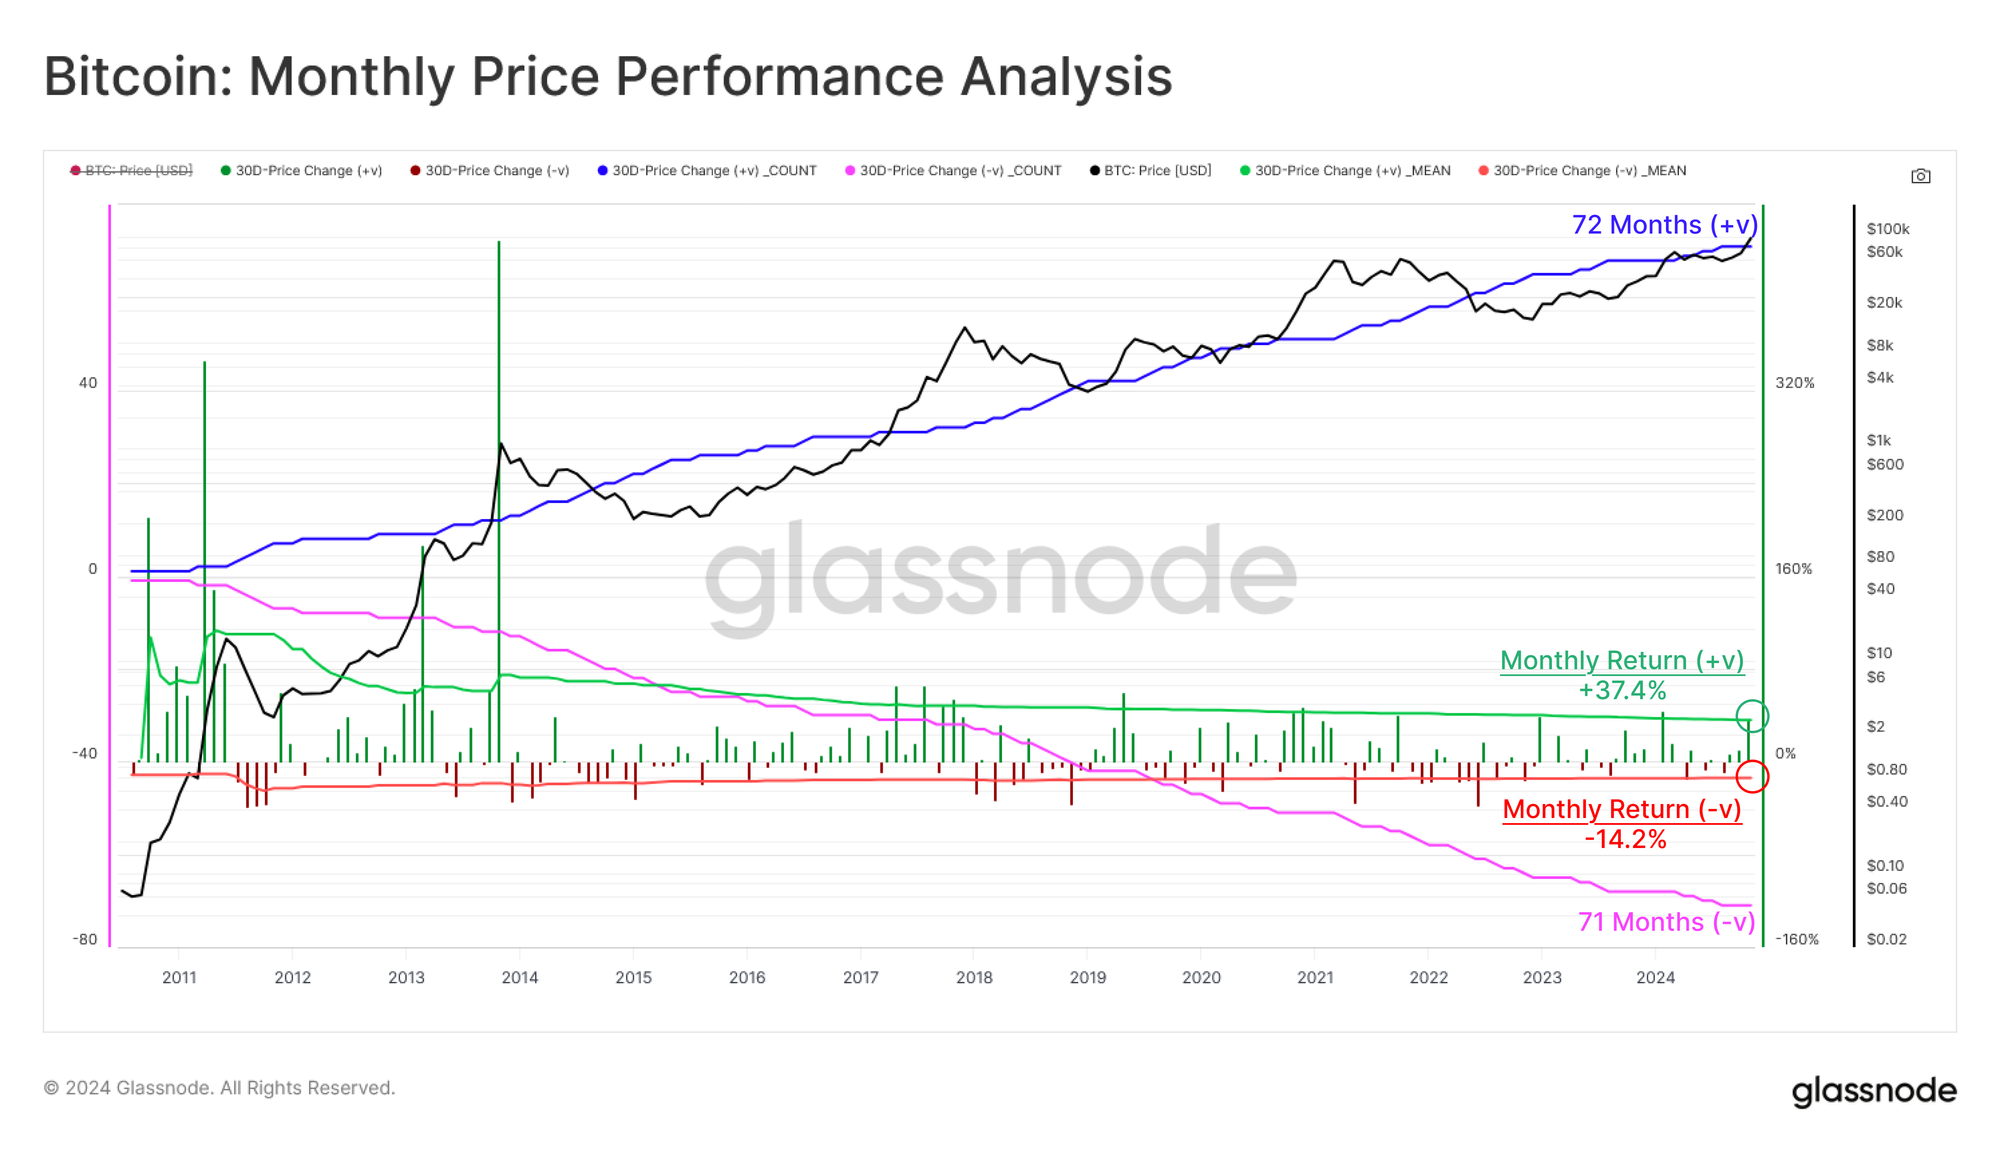
Bitcoin has had an actively traded price for 5,256 days and has travelled from fractions of a cent to $100k. This journey has included 72 positive monthly candles (including December 2024), with an average gain of 37.4%, and 71 negative monthly candles, averaging a decline of -14.2%.
This reflects the fascinating balance between bull and bear markets and the infamous positive skew during the most consequential periods of price appreciation.
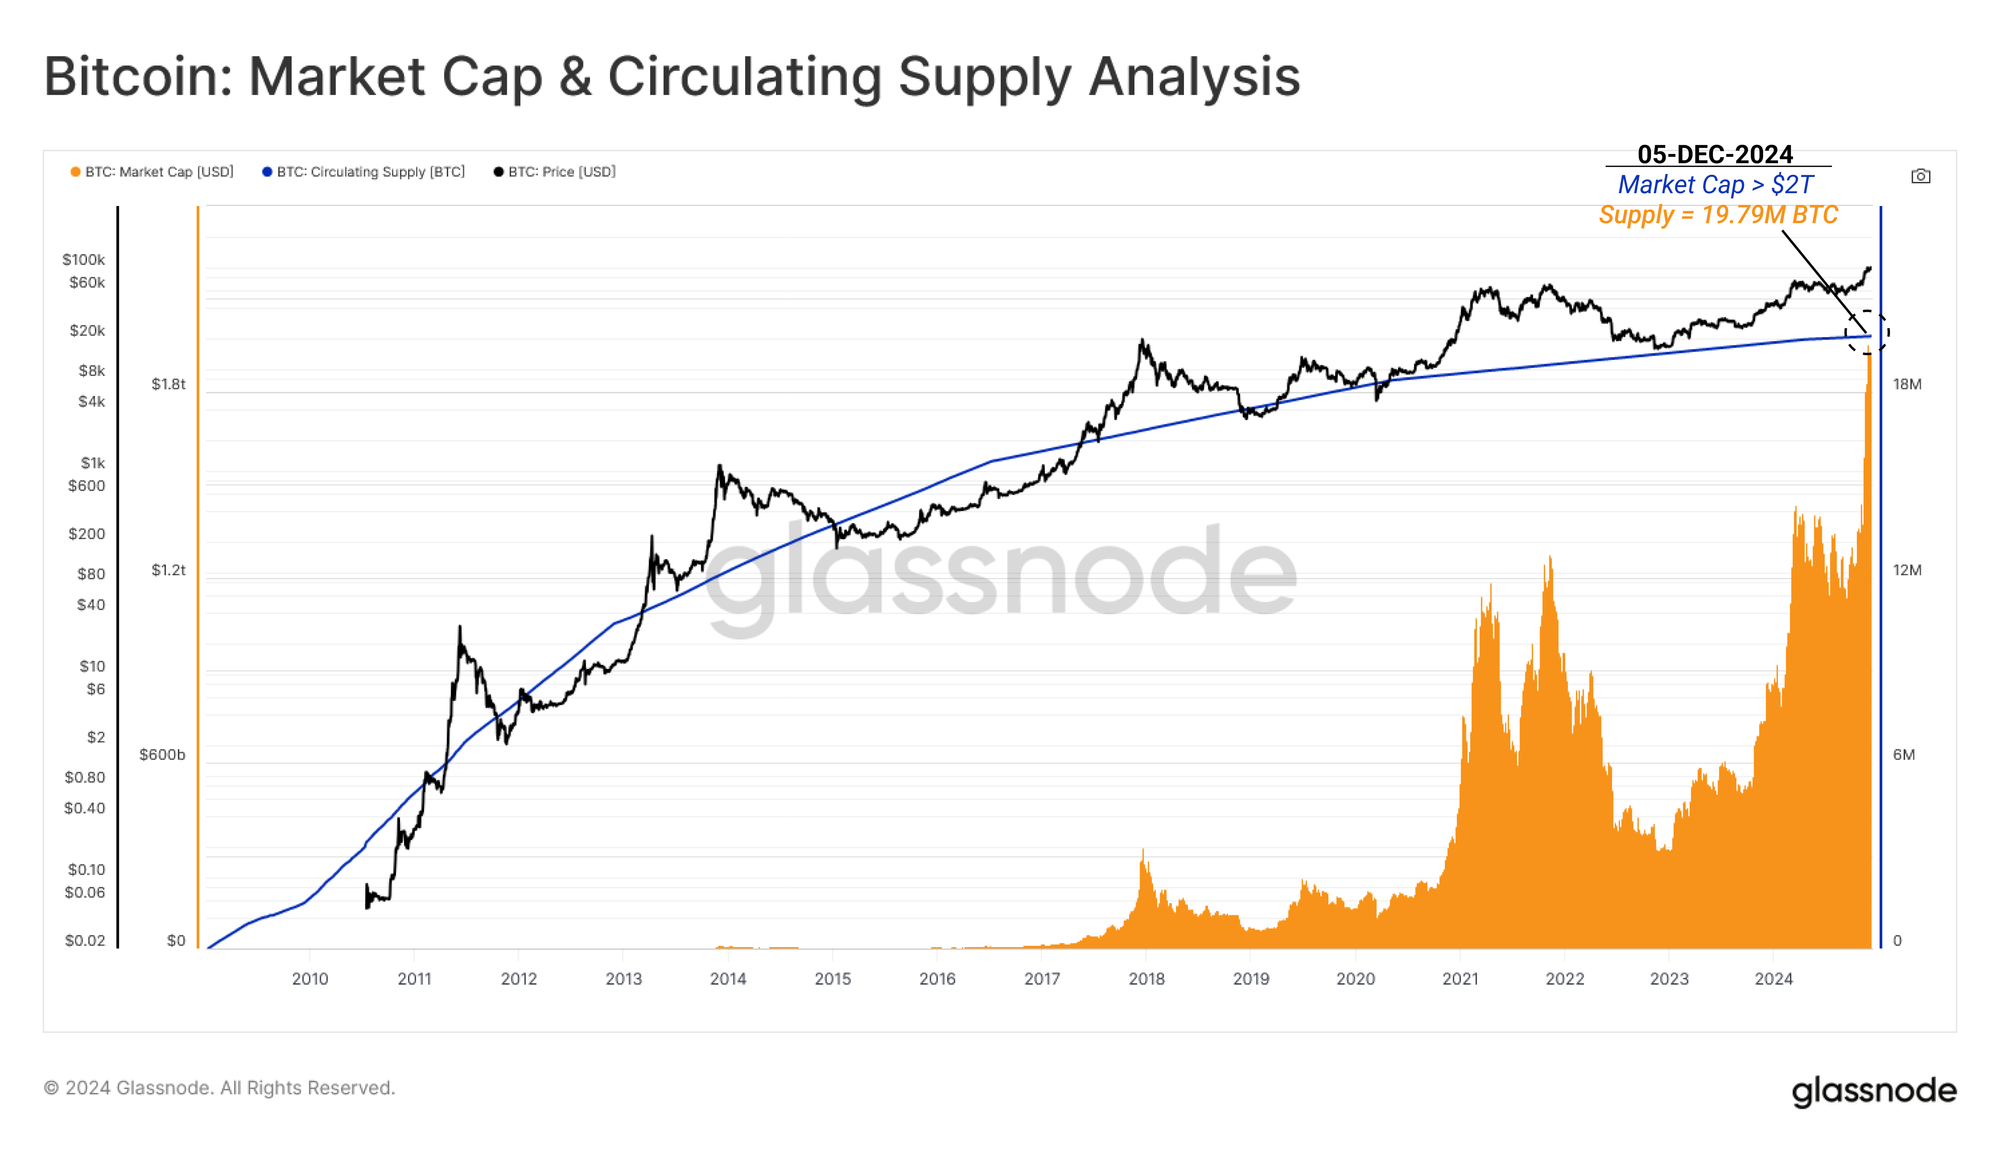
As of 5 December, a total of 19,791,952 BTC have been mined, representing 94.2% of the ultimate 21 million supply cap. The Bitcoin market capitalization also briefly traded above $2.0 trillion and has convincingly flipped the reported market cap of the precious metal Silver (~$1.84T).
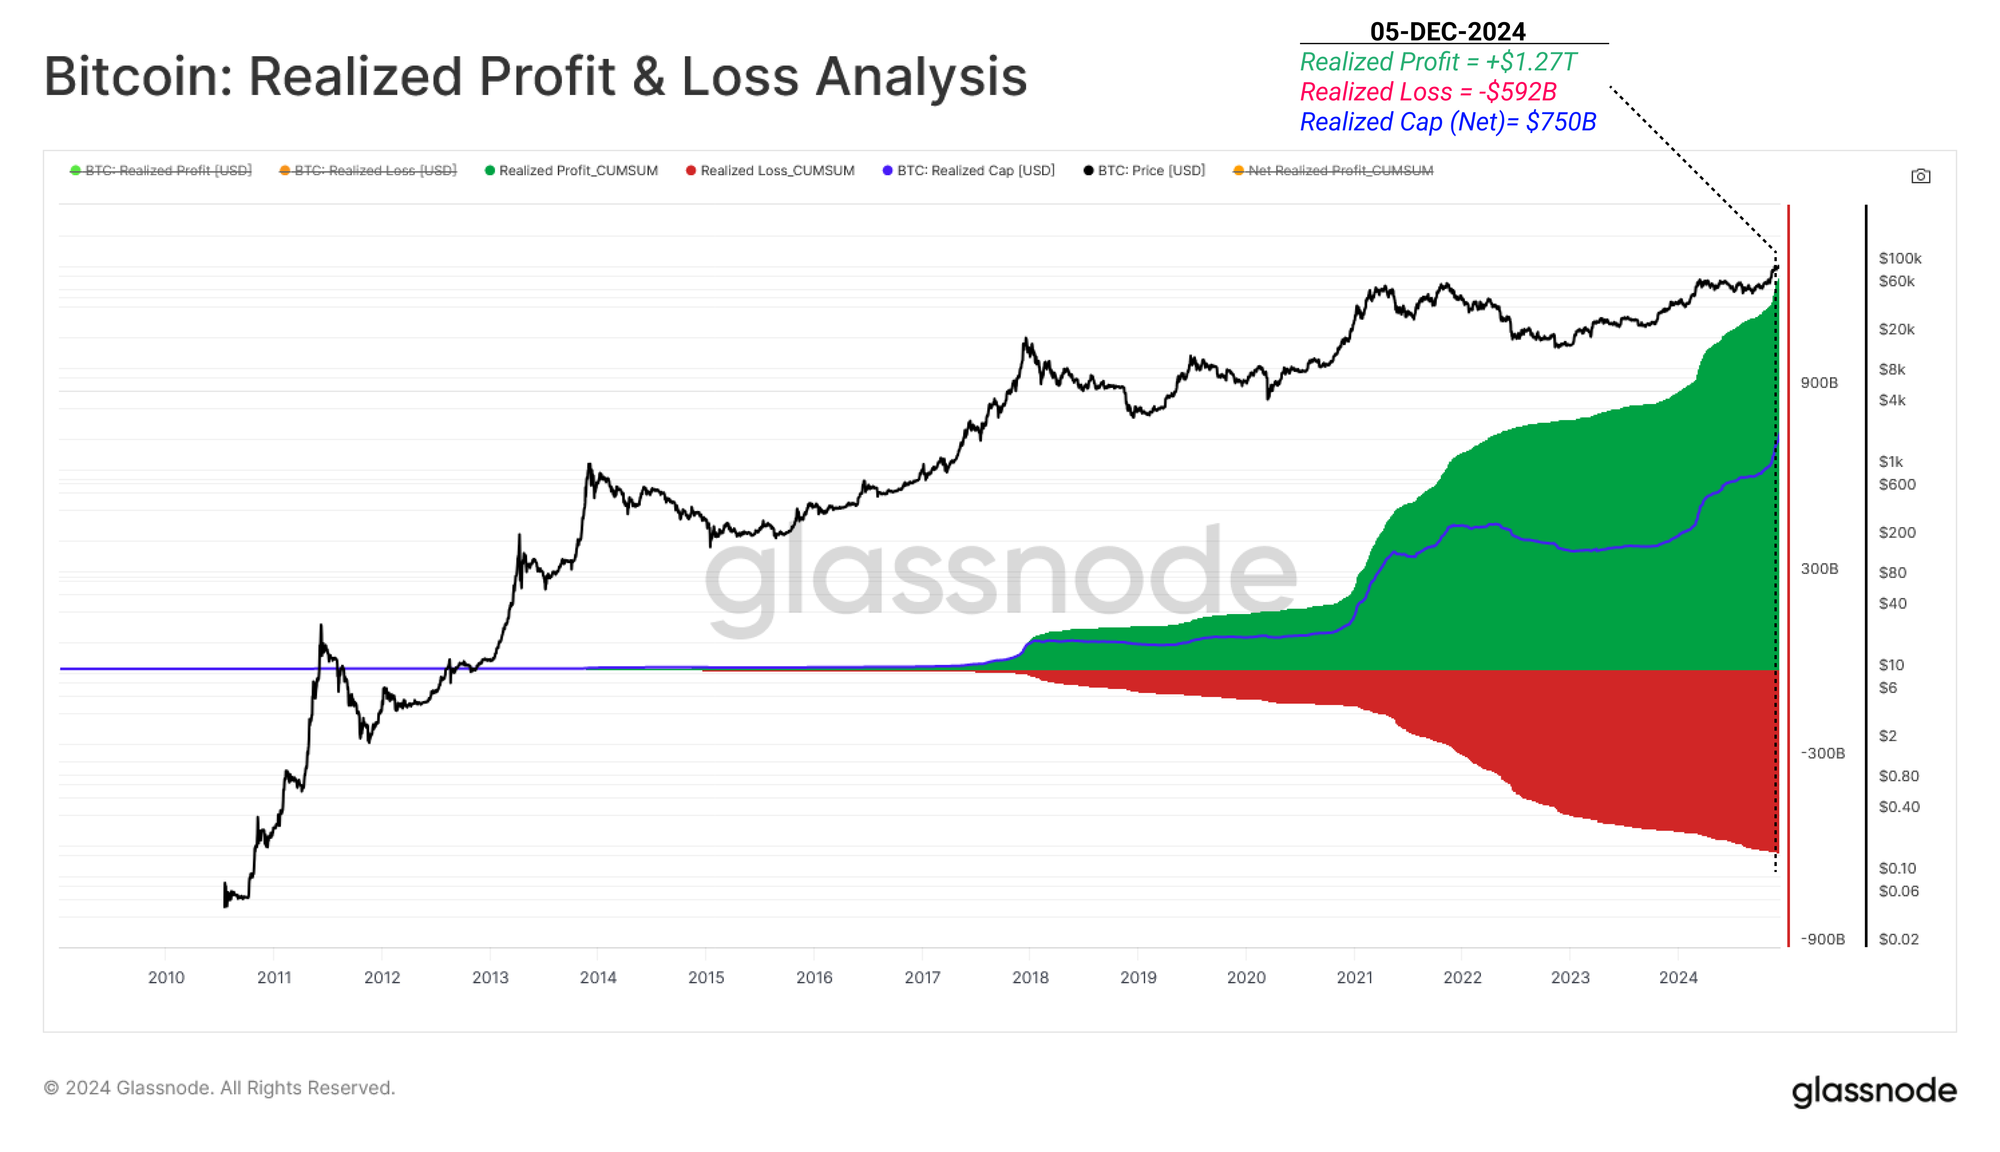
Throughout this period of extraordinary market expansion, investors have realized a total of $1.27 Trillion in profit and -$592 Billion in losses on-chain (based on the delta between acquisition and disposal prices). This resulted in a cumulative net capital inflow (Realized Cap) of $750 Billion and underscores the tremendous value which has flowed into the Bitcoin network over its lifetime.
Supply Distribution
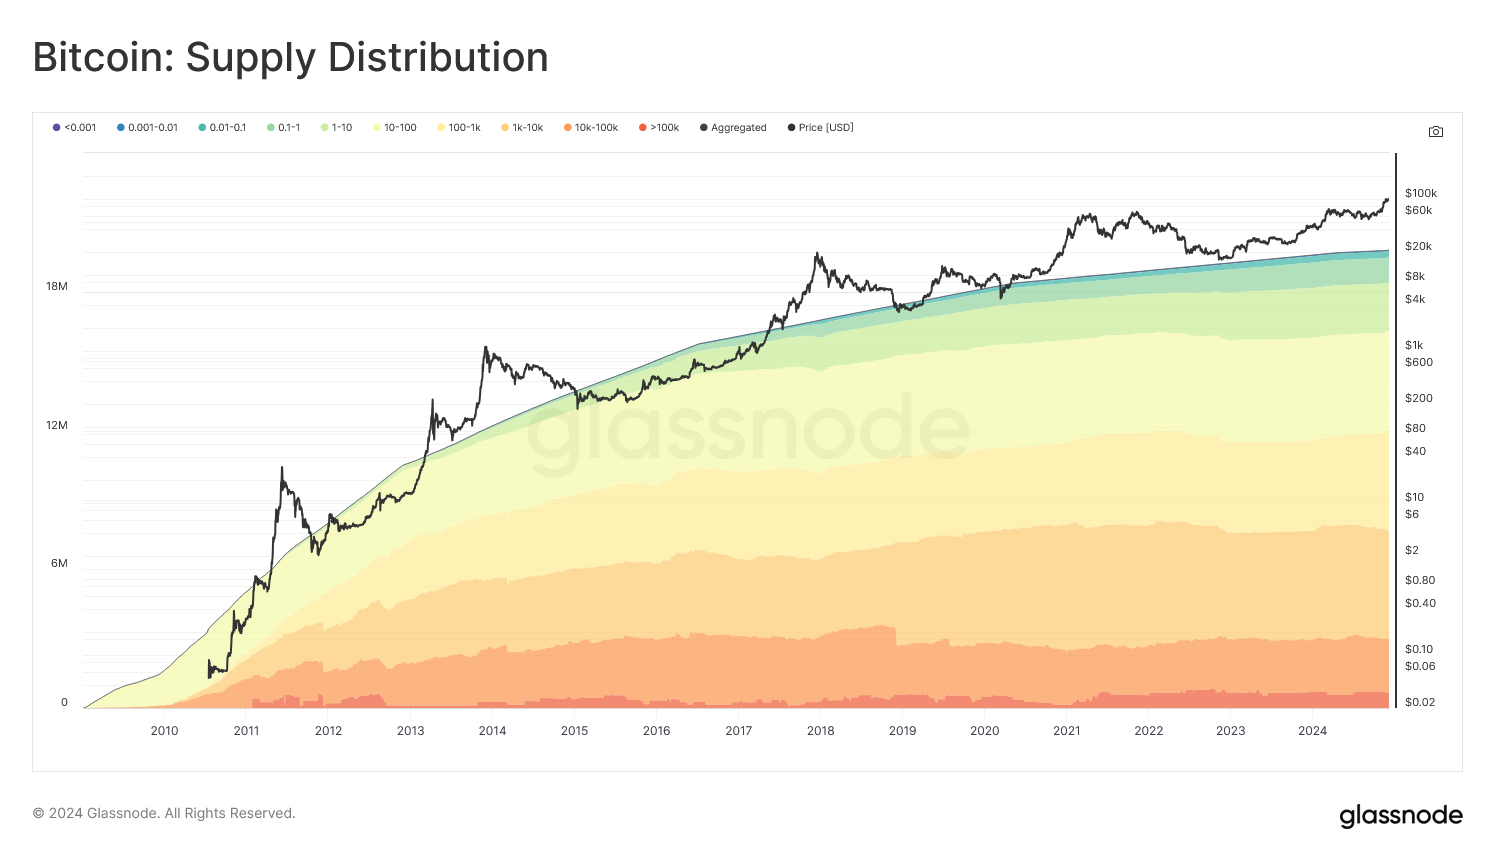
Out of the total mined Bitcoin supply, the distribution amongst different wallet size cohorts is as follows:
- <0.001 BTC: 5,491 BTC (0.027%)
- 0.001–0.01 BTC: 42,683 BTC (0.216%)
- 0.01–0.1 BTC: 271,641 BTC (1.373%)
- 0.1–1 BTC: 1,077,839 BTC (5.446%)
- 1–10 BTC: 2,093,845 BTC (10.581%)
- 10–100 BTC: 4,306,780 BTC (21.761%)
- 100–1,000 BTC: 4,342,868 BTC (21.935%)
- 1,000–10,000 BTC: 4,693,216 BTC (23.716%)
- 10,000–100,000 BTC: 2,309,654 BTC (11.671%)
- >100,000 BTC: 647,934 BTC (3.274%)
Of note is that a majority of these large-sized wallets (holding 1k+ BTC) are associated with exchanges, ETFs, and large institutional entities like MicroStrategy. Each of these large entities represents a collective ownership by thousands to millions of customers and shareholders.
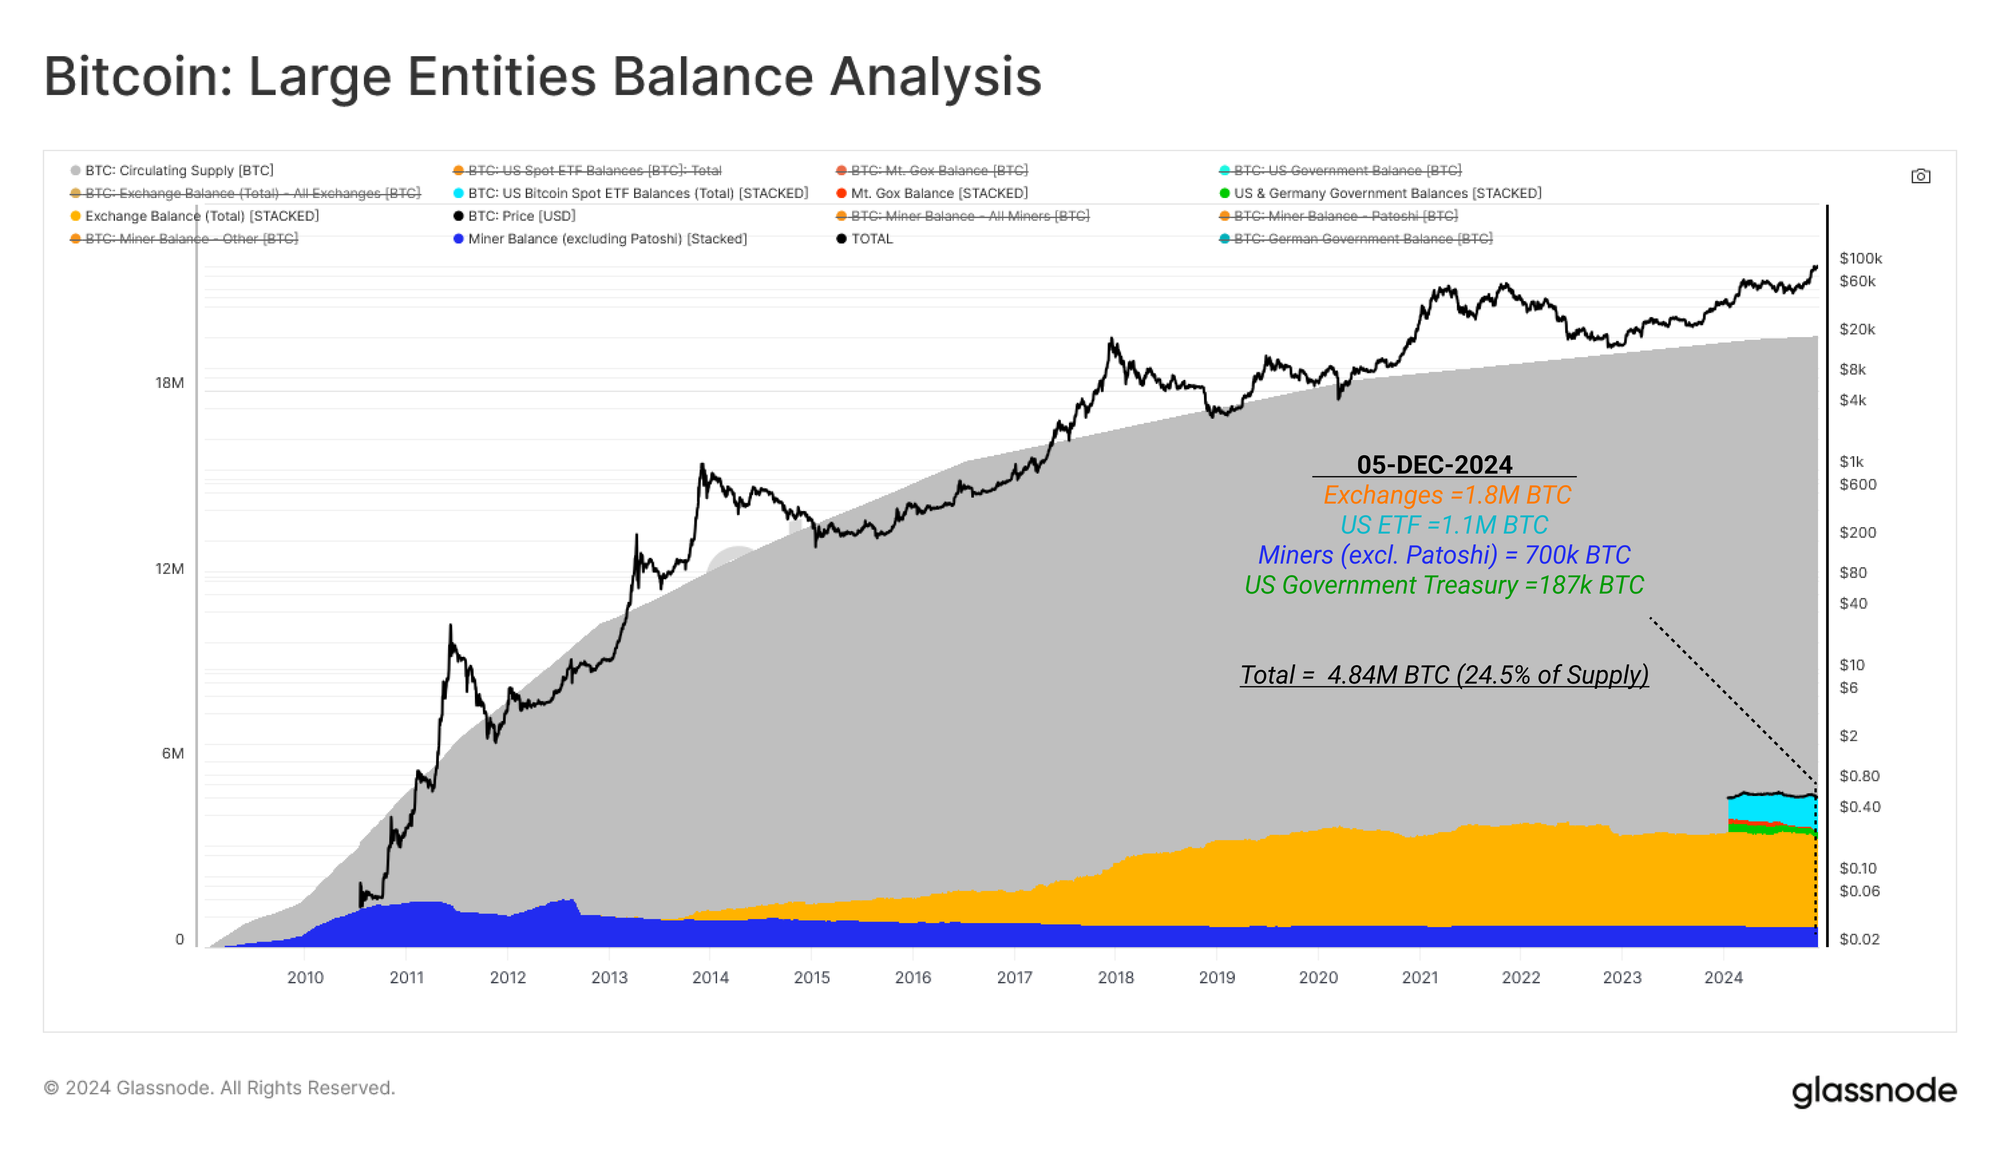
On December 05, notable aggregate balances included 1.8M BTC (9.1% of supply) held on exchanges and 1.1M BTC (5.6% of supply) managed by US-based ETFs, showcasing a significant growth rate since their launch on January 11, 2024. Additionally, miners (excluding Patoshi) retained a balance of 700k BTC (3.5% of supply), while the US Government Treasury held 187k BTC (0.9% of supply), reflecting the broad distribution of ownership across various entities.
These balances also underscore the increasing institutionalization and centralization of Bitcoin custody, balancing individual ownership with larger aggregated holdings that drive liquidity and market stability.
Network Evolution
Next, we will focus on the evolution of the Bitcoin network, tracing Bitcoin’s journey as a system for transferring financial value since its inception. We will explore the milestones, technological advancements, and adoption trends that have transformed Bitcoin from an experiment into a global financial phenomenon, paving the way to its $100k price milestone.
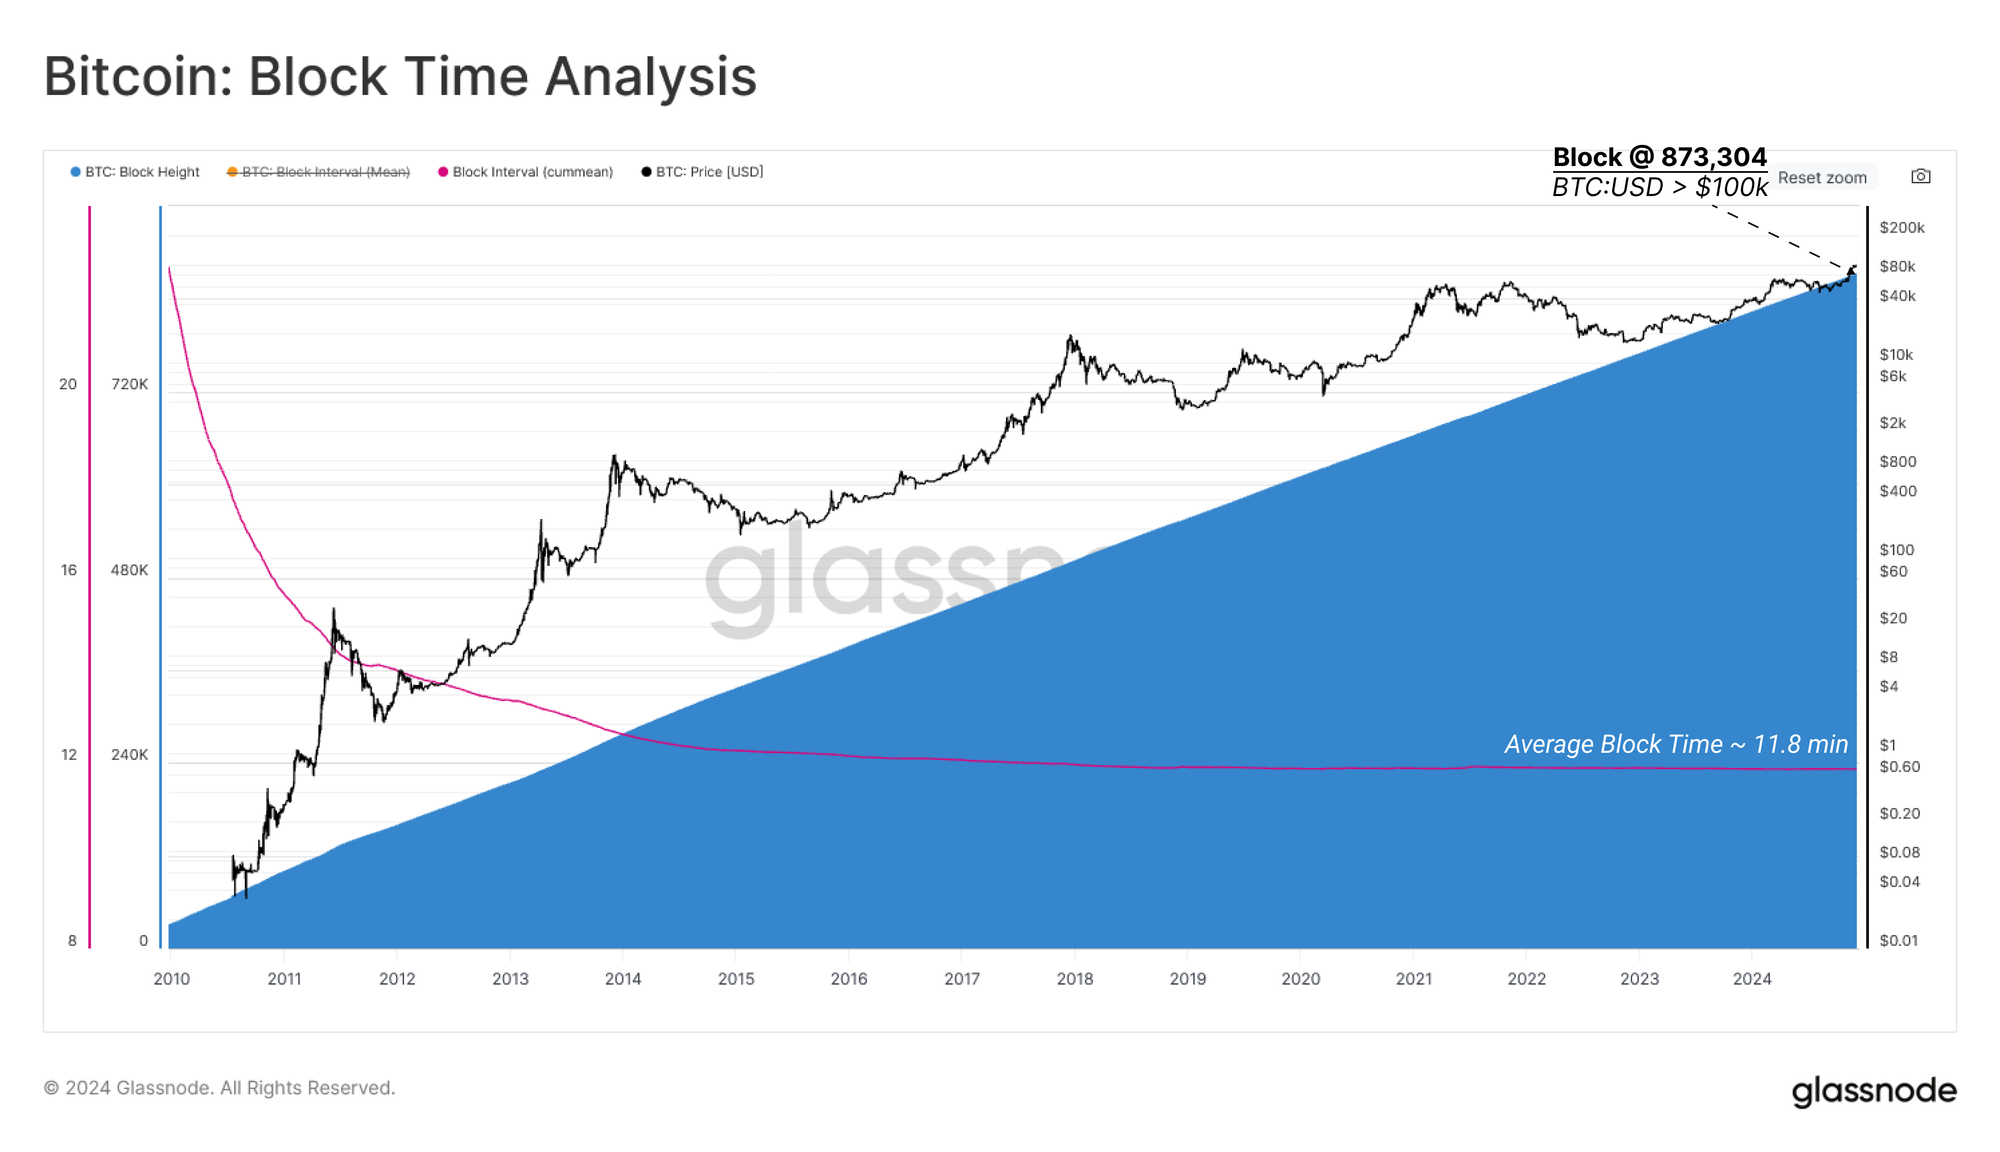
Since the Genesis Block, a total of 873,304 blocks have been mined, with an average block time of 11.8 minutes for Bitcoin to reach the historic price of $100k on December 5, 2024. Whilst the contemporary average block interval is faster at around 9.6 minutes due to hashrate increases, the early years saw a slow start, as Satoshi overestimated the power of a laptop CPU relative to the initial difficulty setting.
Over the same period, the network difficulty—measured in units that represent the computational effort required to mine a block—has increased dramatically. After 418 difficulty adjustments, excluding the periods without adjustment, network difficulty has increased to 446,331,432,498,125,300,000,000, as the security and computational power behind Bitcoin continue to grow.
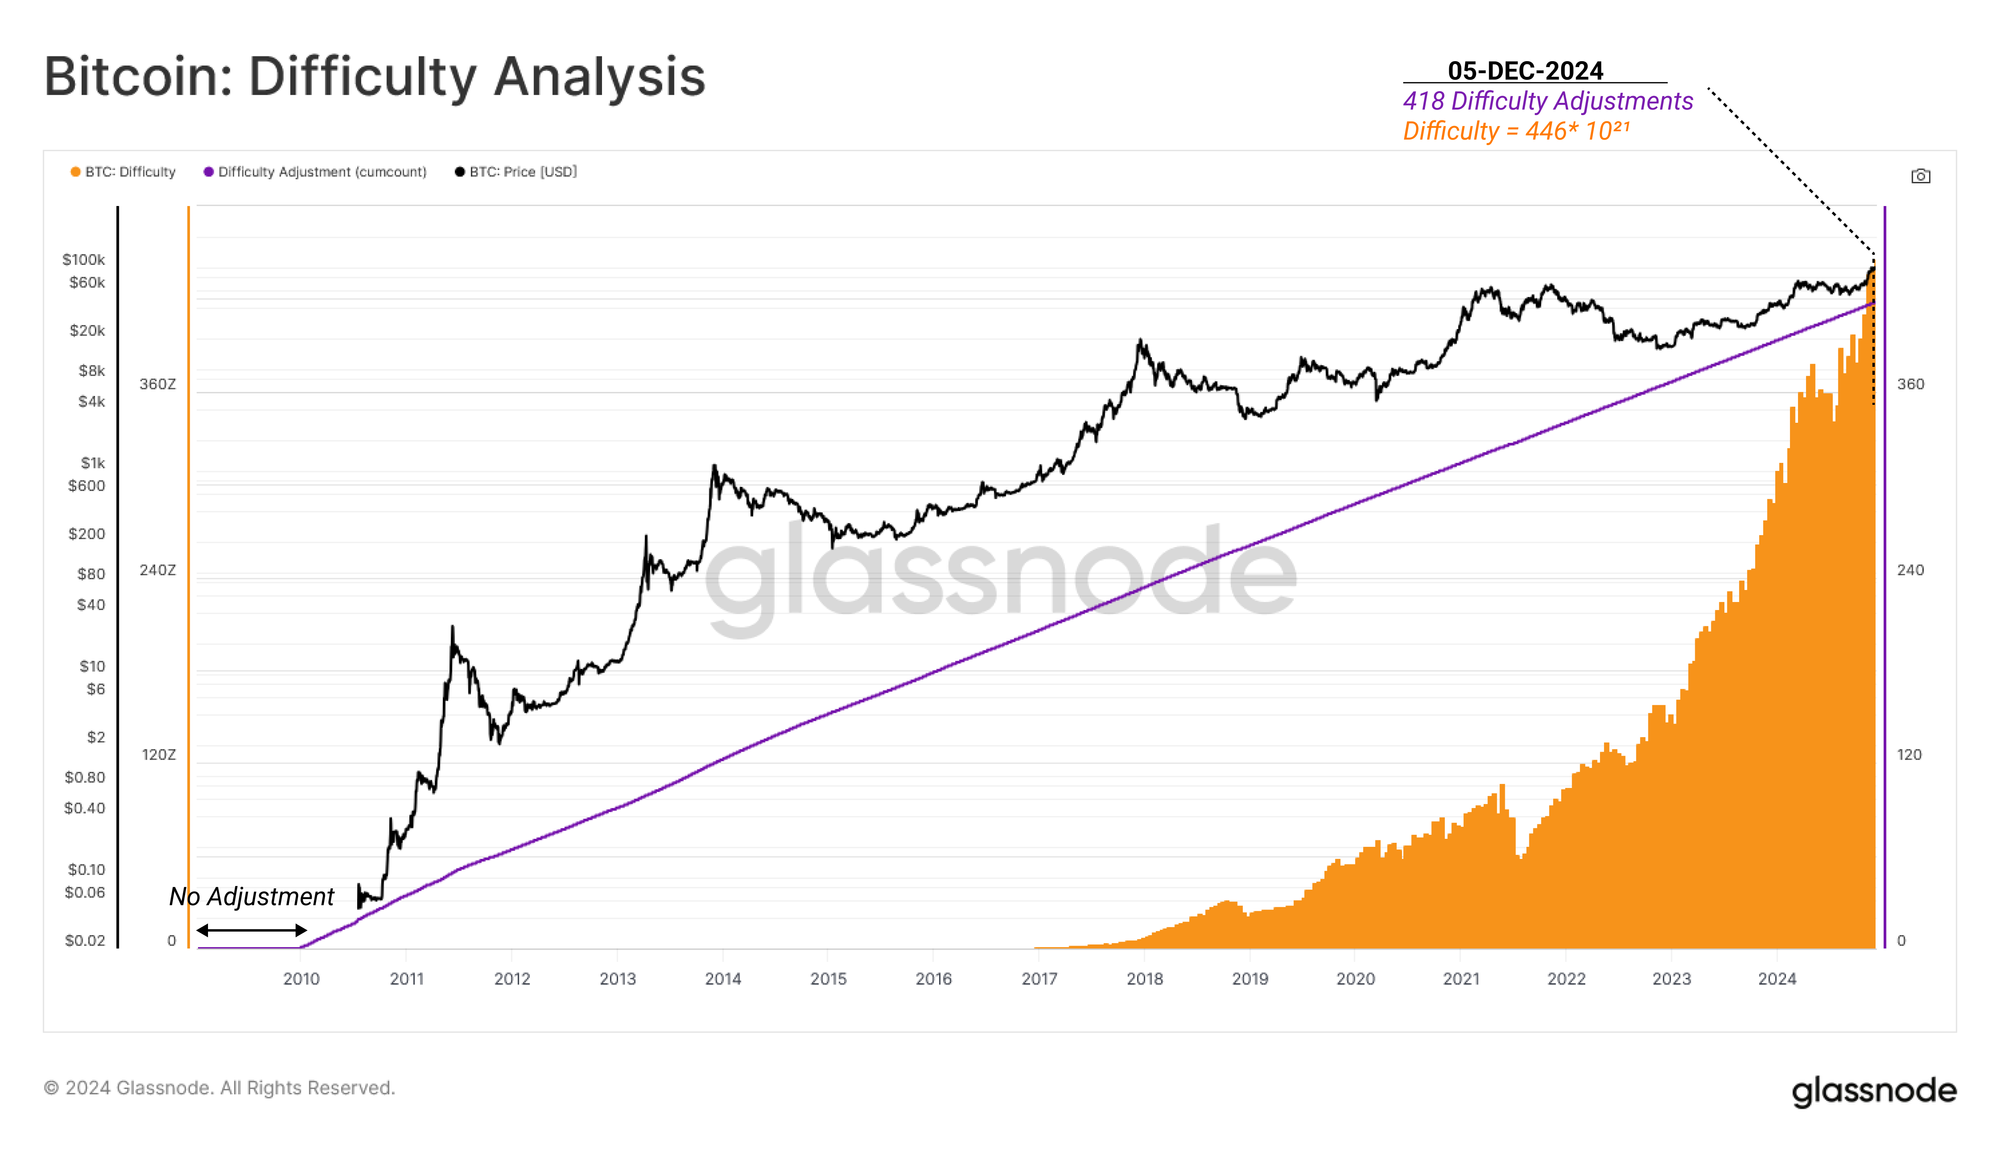
The difficulty adjustment in Bitcoin's Proof-of-Work (PoW) consensus targets a condition where blocks are mined approximately every 10 minutes, regardless of changes in network hashrate. It dynamically adjusts the mining difficulty every 2016 blocks (~2 weeks) to align with the target block time of 600 seconds.
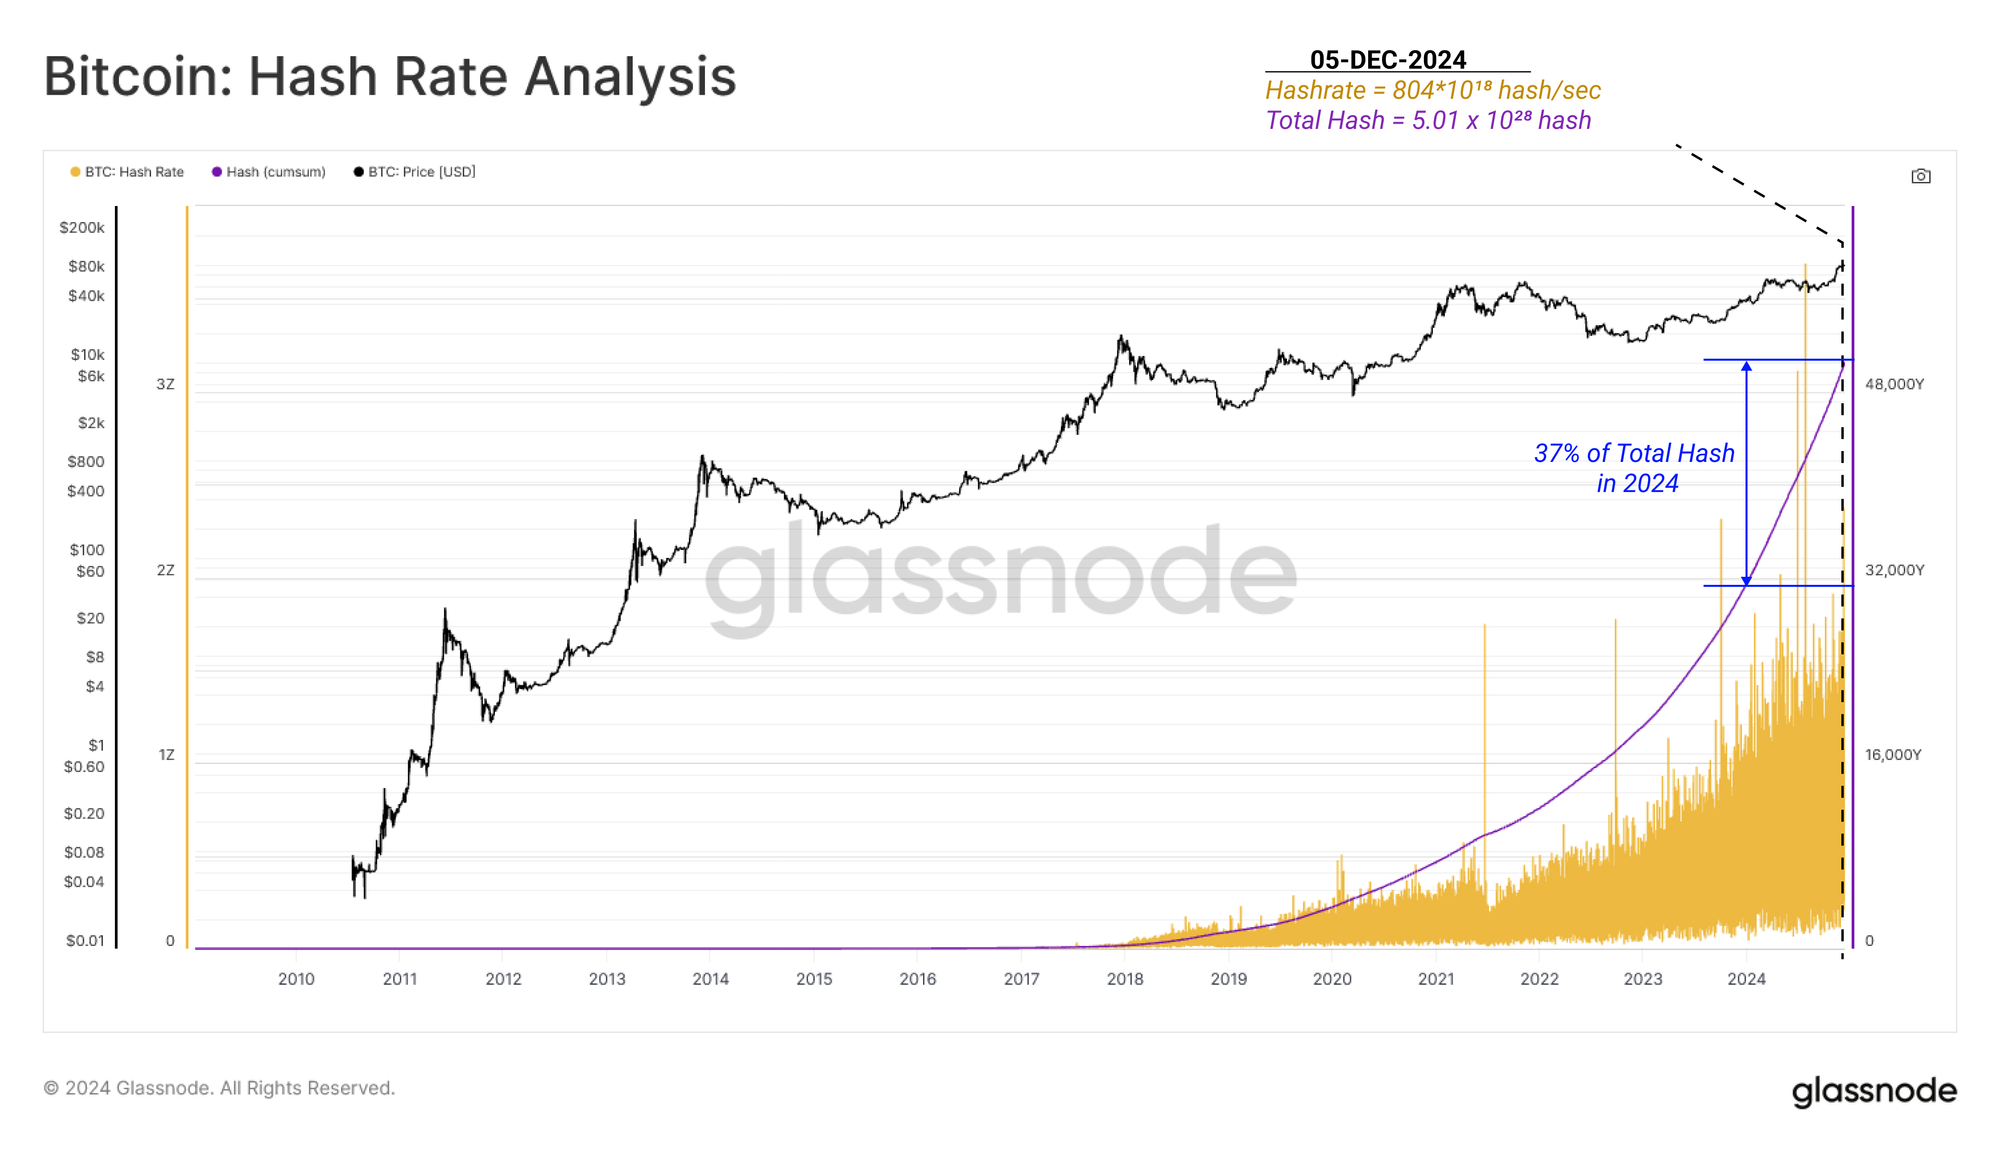
Network hashrate has surged from 128,185 hashes/sec to over 804,407,834,059,443,100,000 hashes/sec by the time Bitcoin reached $100k. Cumulatively, miners have computed approximately 5.01 x 1028 hashes to date. Remarkably, 37% of the total computed hash has occurred throughout 2024.
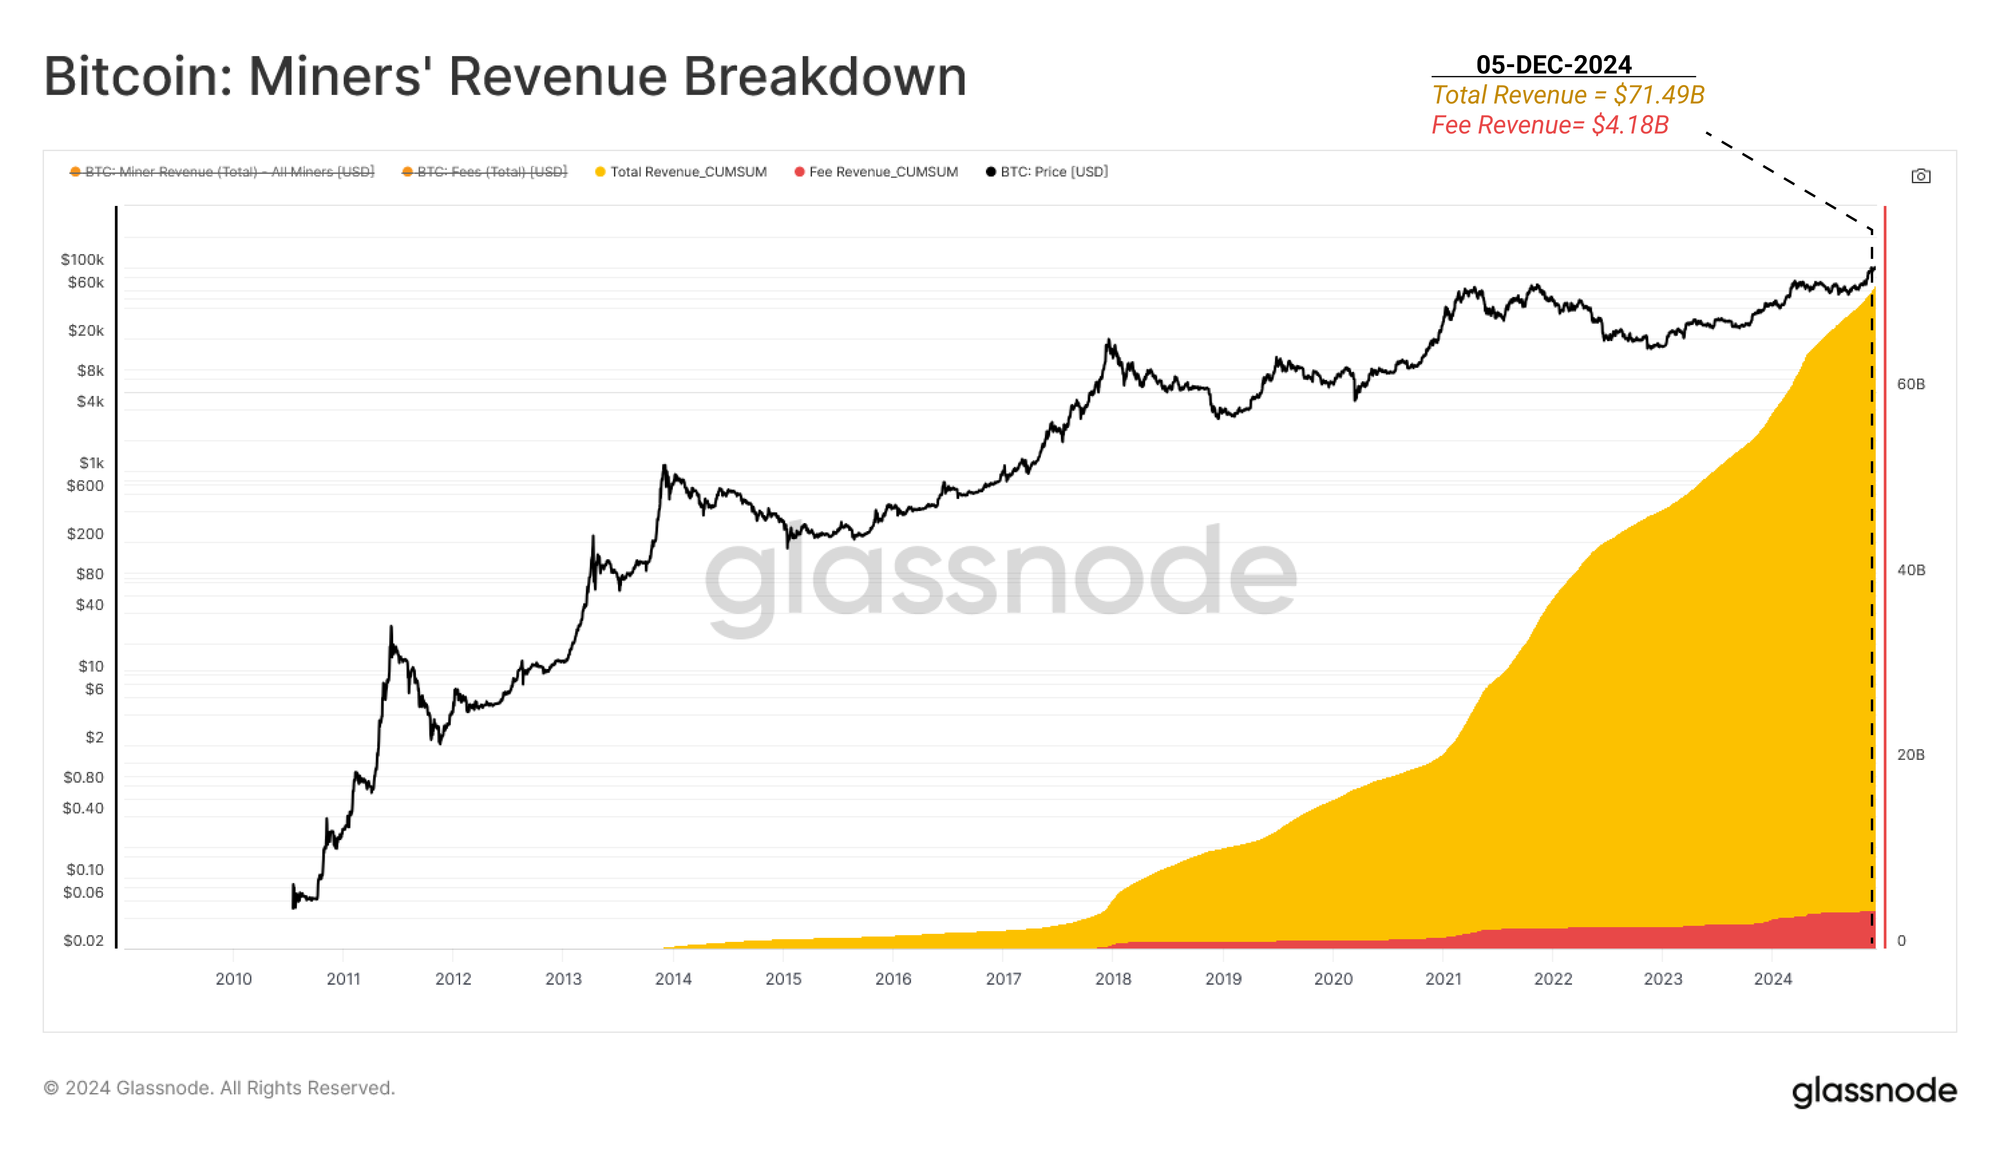
Through 5 December, miners have earned a cumulative $71.49 Billion for their computational efforts, with block rewards valued on the day the block was mined. This revenue comprises $67.31 billion in block subsidy via the minting of new coins and $4.18 billion in transaction fees paid by users. This represents just 3.57% of Bitcoin's $2 Trillion market cap peak, arguably reflecting a tremendous return on the input security budget.
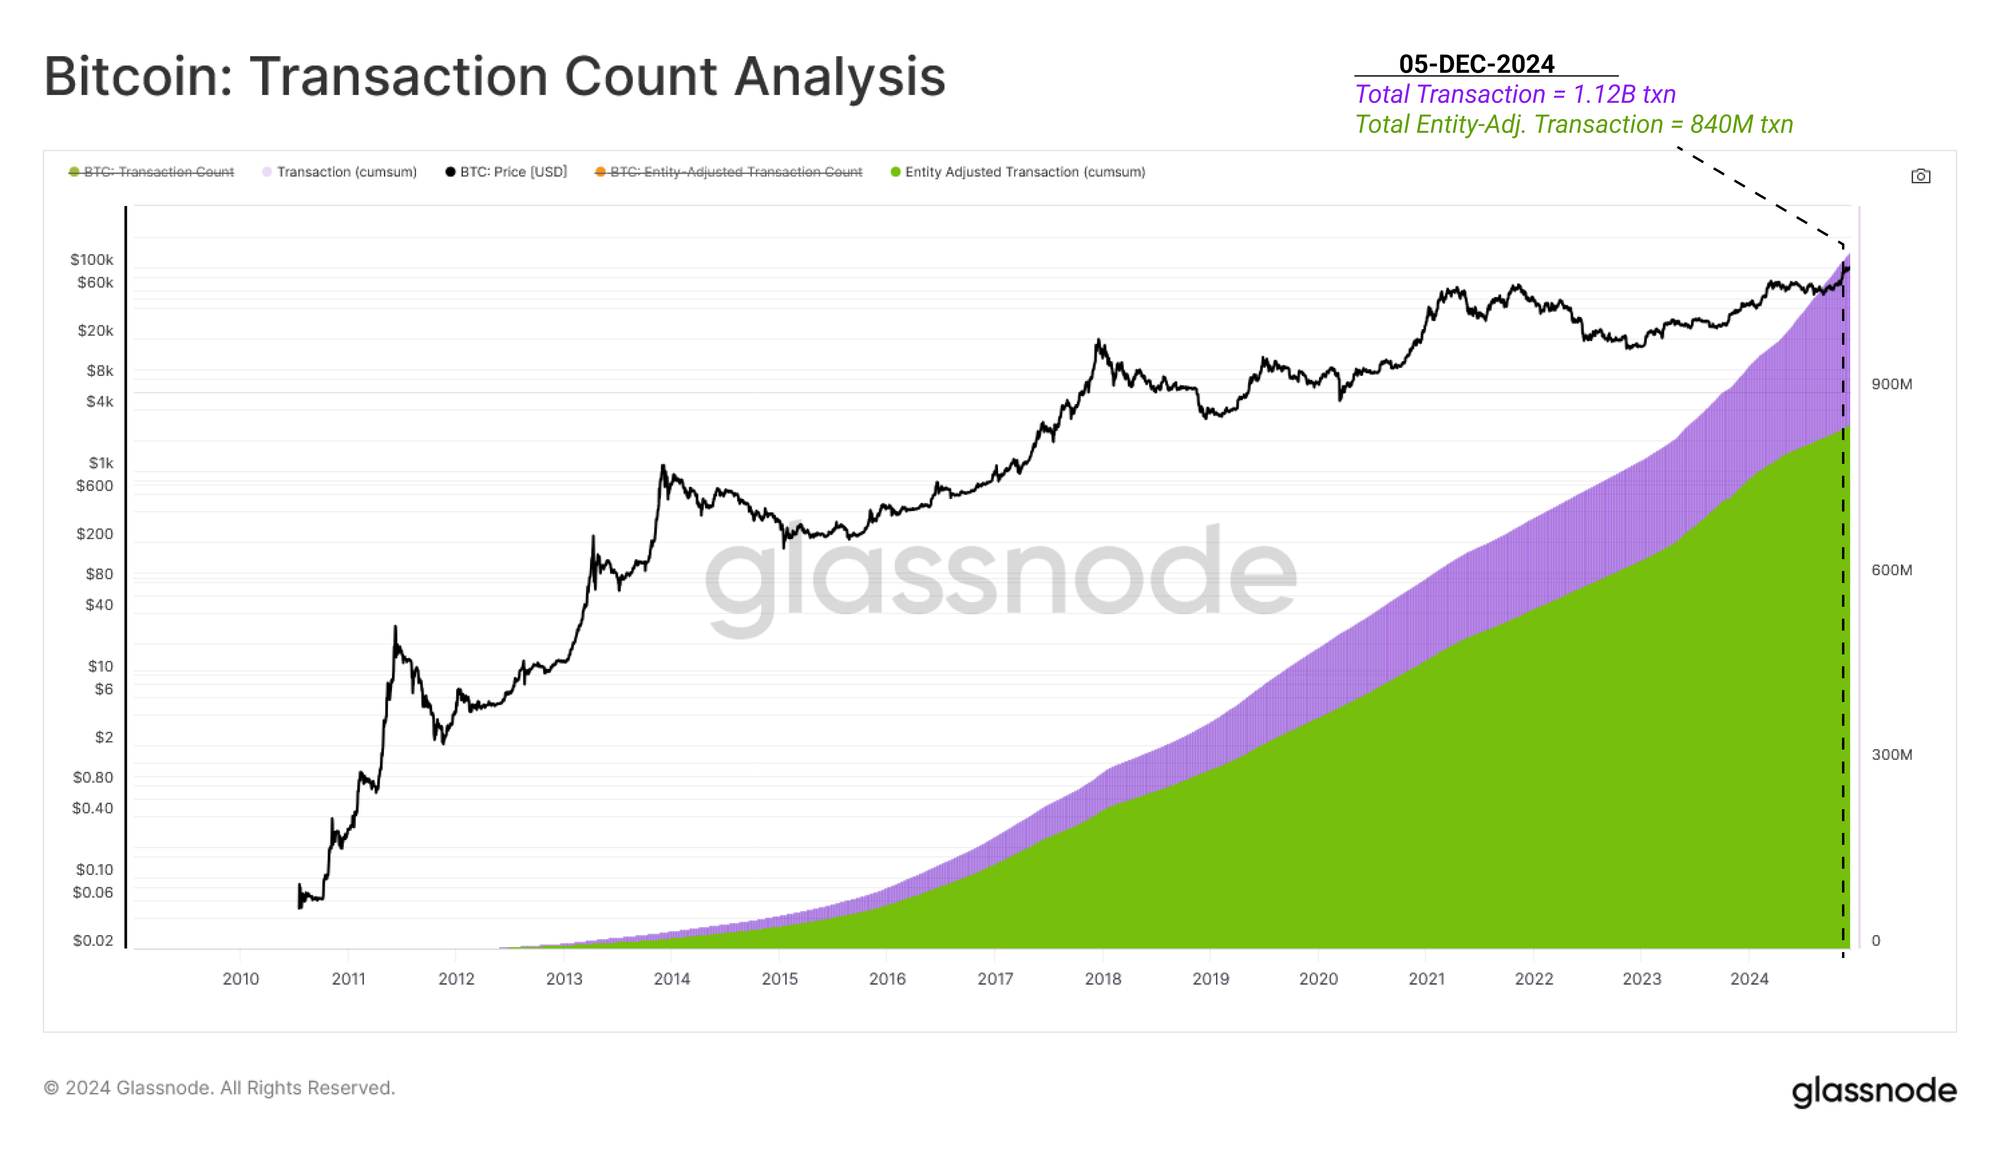
Bitcoin has also experienced extraordinary transactional growth. To date, the network has successfully processed 1.12 Billion transactions (on an unfiltered basis).
Glassnode’s entity adjustment heuristics consolidate activity across addresses deemed to be controlled by the same entity (e.g. ETFs or exchanges). This filters out internal transfers and provides a clearer picture of the actual economic activity occurring onchain.
Using our entity-adjusted variant of the total transaction count, we can filter out approximately 280M transactions as internal, leaving a total of 840M real economic transactions to date.
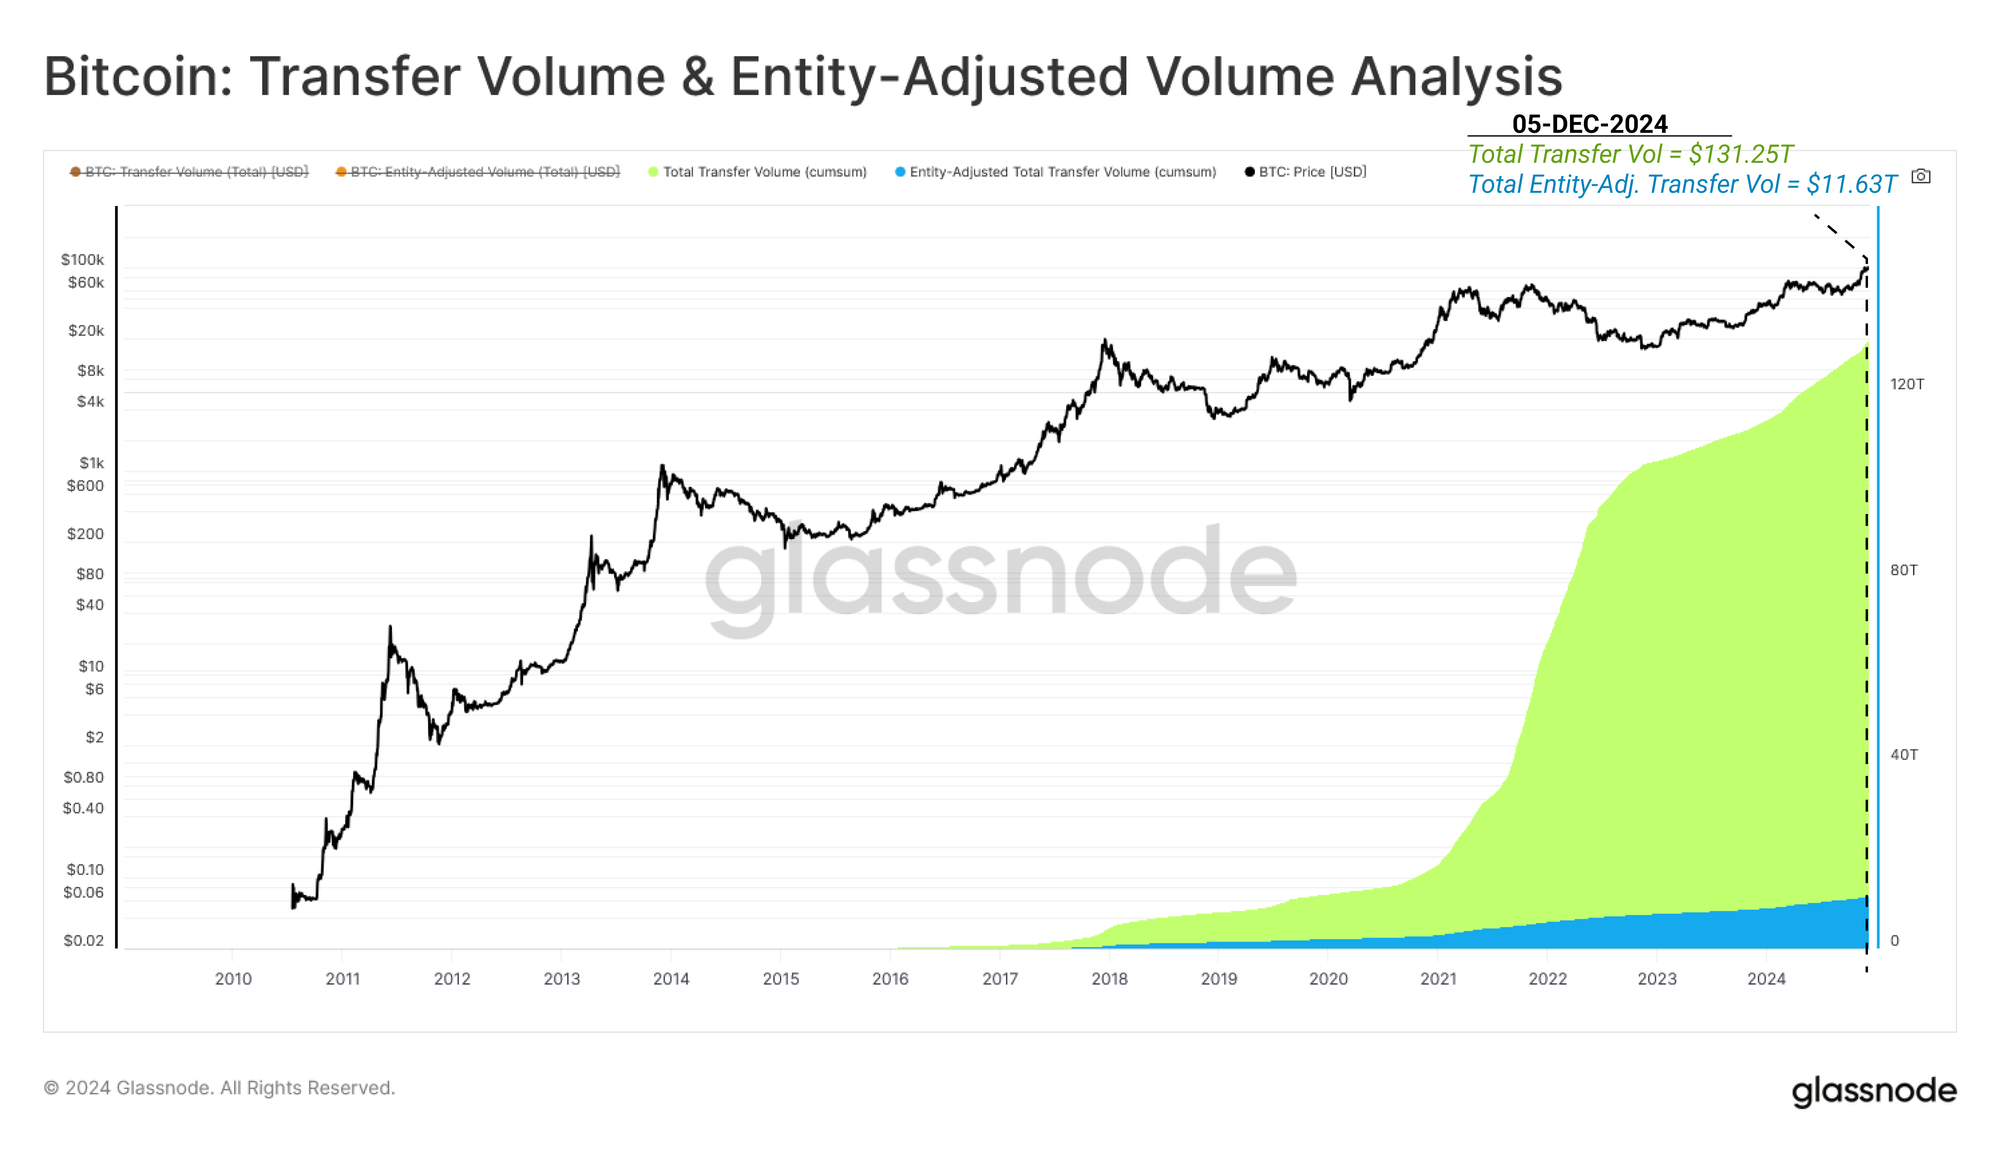
Measuring the dollar value of these transactions at the time of confirmation, the Bitcoin network has cumulatively processed $131.25 Trillion in volume. After applying entity adjustment, the filtered transfer volume stands at $11.63 trillion, just 8.86% of the total.
This reflects how a majority of the transaction counts are economical in nature. However, a super-majority of the volume transferred on-chain can be associated with large exchange and custodian wallet management.
Conclusion and Summary
Bitcoin's journey to $100k per BTC is symbolic not only of a price milestone but also as a testament to its remarkable journey from a small corner of the internet to a piece of globally important financial infrastructure. Since the Genesis Block, the network has matured by leaps and bounds, reaching a market cap of $2 Trillion, flipping silver in size, and settling $131 Trillion in volume via 1.12 Billion transactions.
The network has paid miners a cumulative $71.49 Billion in value, representing just a little over 3% of its market valuation in input costs to support itself, reflecting an incredible return on input costs. With hashrate near all-time highs and a highly distributed holder base, Bitcoin is well positioned for its increasingly important role on the world stage.
Disclaimer: This report does not provide any investment advice. All data is provided for information and educational purposes only. No investment decision shall be based on the information provided here and you are solely responsible for your own investment decisions.
Exchange balances presented are derived from Glassnode’s comprehensive database of address labels, which are amassed through both officially published exchange information and proprietary clustering algorithms. While we strive to ensure the utmost accuracy in representing exchange balances, it is important to note that these figures might not always encapsulate the entirety of an exchange’s reserves, particularly when exchanges refrain from disclosing their official addresses. We urge users to exercise caution and discretion when utilizing these metrics. Glassnode shall not be held responsible for any discrepancies or potential inaccuracies. Please read our Transparency Notice when using exchange data.
- Join our Telegram channel.
- For on-chain metrics, dashboards, and alerts, visit Glassnode Studio