Abstract
The crypto market has experienced turbulence recently, with many mainstream assets falling sharply. The main reason being the Fed's interest rate hike policy has led to a liquidity crunch. And there is a possibility that the policy will continue on its hike, triggering market concerns. A large amount of BTC has recently moved to exchanges, constituting a concentrated selloff. The de-peg of UST has forced LFG to use reserve BTC, which may continue to amplify the selloff. The NFT market is also falling and no hedge against the fall in ETH is in sight. The bottom can be determined and acted upon based on technical analysis or NUPL.
I. Cryptocurrency Market Performance and Analysis
The cryptocurrency market has been slightly turbulent of late.
From May 4 to May 9, the overall cryptocurrency market cap fell rapidly from US$1.788 trillion to US$1.361 trillion, a 24% drop in five days. Both BTC and ETH have fallen by about 20%, and for the first time since 2020, both have been down for six weeks in a row. The last bull market collapse did not see such a dismal situation.
Other mainstream assets have also suffered severe declines. In particular, along with the overall market sentiment, the 3rd largest stablecoin UST saw a serious de-peg. LUNA, which ranks in the top 10 in terms of market cap, has also cut back, which has severely undermined market confidence as if a bear market has suddenly arrived.
What caused the selloff and where is the market now?
The main reasons for this decline are the following:
The foremost factor remains the monetary policy of the Federal Reserve to raise interest rates.
In order to curb the high inflation in the US, the Fed initiated a rate hike. After announcing a 25BP rate hike in March, it continued to ramp up monetary policy this month. On May 5, the Fed's rate meeting announced an increase in the target range for the federal funds rate to between 0.75% and 1%; that is, a 50BP rate hike, and it is expected that a continued increase in the target range would be appropriate. It was also announced that an unwinding of the balance sheet would start in June and rise to the cap in three months. Compared with the 2017 contraction, the initial size of this reduction is larger and the time to reach the ceiling of the contraction is shorter.
Interest rates are the universal gravitational pull of risky assets. Risk assets, as represented by U.S. stocks, responded unequivocally to the rate hike. The S&P 500 fell by 9% and the Nasdaq by 10%.
Chairman Powell later said at a press conference that a larger rate hike is not being considered. Yetm some observers took issue with Powell's option to rule out a 75BP rate hike in the near future, and even Kashkari, a Dovish Fed official, said, "Unless supply chain pressures to push up prices abate, rates may have to go above neutral. We know we have to get inflation back down to 2%, and if the job market softens a little bit, that's not a big deal."
Not only do interest rate hikes and reduce the balance sheet in the future, but more violent policy changes may occur. With liquidity tightening superimposed on a weakened market mentality, the market will not perform too well. The cryptocurrency market is also affected by the U.S. monetary policy, and the price decline is inevitable.
If the subsequent rate hike is weaker than expected, will it be positive news for the market? Short term results are less important, for in the long run it seems we are in a cycle of interest rate hikes, liquidity in the market will continue to decrease, and the prices of risky assets are bound to come under pressure.
Second, a large amount of BTC was transferred to exchanges in the short term, and in the downward phase of the market, this behavior often means cashing out and can cause the price of BTC to fall. Nearly 70,000 BTC net flowed into the exchanges since May 5, and there was a short-term concentrated selloff.
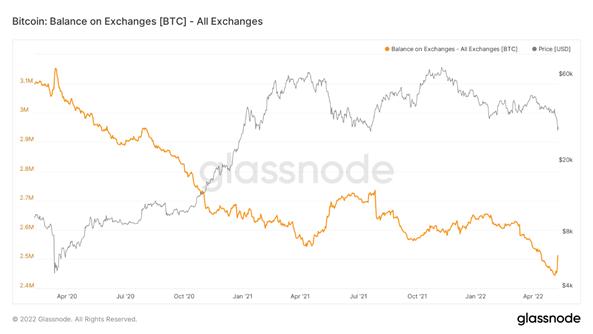
Figure 1: BTC balance on all exchanges Source:Glossnode
Thirdly, it is the plunge of LUNA and the de-peg of UST that led LFG to use BTC reserves to stabilize the price of UST. However, these BTC may continue to generate selling pressure and cause instability in the market.
Technically, after BTC hit a new low recently on May 5, the downtrend was confirmed again, so the decline in the following days continues this trend.
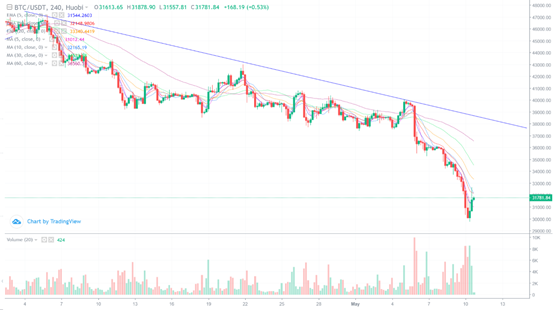
Figure 2: BTC prices Source:Huobi Global
II. NFT Market Performance and Analysis
NFT Indexes
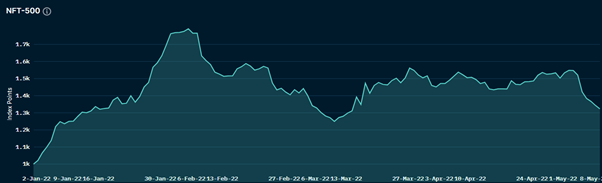
Figure 3: NFT Indexes Source: Nansen
The NFT-500 index has dropped significantly along with the crypto market. Many large-cap bluechip NFT projects have fallen by more than 10% or more in the past 24 hours. CyrptoPunks, often considered the bitcoin of NFTs, dropped 7% in floor price. Popular NFT collection Bored Ape Yacht Club has seen a 12% drop in floor price (ETH) from 103 Eth to 91 Eth. Taking Ethereum (USD) prices into account, the floor price has lost an approximate USD value of 18%, or US$31,682.
Historically, NFTs have performed well as Ethereum prices declined. However, given today’s macro-environment, it is uncertain that NFT prices will continue following this trend.
The Relationship between ETH(USD) and NFT (ETH) Prices
The price action of ETH (USD) has been an important factor that influences NFT prices and the volume of the NFT market. According to the table by Nansen, Nansen’s NFT-500 (ETH) index is negatively correlated with ETH prices between January and the 9 March 2022.
Since NFTs are bought and sold in ETH, a cheaper ETH (USD) price means cheaper NFTs prices in terms of USD. The crash of ETH during January led to a lot of buying volume in that month. Many investors saw this as an opportunity to get into popular collections at a discounted price. Some investors also purchased Blue-chip NFTs such as Bored Ape Yacht Club (BAYC) as a hedge for the falling ETH price.
During January, the floor price chart of BAYC shows that its floor prices in ETH climbed almost double as ETH dropped from US$3700 to US$2688. There were no fundamental changes for BAYC during that period.
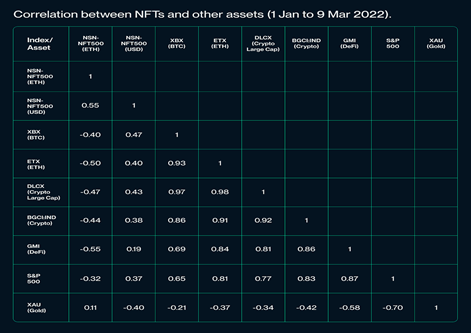
Figure 4: NFT correlation index Source: Nansen
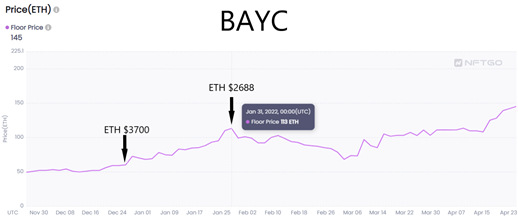
Figure 5: BAYC price Source: NFTGO
Today’s Market
Ethereum has already sunk 17% in the past week, and the NFT market reacted badly to the crash this time. At the moment, there are no signs that NFT buyers are seeing this as an opportunity to buy NFTs at a discounted price. Trading volume remained relatively low and price floors continued to drop.
III. Views on the post-market
The cryptocurrency market is currently at a low, but it is still experiencing a downtrend and should not be rushed to its bottom. It is much more comfortable to buy on the right side of the bottom.
The present FGI index of the market is 10, reaching the level of extreme panic.
One of the more amazing metrics that can guide us in our search for the bottom is Net Unrealized Profit/Loss (NUPL). It is (Market Cap - Realized Market Cap)/Market Cap, which is the percentage of unrealized profit or loss, and indicates the overall profitability of the entire network. The bottom of the market tends to be at the very low NUPL, which is the red area in the chart. We can see that today the NUPL has turned orange and when it turns red and rallies, it can be a buy point.
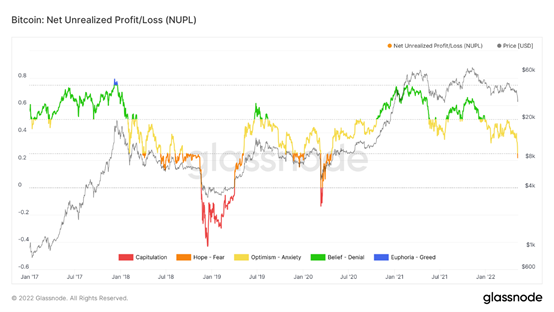
Figure 6: NUPL Source:Glassnode
Regarding the NFT market, the downside is still continuing and we still need to wait. This market does not bounce back as easily as the cryptocurrency market.
Disclaimer
1. The author of this report and his organization do not have any relationship that affects the objectivity, independence, and fairness of the report with other third parties involved in this report.
2. The content of the report is for reference only, and the facts and opinions in the report do not constitute business, investment and other related recommendations. The author does not assume any responsibility for the losses caused by the use of the contents of this report, unless clearly stipulated by laws and regulations. Readers should not only make business and investment decisions based on this report, nor should they lose their ability to make independent judgments based on this report.
3. The information, opinions and inferences contained in this report only reflect the judgments of the researchers on the date of finalizing this report. In the future, based on industry changes and data and information updates, there is the possibility of updates of opinions and judgments.
4. The copyright of this report is only owned by Huobi Blockchain Research Institute. If you need to quote the content of this report, please indicate the source. If you need a large amount of reference, please inform in advance (see “About Huobi Blockchain Research Institute” for contact information), and use it within the allowed scope. Under no circumstances shall this report be quoted, deleted or modified contrary to the original intent.
5. The copyright of this report is only owned by Huobi Blockchain Research Institute. If you need to quote the content of this report, please indicate the source. If you need a large amount of reference, please inform in advance (see "About Huobi Blockchain Research Institute" for contact information), and use it within the allowed scope. Under no circumstances shall this report be quoted, deleted or modified contrary to the original intent.
About Huobi Research Institute
Huobi Blockchain Application Research Institute (referred to as "Huobi Research Institute") was established in April 2016. Since March 2018, it has been committed to comprehensively expanding the research and exploration of various fields of blockchain. As the research object, the research goal is to accelerate the research and development of blockchain technology, promote the application of blockchain industry, and promote the ecological optimization of the blockchain industry. The main research content includes industry trends, technology paths, application innovations in the blockchain field, Model exploration, etc. Based on the principles of public welfare, rigor and innovation, Huobi Research Institute will carry out extensive and in-depth cooperation with governments, enterprises, universities and other institutions through various forms to build a research platform covering the complete industrial chain of the blockchain. Industry professionals provide a solid theoretical basis and trend judgments to promote the healthy and sustainable development of the entire blockchain industry.
Consulting email:
research@huobi.com
Official website:
https://research.huobi.com/
Twitter: @Huobi_Research
https://twitter.com/Huobi_Research
Medium: Huobi Research
https://medium.com/huobi-research