Bitcoin (BTC) starts the second week of May 2022 by bringing up bearish ghosts from its past — how much worse could the picture get for hodlers?
After falling to nearly $33,000, the largest cryptocurrency is giving market participants new and old a run for their money, and the fear is palpable.
A brutal combination of macro cues, which are set to continue this week and beyond, forms the backdrop for some historical chart retests that no one wanted to see again.
As calls for capitulation continue, there is still a lack of agreement about just how far BTC/USD could or should fall to put in a convincing long-term bottom.
Cointelegraph takes a look at factors poised to contribute to market movements in the coming days, as Bitcoin closes in on its 2022 lows.
Six weekly closes in the red
Whichever way you dice it, there is little to be bullish about when it comes to Bitcoin price charts this week.
The weekly close on May 8 at $34,000 meant that BTC/USD delivered its sixth weekly red candle in a row.
That chart feature has not been seen in nearly eight years — the last occurrence began in August 2014, data from Cointelegraph Markets Pro and TradingView shows.
Then, as now, Bitcoin was in the second year of its four-year halving cycle, having seen its first blow-off top at just over $1,000 in November 2013. This cycle, however, has been different, as that blow-off top either did not arrive or was a lot more muted than previous cycles.

BTC/USD 1-week candle chart (Bitstamp). Source: TradingViewMeanwhile, macro conditions have taken care of any hope of a late surge among the majority of analysts, who now expect financial tightening by central banks worldwide to keep risk assets such as crypto firmly in check.
Back to the chart and BTC/USD has lost over $4,000 or 11.1% in May already.
Historically, the worst month of May on record was in fact last year, in which the pair lost 35.3%, data from on-chain monitoring resource Coinglass shows.
After April’s performance, however, the odds of a comeback feel slim. For four years in a row prior to 2022, Bitcoin conversely saw gains of at least 32% in April, but this year printed a 17.3% loss — its worst on record.

BTC/USD monthly returns chart (screenshot). Source: CoinglassBTC 100-week moving average falls
As such, the advice from analysts when it comes to short-term Bitcoin price action is practically unanimous as the week begins: be careful.
After the weekly close, BTC/USD continued dropping down towards $30,000, at the time of writing looking to test $33,000 and January’s lows of $31,800 next.
“Don't try to catch this knife,” on-chain analytics resource Material Indicators told Twitter followers alongside a chart showing bid support disappearing from the Binance order book.
Monday’s order book data shows a major bid wall in place at $33,000. It was put there as another wall of buy interest at around $33,800 was dealt with swiftly by the market, showing the veracity of sell-side pressure in the current environment.

BTC/USD order book data (Binance). Source: Material Indicators“Historically $69.5M in BTC bid liquidity would serve as support, but historically it also had a significant amount of liquidity below it. That does not seem to be the case here,” Material Indicators added about that first line of defence.
Last week’s weekly candle also saw Bitcoin dive below its 100-week moving average (WMA) for the first time since March 2020.
Then, as with some previous piercings of the 100 WMA, BTC/USD then went on to test the 200 WMA as support. For popular Twitter account Bitcoin Back, the implications this time around are thus obvious.
“Both previous times led to capitulation to 200-week moving average in 2014 and 2018,” he wrote in part of his latest update.
“Today's chart has many differences from those two times, and those two times were very similar to each other.”

BTC/USD 1-week candle chart (Bitstamp) with 100, 200 WMA. Source: TradingViewBlockchain Backer nonetheless added that he expected a “big dive in” on Monday following the latest display of weakness.
As Cointelegraph reported, meanwhile, expectations even long before the weekly close were for Bitcoin to fall to or below $30,000 in the coming weeks.
US CPI primed to continue inflation narrative
Bitcoin’s rundown in the first week of May was overwhelmingly thanks to the broader macro weakness now firmly in place across global markets.
Stocks are particularly problematic in this respect, as crypto’s ongoing correlation to those indices makes for a grim ride for investors.
Things came to a head last week after tightening confirmations from the United States Federal Reserve — the S&P 500 capped its first five straight weekly drop since 2011.
Now, amid the ongoing Russia-Ukraine conflict and associated financial pressures, another force is due to return.
Inflation, already at its highest in the U.S. since the early 1980s, is tipped only to get worse thanks to the fallout from trade disruption and sanctions on Russia.
This week will see consumer price index (CPI) data for April released, and the odds are that the numbers will reflect the extent of the geopolitical turmoil like no others before it.
U.S. President Joe Biden will speak on the inflation issue on May 10 prior to the CPI print on May 11.
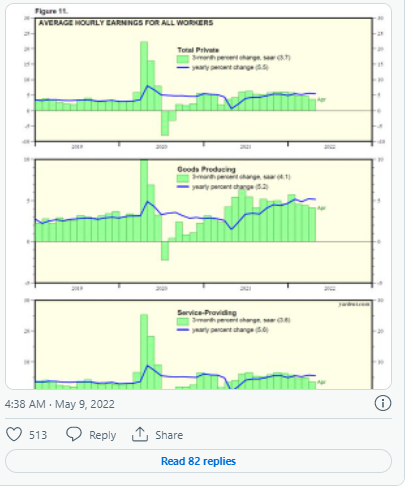
March CPI was 8.5%, while noises are already coming from analytics circles that inflation may be peaking now or in the near future.
“The best scenario for a bottom for me would be capitulation somewhere in the next few days followed by a lower than expected CPI print on wednesday,” popular trading account Daan Crypto Trades argued.
“That would be my cue to bet big.”
Big or small, CPI events have tended to spark short-term BTC price volatility in recent months.
Calculating capitulation
On the topic of “capitulation” — a mass sell-off as investors panic sell their bitcoins — data shows that the temptation to initiate may be strong.
Currently, over 40% of the Bitcoin supply is being held at a loss, and this is the highest proportion since April 2020, just after the COVID-19 crash.

At that time, a genuine capitulation event did take place, as evidenced first and foremost by price.
Analyzing unrealized profits and losses across hodlers at the time, as defined by on-chain analytics firm Glassnode, likewise confirmed capitulation on March 16, 2020.
Just nine days later, the firm’s net unrealized profit/loss metric exited the “capitulation” zone and reached “hope - fear” — one shade towards a recovery.
Currently, the metric measures “optimism - anxiety,” and is travelling downwards towards “hope - fear” territory.

Bitcoin net unrealized profit/loss chart. Source: GlassnodeSentiment collapses to macro bottom zone
It’s no surprise that overall crypto market sentiment has not benefited from the events of May so far.
According to the Crypto Fear & Greed Index, however, it is only this week that the reality of the situation has hit home for the majority.
As of May 9, the classic sentiment gauge measures 11/100, firmly in its “extreme fear” bracket and also at levels which have historically formed bottoms.
Crypto Fear & Greed has halved in value in just two days.

Crypto Fear & Greed Index (screenshot). Source: Alternative.meThe traditional financial market equivalent, the Fear & Greed Index, has meanwhile begun to diverge from crypto, steady at 30/100 or “fear” on May 9 even after last week’s mayhem.
“With Bitcoin now having retraced all the way down to $33.9k, trader sentiment has fallen to six week lows,” research firm Santiment commented on the situation.
“We typically prefer to see capitulation signs like this, as weak hands leaving the space is generally what is needed for a truly notable bounce.”

Fear & Greed Index (screenshot). Source: CNNThe views and opinions expressed here are solely those of the author and do not necessarily reflect the views of Cointelegraph.com. Every investment and trading move involves risk, you should conduct your own research when making a decision.