Bitcoin over the weekend was seen trading below its critical price support as broader market weakness continues. Traders’ confidence in the asset has remained quite low considering the selling pressure in the market.
The prices have currently plummeted owing to the news of the Federal Reserve hiking its interest rates. Bitcoin has also displayed profit booking on charts. This could be the reason why prices are falling further. If the asset fails to remain above the $38,000 price level, a short-term downslide could occur.
Bitcoin is currently trading in bearish sentiment, however, charts have something else to say. Many bullish divergences were spotted on charts in different time frames.
Bullish divergences amount to bullish sentiments. This means that over the long run Bitcoin can recover and trade above immediate resistances.
Bitcoin Price Analysis: One Day Chart
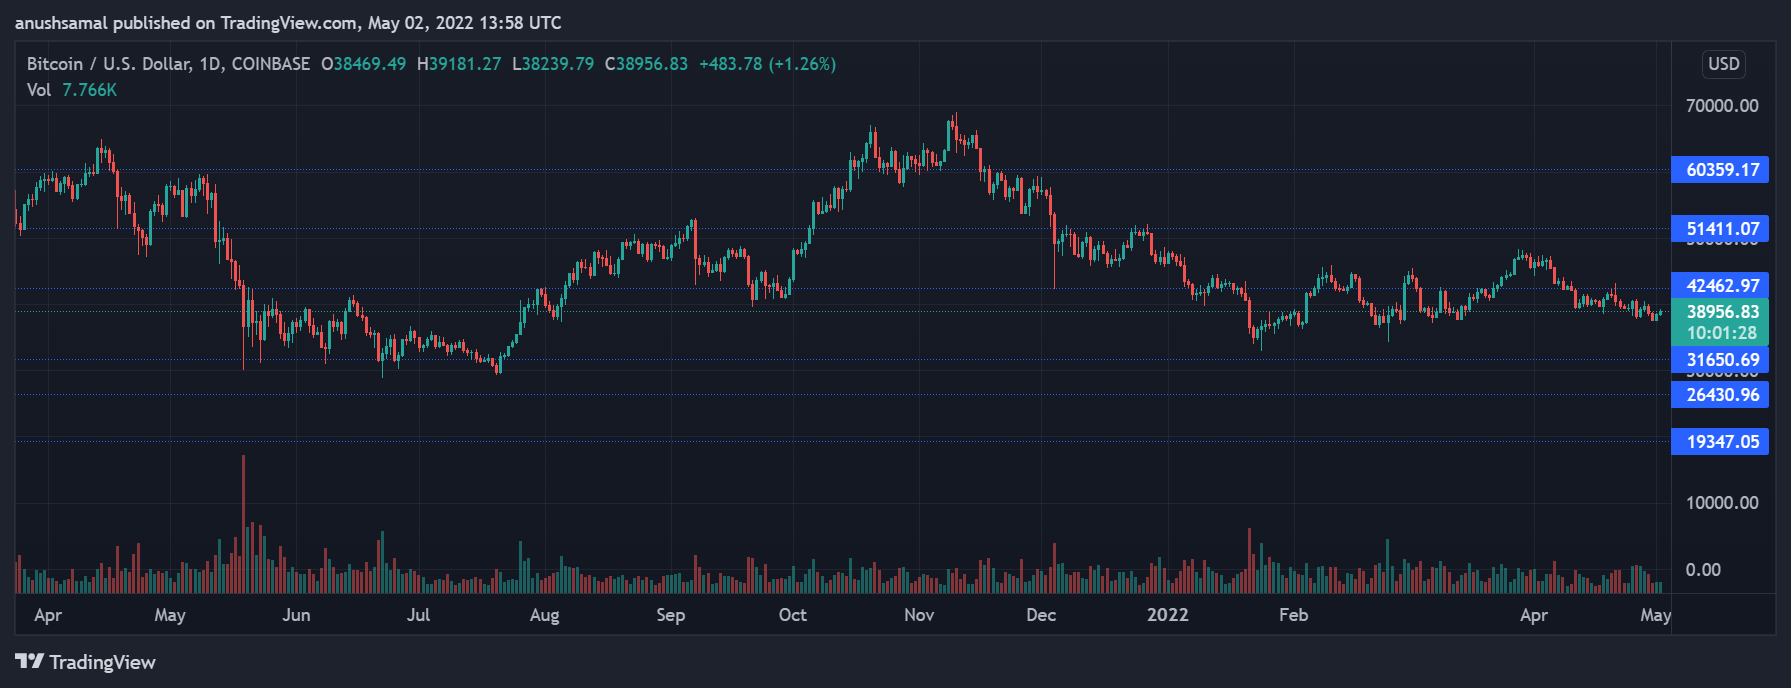
Bitcoin was priced at $38,956 on the one-day chart. Image Source: BTC/USD on TradingView Bitcoin was trading at $38,956 at the time of writing. Immediate resistance for the coin stood at $40,000. A fall below the current price level would mean BTC would trade near the $38,000 price level.
A fall from $38,000 could result in BTC trading at $31,000. In case there is a price reversal after breaking $40,000 then BTC could aim for $42,000.
The volume of Bitcoin trading had dropped in the last trading sessions, however, the bars were seen in the green. This could mean that buying pressure was seen returning to the market.
Technical Analysis: One Day Chart
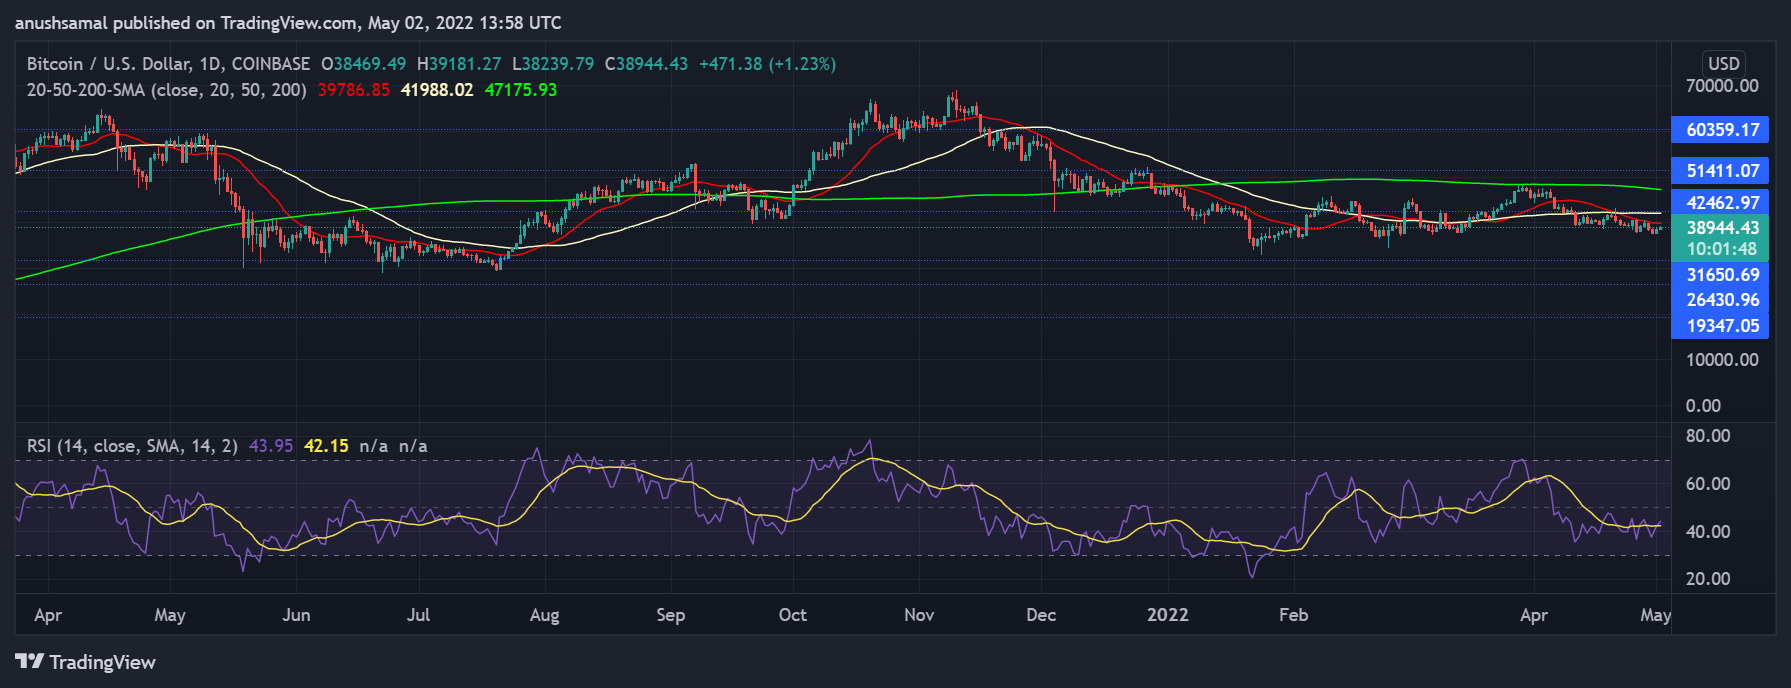
Bitcoin noted a sharp decline in buying strength on the one day chart. Image Source: BTC/USD on TradingView The price of BTC was seen trading below the 20-SMA line which signified an increased selling pressure. The price momentum was driven by sellers in the market. An increased buying pressure can push prices above the 20-SMA and then the 50-SMA line.
On the Relative Strength Index, the indicator was seen below the 50-line. A reading below the 50-line means a fall in buying strength. Profit booking has caused buying pressure to fall further. The buying strength made recovery attempts but failed each time.
At press time, however, there was a small uptick which meant that buying strength continued to try to recover on the charts.
Bitcoin Flashes Bullish Divergences On The One-Week Chart
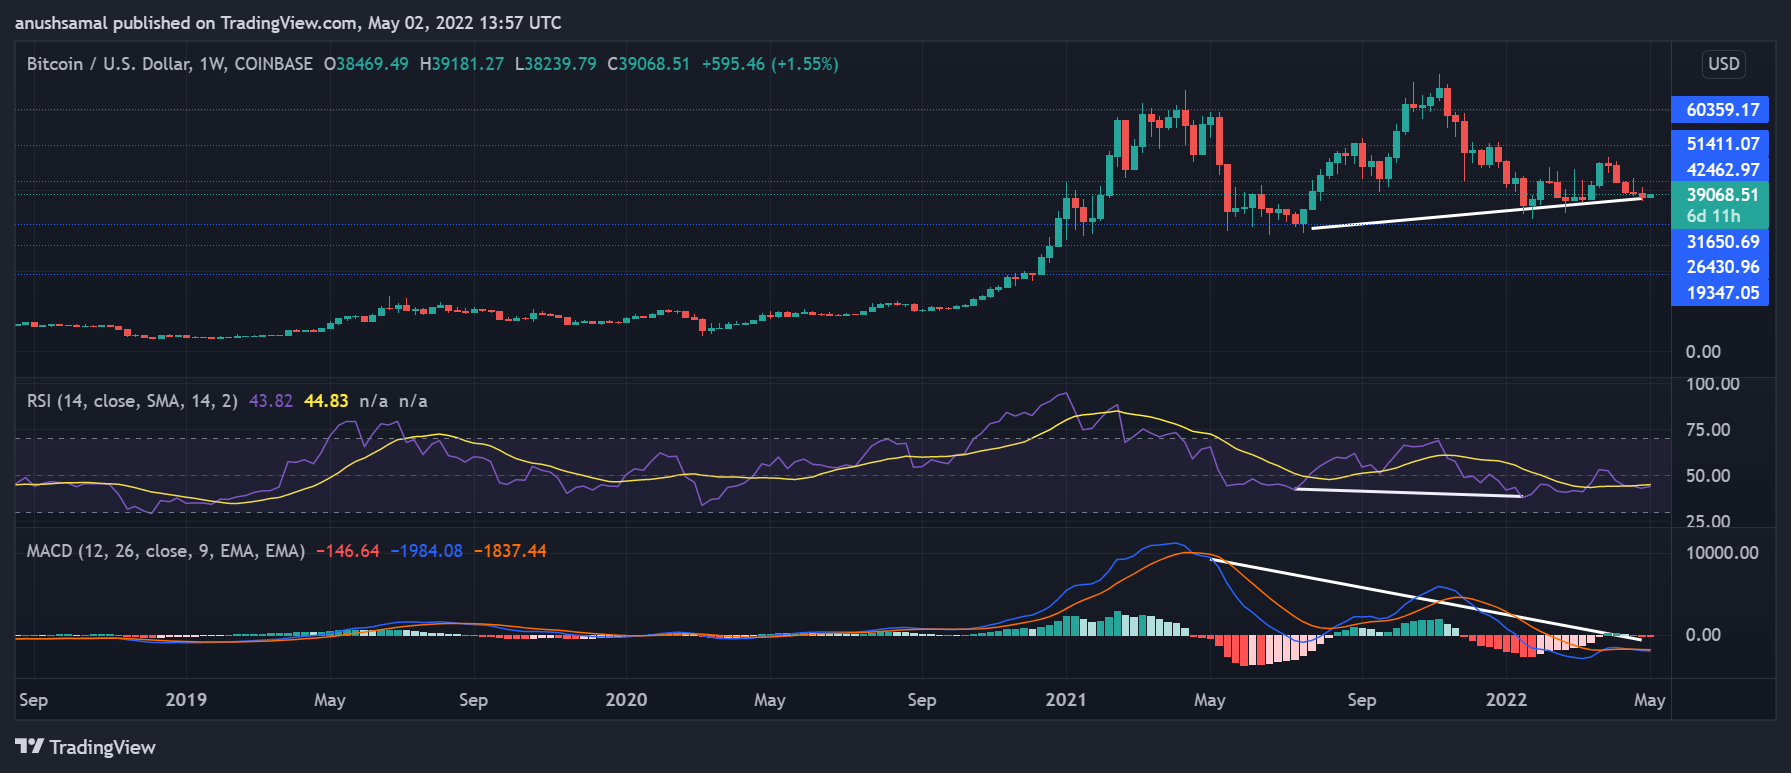
Bitcoin showed bullish divergences on the one-week chart. Image Source: BTC/USD on TradingView Bitcoin has been falling over the weekend and over the last 24 hours, BTC remained consolidated. In the past week, the coin declined by nearly 3%. The one-week chart demonstrated a build-up of bullish pressure. The bulls in the long run could break above the $38,900 price mark.
At the present, in the short term, if bulls resurface, a steady support region could form between the $38,000 and $37,000 and that would stop the coin from moving further downwards.
Indicators on the one-week chart posted mixed signals as the indicators continued to remain bearish. Both the RSI and MACD displayed hidden bullish divergences (white). Bullish divergences are considered positive and this could lead to northbound price action.
Bullish Indication On The Four-Hour Chart
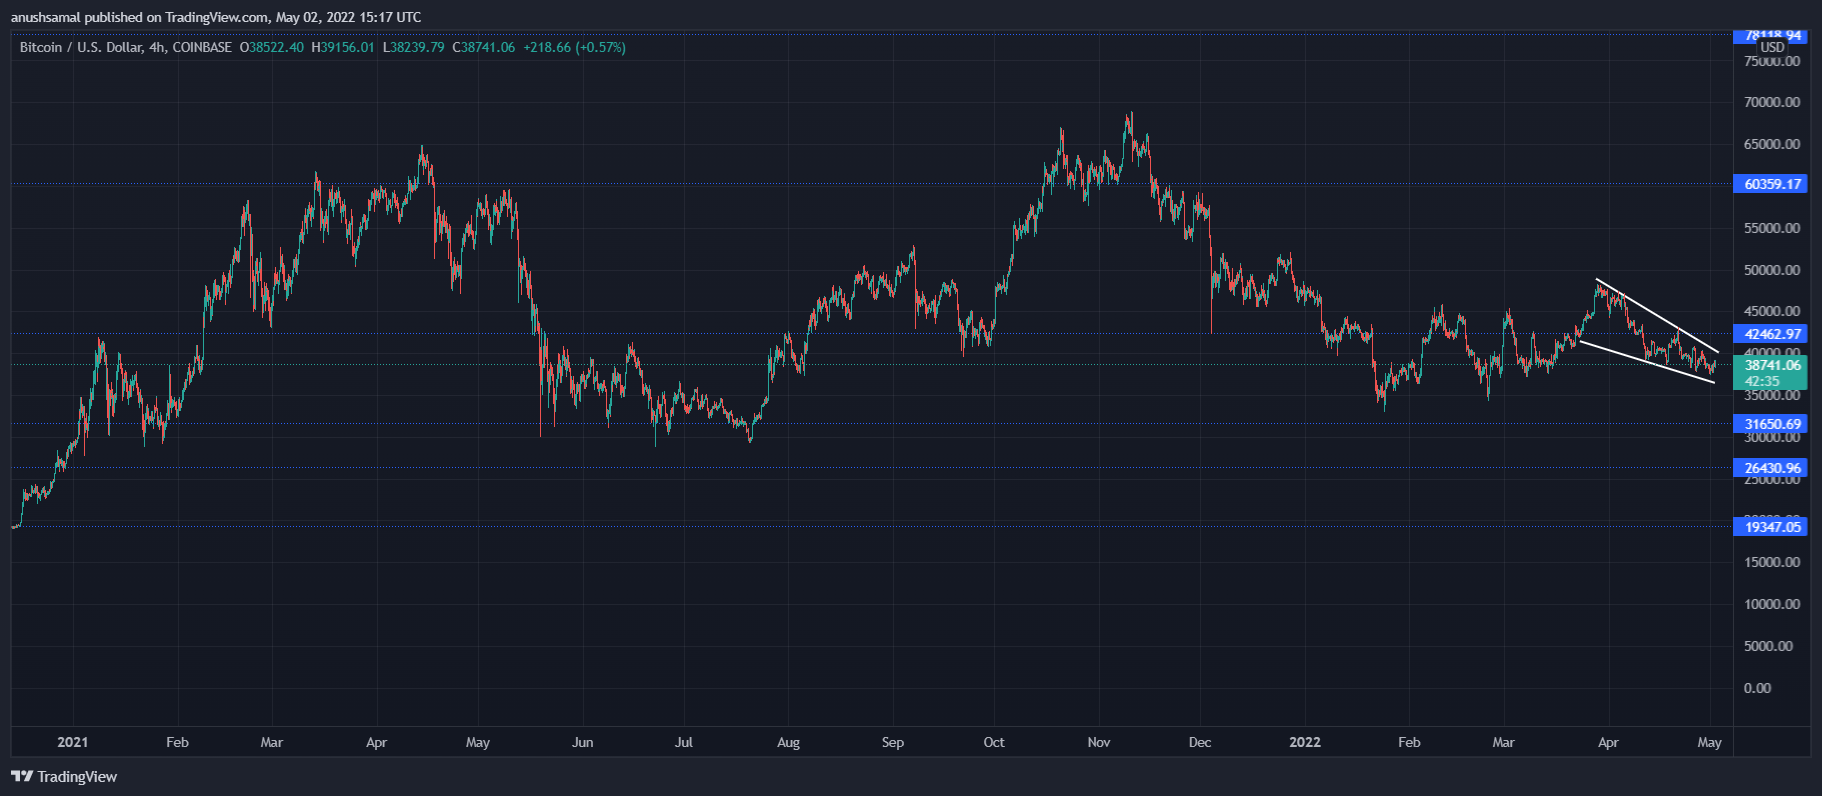
Bitcoin was trading in a descending wedge pattern. Image Source: BTC/USD on TradingView Bitcoin was seen trading within a descending wedge since mid of April. Descending wedge is considered to be a bullish price action and is tied with a breakout in prices. On both the four-hour chart and one-week price chart, there are bullish divergences and indications.
This suggests that a breakout in prices could be likely. In the case of a week’s time frame, both indicators displaying bullish divergences increase the chances of a breakout. On a short-term time frame, BTC continues to maintain a bearish outlook because of a fall in buying pressure.