Ethereum price is still struggling to clear the $1,720 resistance against the US Dollar. ETH could surge if there is a close above $1,720 and $1,740.
“”
- Ethereum is still facing a major hurdle near $1,720 and $1,740.
- The price is trading above $1,660 and the 100 hourly simple moving average.
- There is a key bearish trend line forming with resistance near $1,715 on the hourly chart of ETH/USD (data feed via Kraken).
- The pair could start another rally if there is a proper close above the $1,720 resistance.
“”
Ethereum Price Faces Key Hurdle
Ethereum price made another attempt to clear the $1,720 resistance zone. However, ETH failed to gain pace for a close above the $1,720 resistance, similar to bitcoin at $25,000.
The recent high was formed near $1,719 and the price is now consolidating gains. It corrected a few points below the $1,700 level. There was a move below the 23.6% Fib retracement level of the upward move from the $1,651 swing low to $1,719 high.
Ether price is now trading above $1,660 and the 100 hourly simple moving average. On the upside, the price is facing resistance near the $1,715 level. There is also a key bearish trend line forming with resistance near $1,715 on the hourly chart of ETH/USD.
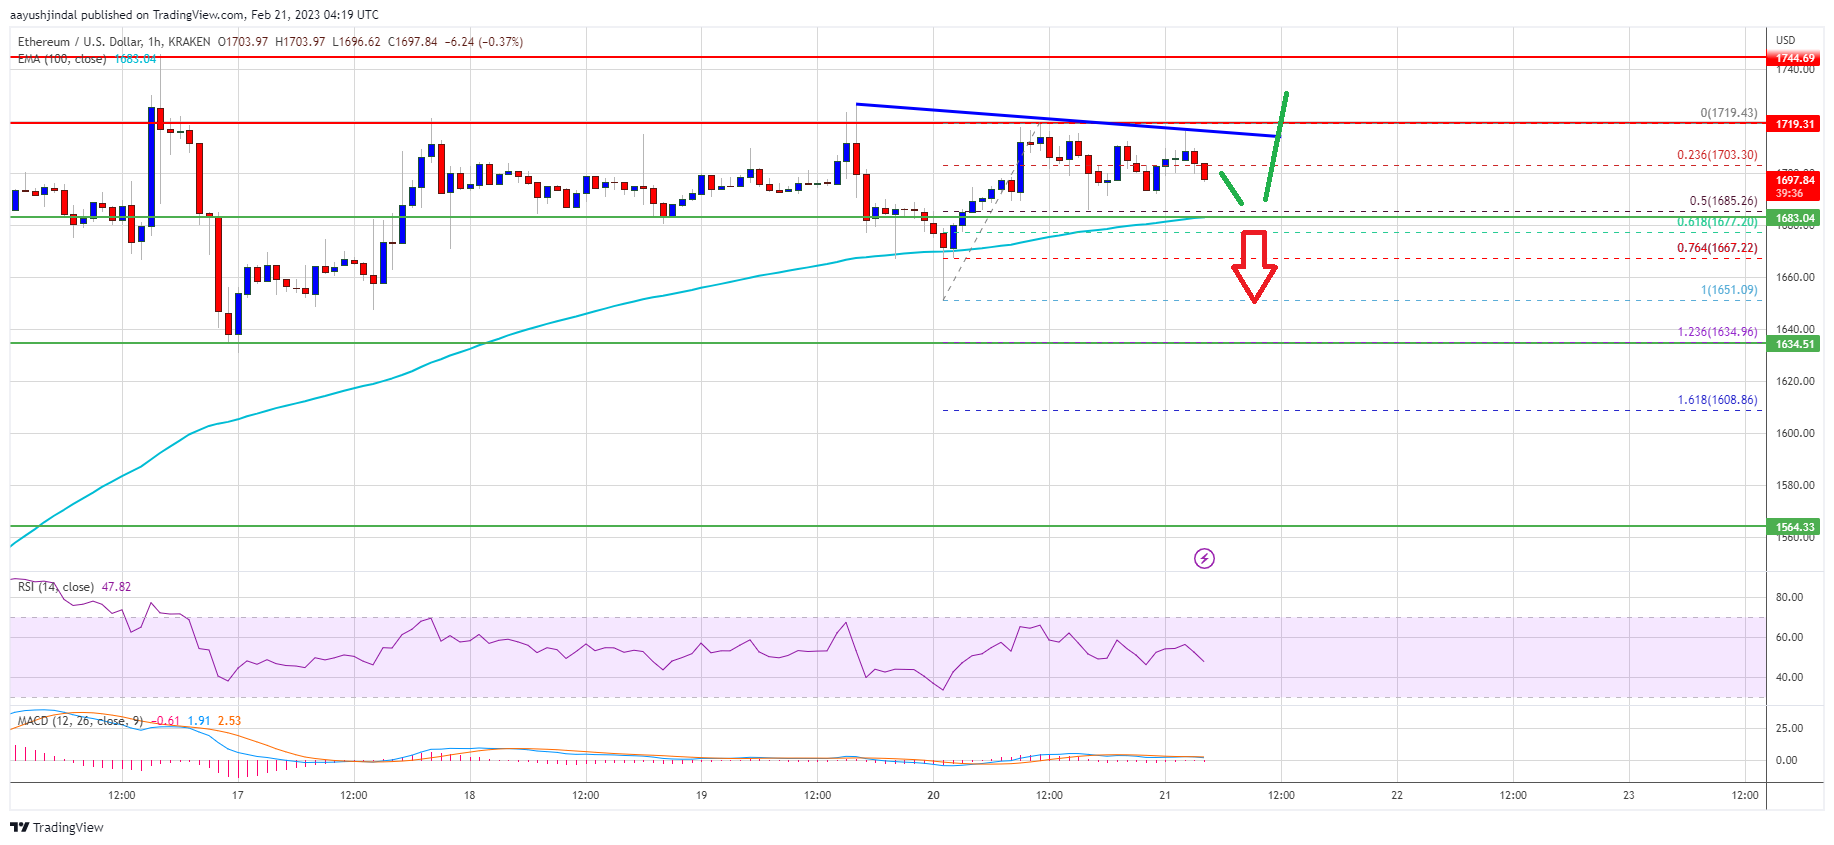
Source: 100 hourly simple moving average
The next major resistance is near the $1,720 zone. A proper close above the $1,720 resistance zone start a major increase. In the stated scenario, the price might rise towards the $1,800 level. Any more gains might open the doors for a move towards the $1,880 level.
Dips Limited in ETH?
If ethereum fails to clear the $1,720 resistance, it could start another downside correction. An initial support on the downside is near the $1,685 level and the 100 hourly SMA.
The 50% Fib retracement level of the upward move from the $1,651 swing low to $1,719 high is also near $1,685. The next major support is near the $1,665 zone. If there is a break below $1,665, the price might continue to drop towards the $1,600 support. Any more losses might call for a test of the $1,565 level.
Technical Indicators
Hourly MACD – The MACD for ETH/USD is now losing momentum in the bullish zone.
Hourly RSI – The RSI for ETH/USD is now above the 50 level.
Major Support Level – $1,665
Major Resistance Level – $1,720