Author: Omer Goldberg
Compiled by: Block unicorn
Vaults are one of those concepts in the cryptocurrency space that everyone thinks they understand, primarily because they seem straightforward. However, simplicity can be deceptive. Beneath the surface, vaults have quietly become one of the most misunderstood yet strategically critical foundational elements of the entire ecosystem.
During DeFi Summer, a "vault" was merely a clever UI wrapper around automated yield farming. Yearn transformed cumbersome, labor-intensive operations—such as switching between different yield farms and managing the compounding of governance tokens—into a near-magical experience. Just deposit funds, and the strategies would handle everything automatically. It was an internet-native abstraction, and it worked.
But 2025 is a different world.
Tokenized treasury bonds have evolved from experiments worth tens of millions of dollars to nearly $9 billion in assets under management, with institutions like BlackRock, Franklin Templeton, and Société Générale becoming active participants.
Risk-weighted assets (RWA) excluding stablecoins have reached tens of billions of dollars.
The market capitalization of stablecoins themselves has surpassed $300 billion, and the maturity of issuers has significantly increased.
The risk management and on-chain asset allocation industry, which was almost non-existent just a few years ago, now comprises nearly a hundred companies managing over $20 billion in assets.
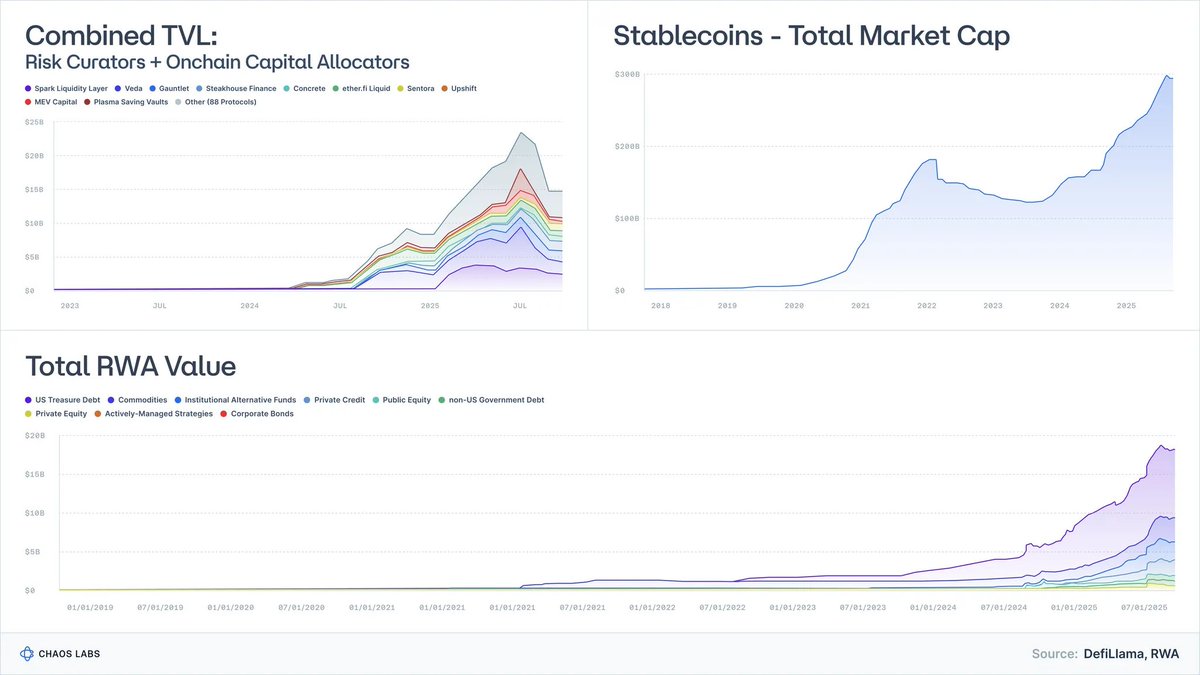
The view that vaults are merely "yield machines" is outdated. Vaults are evolving into fund wrappers, serving as programmable analogs for money market funds, structured credit, and (increasingly) hedge fund strategies.
And herein lies a dangerous misconception:
Most vaults are marketed as yield instruments. But economically, they are risk products.
The collapses of projects like Stream and Elixir made this clear. When the industry treated structured credit as equivalent to dollars, the outcome was predictable: poor risk management, chain dislocations, and systemic fragility in lending protocols.
This article aims to reframe the understanding of vaults: what they truly represent, how they map to real-world asset classes, and why "low-risk DeFi" is not a passing trend but the next frontier in global financial inclusion.
1. Vaults Are Essentially Portfolios with APIs
Strip away the UI and marketing, and the concept of a vault is quite simple:
A portfolio construction engine wrapped in an API.
-
Assets are deposited into the vault (stablecoins, Ethereum, risk-weighted assets).
-
Strategies are executed (lending, staking, hedging, leveraging, mining, selling volatility, underwriting credit).
-
A programmable interface handles deposits and withdrawals; sometimes with predictable liquidity, sometimes not.
That's all a vault is.
If a traditional finance professional handed you a fund prospectus, you would immediately ask:
-
Is this cash? Credit? Equity? Or some other exotic asset?
-
What are the liquidity characteristics—daily, weekly, or quarterly?
-
What happens to my principal in an extreme event?
Cryptocurrency skipped this step entirely. We talk about APY, not risk ratings.
On DeFi frontends, five vastly different strategies ultimately boil down to the same seemingly attractive card:
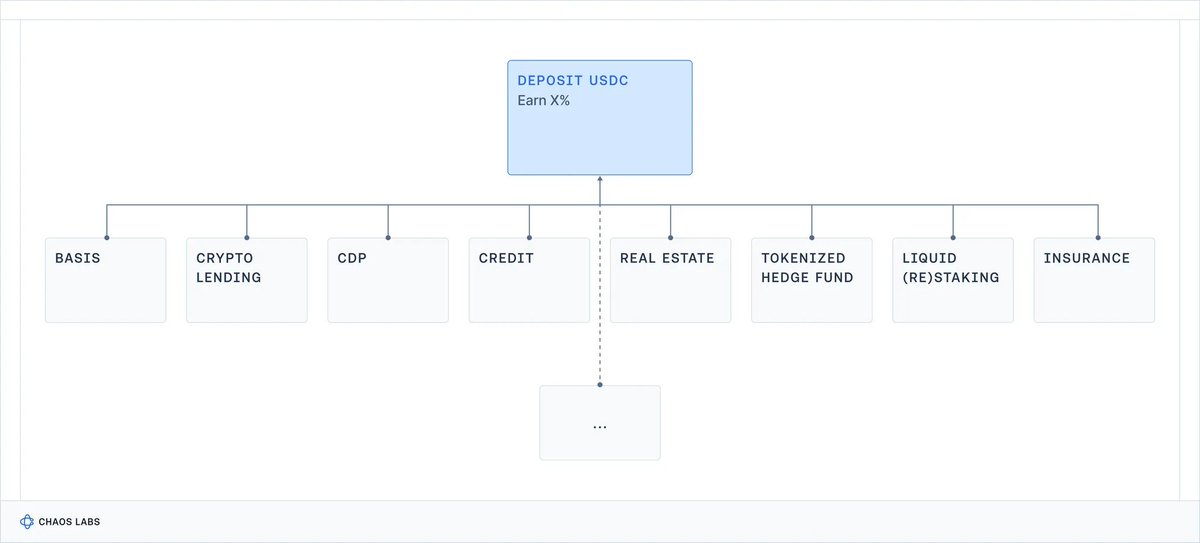
Vaults are gateways to anything on-chain.
What's missing is the most critical part: What risks am I actually taking?
Contract risk? Counterparty risk? Basis risk? Leverage risk? Credit risk? Or all of the above?
Ultimately, this opacity comes at a cost: retail users may take on risks they don't understand and suffer unexpected losses (potentially drawing regulatory attention); institutional investors will simply walk away, disappointed by the lack of professionalism and transparency standards.
Moreover, using yield as the sole competitive benchmark has another devastating effect on risk management: protocols and risk managers take on increasingly more risk to compete with each other.
As crypto enters an era of institutionalization, this must change.
2. What Yield Are You Actually Earning? The Real-World Benchmark
If we want to understand DeFi vault yields, we need a benchmark:
Historically, what returns have different types of risk in the real world actually delivered?
For nearly a century, researchers have been collecting data on core financial asset classes.
Aswath Damodaran maintains authoritative data series for U.S. stocks, bonds, and T-bills dating back to 1928, while the Global Investment Returns Yearbook tracks long-term returns for major countries since 1900.
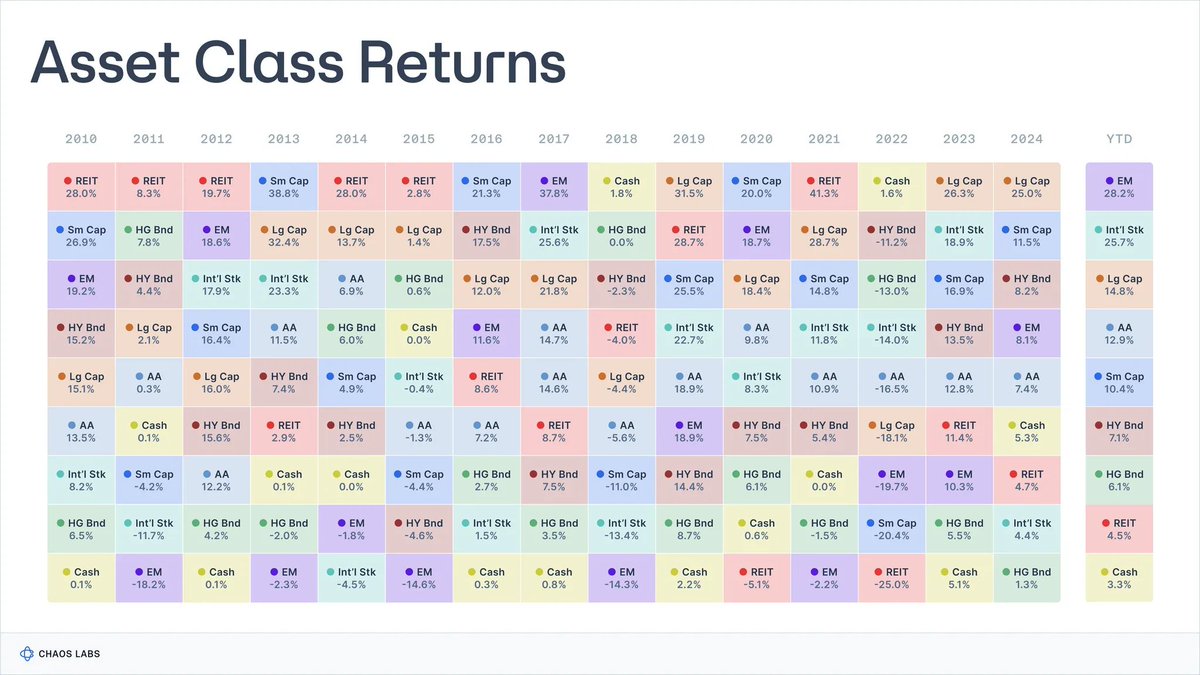
The picture across these datasets is remarkably consistent:
-
Stocks (S&P 500): ~9.9%
-
Small-cap stocks: ~11.7%
-
High-yield corporate bonds: ~7.8%
-
Investment-grade bonds: ~4.5%
-
Cash / T-bills: ~3.3%
-
Real estate: ~4.2%
-
Gold: ~5%
During this period, inflation averaged about 3%, so real returns were about 3 percentage points lower. These figures aren't precise predictions for the future, but they broadly reflect what's plausible in a long-term economy.
Each return comes with a set of risks and trade-offs borne by the holder.
2.1 Cash / T-Bills: Paid to Wait
Definition
In practice, it's the closest thing to a "risk-free" benchmark in the financial system (short-term U.S. government bonds, money market funds).
Historical Returns
Nominal yield ~3.3% (real return after inflation ~0-1%).
Return For: Essentially, since credit risk is nearly non-existent and duration risk is minimal, the return is based solely on the time value of money.
Trade-offs: Inflation silently erodes returns and purchasing power; after fees and friction, long-term real returns are close to zero.
Essentially, these are suitable for parking cash, not compounding wealth.
2.2 Bonds: Paid to Lend
Definition
Debt issued by governments and corporations, of varying quality. You lend money in exchange for interest and principal repayment.
Historical Returns
-
Investment-grade bonds: nominal yield ~4-4.6%;
-
High-yield bonds ("junk bonds"): nominal yield ~6-8%.
Return For:
-
Credit risk: the possibility of borrower default or impairment (higher for "junk bonds");
-
Duration risk: sensitivity to interest rate changes;
-
Liquidity risk, especially in niche or low-rated bonds.
Trade-offs: Bond portfolios can perform poorly when rates rise (cyclical sensitivity, e.g., the historic bond rout of 2022); real yields can be low or negative when inflation spikes; credit events (restructurings, defaults) can cause permanent capital loss.
The term "bond" covers a spectrum of instruments with varying risks and returns: assessing the economic health of the debtor is fundamental to determining the exact risk profile.
2.3 Stocks: Paid for Growth & Volatility
Definition
Ownership shares in businesses. Benefit from profits, innovation, and long-term economic growth.
Historical Returns
U.S. stocks (S&P 500): nominal return ~9.9-10%, real return ~6.5-7%.
Return For:
-
Business risk: companies can fail;
-
Earnings cycles: profits fluctuate with the economy, dividends may contribute less to total returns;
-
Volatility and drawdowns: even in developed economies, significant day-to-day market value swings are normal.
Trade-offs: Although global stocks have generally outperformed bonds and T-bills over the long term, multi-year adjustments of 30% to 50% are not abnormal (e.g., Japan's lost decade, or Europe from 2000 to 2018), especially after accounting for inflation.
2.4 Real Estate: Income + Leverage + Local Risk
Definition
Income-generating real estate: residential, commercial, logistics, etc.
Historical Returns
Long-term average nominal return for U.S. real estate indices ~4% to 4.5%, real return ~1% to 2%.
Return For:
-
Income risk and economic cycles: returns depend on tenants paying rent on time consistently, and rental income can decrease with economic cycles;
-
Local economic risk: exposure to specific cities, regions, and sectors;
-
Leverage and volatility risk: mortgages and debt financing amplify gains and losses;
-
Liquidity risk: real estate and many real estate-related instruments trade slowly and expensively, especially during stress periods.
Trade-offs:
You can't just "list" a property for sale immediately; selling or refinancing takes weeks/months, and even publicly traded REITs can experience significant declines when markets are under pressure;
Drops in interest rates, credit, or local demand (e.g., reduced office demand due to remote work) can simultaneously affect income and valuation;
The cost of rolling over debt can be high when rates rise or lenders tighten credit;
Portfolios are often overly concentrated in specific regions or property types.
In practice, although real estate has historically been an effective inflation hedge, it is a complex, illiquid domain that cannot be traded or spent like a cash equivalent.
2.5 Private Equity & Venture Capital: Illiquidity + Complexity Premium
Definition
Illiquid, long-term investments in private companies and projects, e.g., buyouts and growth equity; early-stage venture capital or distressed and special situations.
Historical Returns
-
Private equity: net IRR often around 15% in many vintages (but highly cyclical)
-
Venture capital: top-quartile fund managers see returns of 20-30%+
However, the data is extremely volatile: median actual returns are much lower, closer to single digits, once fees and survivorship bias are considered.
Return For:
-
Long-term illiquidity: capital locked up for 7-12 years
-
Complexity: bespoke deals, governance, and structures
-
Manager skill: huge dispersion between managers and vintages
-
Information asymmetry: requires specialized access and due diligence
-
Higher principal risk: VC is highly dependent on execution and economic cycles; high risk of principal loss.
Trade-offs: Capital is locked up for long periods; often no secondary market. Also, despite the risk, many funds underperform public markets after fees.
3. There's No Free Lunch: The Yield Ladder
When you aggregate all this historical data, a simple truth emerges:
No asset class in the real world offers high yields without commensurately high risk.
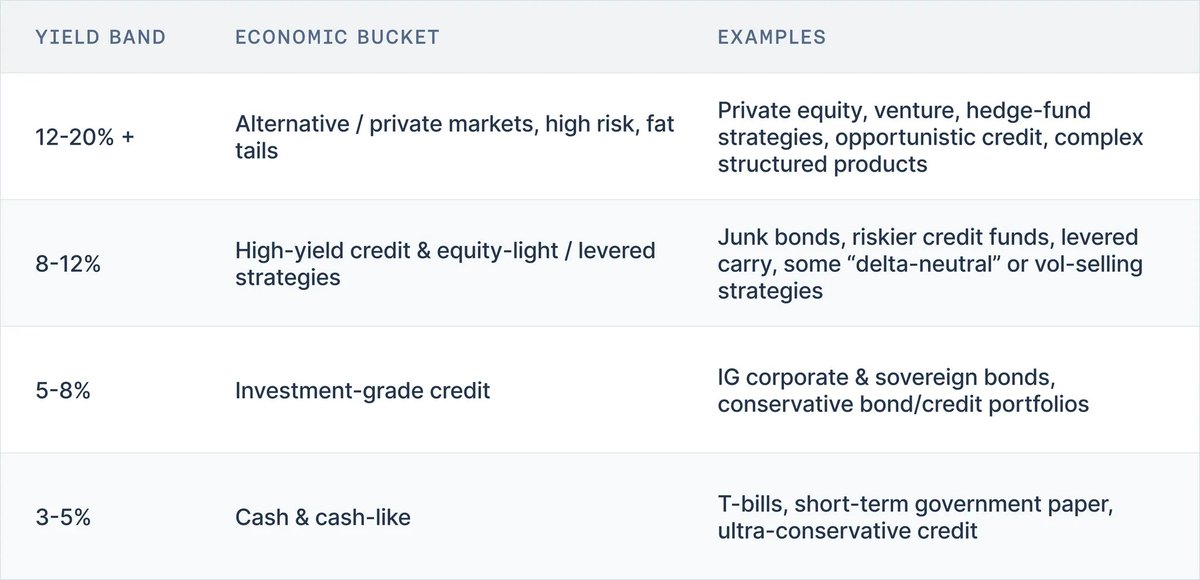
A practical way to interpret vault yields is using a yield ladder model:
-
3-5% → Cash, Treasuries, short-term government bonds, ultra-conservative credit
-
5-8% → Investment-grade bonds, conservative credit portfolios
-
8-12% → High-yield bonds, riskier credit, light equity strategies, some leveraged arbitrage
-
12-20%+ → Private equity, venture capital, hedge fund strategies, opportunistic credit, complex structured products
A century-plus of market data shows this yield ladder has been remarkably resilient through wars, hyperinflations, tech booms, and shifts in rate regimes.
Putting a portfolio on-chain doesn't invalidate it. So, whenever you see a DeFi vault, ask yourself two questions:
-
Does the advertised risk match the advertised yield?
-
Where is the yield coming from?
4. Conclusion: The Right Mental Model for Vault Yields
Strip away the marketing and UI, and the facts are simple:
-
Vaults are no longer auto-compounding "farms" but portfolios with APIs;
-
Their yield is the price of the risks they underwrite;
-
Over a century of market data shows that reasonable yield ranges for given risks have remained remarkably stable.
Cash-like instruments yield low single digits nominally, and almost zero real returns.
Investment-grade credit yields a bit more for duration and default risk.
High-yield credit and equities can reach high single digits to low teens.
Private equity, venture capital, and hedge fund strategies are the only investments that have historically delivered sustained mid-teens and above returns, but they come with illiquidity, opacity, and the real risk of permanent loss.
Putting these portfolios on-chain doesn't change the risk-return relationship. On today's DeFi frontends, five vastly different risk grades might all present as the same friendly ad: "Deposit USDC, earn X%," with little indication of whether you're taking cash, investment-grade credit, junk credit, equity, or hedge fund risk.
That's bad enough for individual users, who might be taking complex credit products or levered portfolio bets they don't understand.
But it also has systemic consequences: to stay competitive on yield, every product in a given "category" will tend toward the riskiest configuration in that category. Safer configurations look "underperforming" and get ignored. Custodians and protocols that quietly take more risk, leverage, or basis risk get rewarded—until a Stream or Elixir reminds everyone what they were actually underwriting.
So the yield ladder isn't just a pedagogical tool. It's the beginning of the risk language the industry is missing. If we can consistently answer for every vault these two questions:
-
Where on the ladder does this vault sit?
-
What risks does this yield expose me to (contract risk, credit risk, duration risk, liquidity risk, directional risk)?
Then we can judge performance by risk grade, rather than turning the entire ecosystem into a single, undifferentiated APY race.
In future parts of this series, we'll apply this framework directly to crypto. First, we'll map today's major vaults and blowups onto the ladder to see what their yields truly tell us. Then we'll zoom out to discuss what needs to change: labels, standards, curator practices, and system design.
In subsequent articles in this series, we will apply this framework directly to the cryptocurrency space. First, we will map today's major vaults and collapse cases onto this framework to see what their yields actually reflect. Then, we will step back to discuss what needs improvement: labels, standards, curator practices, and system design.