"Uninvestable" U.S. Treasuries Might Be the Highest-Returning Asset of 2026

marsbitXuất bản vào 2026-01-20Cập nhật gần nhất vào 2026-01-20

Tóm tắt

Amidst a shifting macroeconomic landscape in 2026, long-term U.S. Treasuries, particularly ETFs like TLT and TMF, are positioned to outperform equities. Key arguments include: gold's 200% rise signaling deflationary risks rather than sustained inflation; unsustainable U.S. interest expenses nearing $1.2 trillion annually; heavy short-term Treasury issuance increasing refinancing risks; and extreme short interest in long bonds creating potential for a squeeze. Additionally, cooling inflation, weak consumer sentiment, and rising trade tensions suggest a deflationary shock. Policy interventions, such as yield curve control or QE, are likely if long yields threaten growth or fiscal stability. With long-duration assets offering convexity and a 4.4–4.7% yield, a 100–200 bps decline in long-term rates could drive 15–45%+ returns, making long bonds a high-upside, asymmetric bet for 2026.

Author: Common Sense Investor (CSI)

Compiled by: Deep Tide TechFlow

Deep Tide Guide: With the dramatic changes in the macro environment in 2026, market logic is undergoing a profound shift. Veteran macro trader Common Sense Investor (CSI) presents a contrarian view: 2026 will be the year bonds outperform stocks.

Based on the U.S. government's heavy interest payment pressure, the deflationary signals released by gold, extremely crowded bond short positions, and imminent trade conflicts, the author believes that long-duration U.S. Treasuries (such as TLT) are at an inflection point with an "asymmetric game" advantage.

At a time when the market generally considers bonds "uninvestable," this article, through rigorous macro-mathematical deduction, reveals why long bonds could become the highest-returning asset of 2026.

Full article below:

Why I'm Overweight TLT and TMF — And Why Stocks Will Underperform in 2026

I do not write these words lightly: 2026 is destined to be the year bonds outperform stocks. This is not because bonds are "safe," but because macro mathematics, positioning, and policy constraints are converging in an unprecedented way—and this situation rarely ends with "Higher for Longer."

I have put my money where my mouth is.

TLT (20+ Year Treasury ETF) and TMF (3x Leveraged 20+ Year Treasury ETF) currently make up about 60% of my investment portfolio. This article compiles data from my recent posts, adds new macro context, and outlines a bullish upside scenario for long-duration bonds, particularly TLT.

Core Arguments at a Glance:

  • Gold's Movement: Gold's historical performance does not预示持续通胀—it预示通缩/deflation risk.
  • Fiscal Deficit: U.S. fiscal math is breaking down: ~$1.2 trillion in annual interest支出, and rising.
  • Issuance Structure: Treasury issuance is skewed short-term, quietly increasing systemic refinancing risk.
  • Short Squeeze: Long bonds are one of the most crowded short positions in the market.
  • Economic Indicators: Inflation data is cooling, sentiment is weak, labor market pressures are rising.
  • Geopolitics: Geopolitical and trade headlines are turning "Risk-off," not "Reflationary."
  • Policy Intervention: Policy always turns towards lowering long-end rates when something cracks.

This combination has historically been rocket fuel for TLT.

Gold Is Not Always an Inflation Alarm

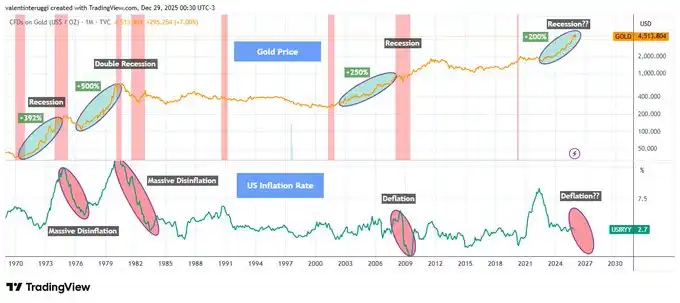
Whenever gold rallies over 200% in a short period, it signals not runaway inflation, but economic stress, recession, and falling real rates (see Chart 1 below).

Historical experience shows:

  • The 1970s gold surge was followed by recession + disinflation.
  • The early 1980s surge was followed by a double-dip recession; inflation was broken.
  • The early 2000s gold rise预示了 the 2001 recession.
  • The 2008 breakout was followed by a deflationary shock.

Since 2020, gold has again risen about 200%. This pattern has never ended in lasting inflation.

When growth flips, gold acts more like a safe-haven asset.
U.S. Interest支出 Is Compounding Explosively

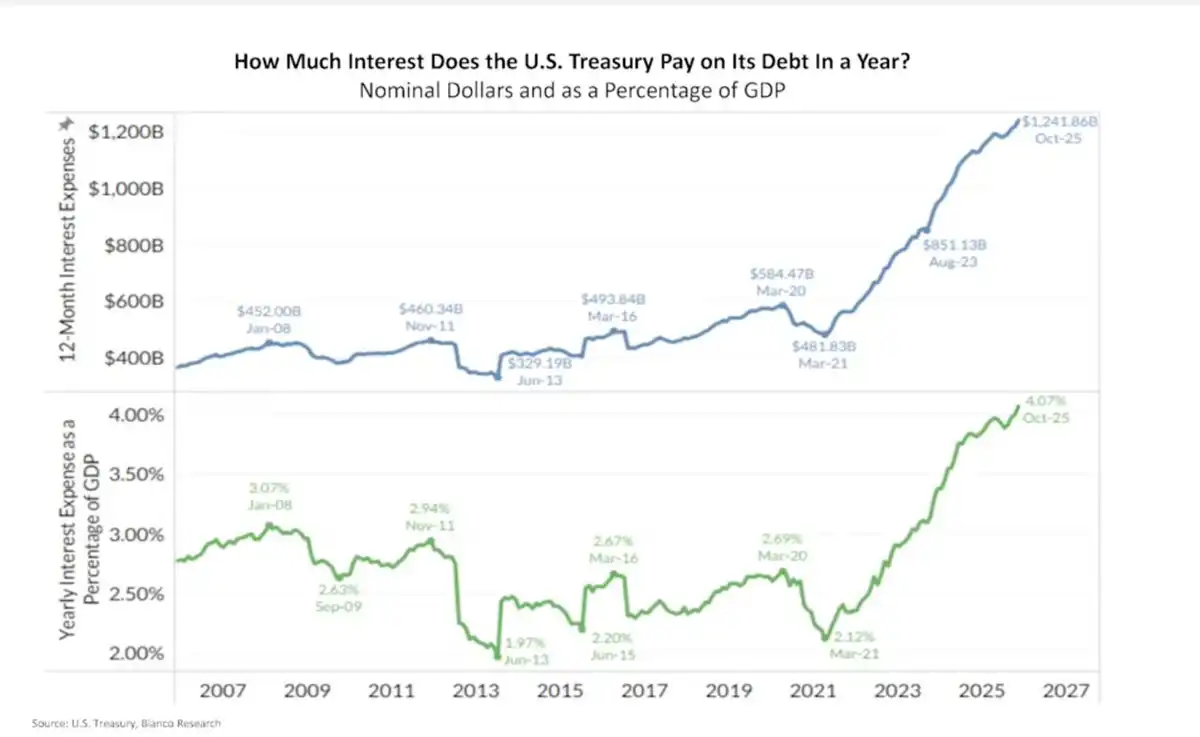
The U.S. currently has annual interest支出 of about $1.2 trillion, roughly 4% of GDP (see Chart 2 below).

This is no longer a theoretical issue. This is real money flowing out—interest compounds rapidly when long-term yields stay high.
This is so-called 「Fiscal Dominance」:

  • High rates mean higher deficits
  • Higher deficits mean more debt issuance
  • More issuance leads to higher Term Premium
  • Higher Term Premium leads to higher interest支出!

This doom loop won't resolve itself with "Higher for Longer." It must be resolved through policy intervention!

Treasury's Short-Term Trap

To alleviate immediate pain, the Treasury has drastically cut long-bond issuance:

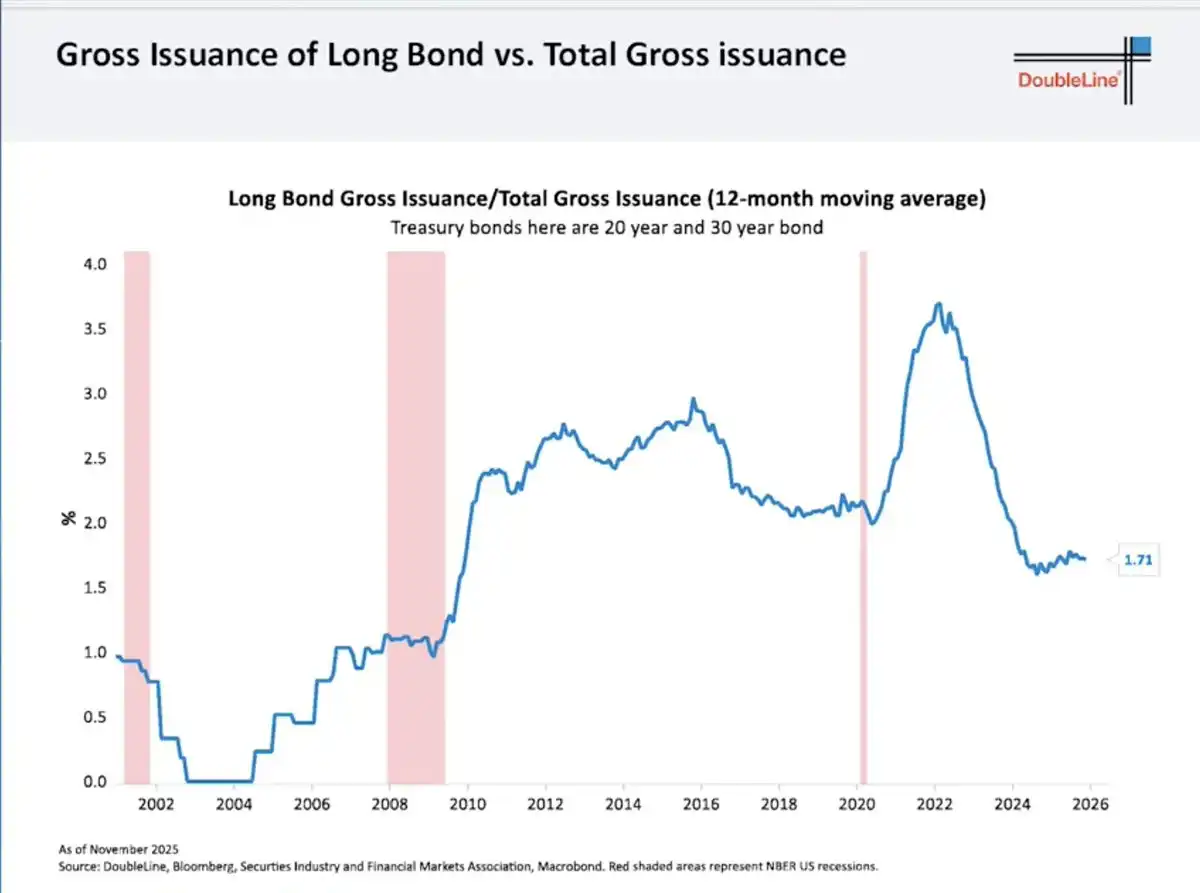
  • 20/30-year bonds now make up only ~1.7% of total issuance (see Chart 3 below).
  • The rest has been pushed into short-term Bills.
This doesn't solve the problem—it just kicks it down the road:

  • Short-term debt constantly rolls over.
  • Refinancing will happen at future rates.
  • The market sees the risk and demands a higher Term Premium.

Ironically, this is why long-end yields stay high... and why they will collapse violently if growth cracks.

The Fed's Trump Card: Yield Curve Control

The Fed controls the short end, not the long end. When long-end yields:

  1. Threaten economic growth
  2. Trigger explosive fiscal costs
  3. Disrupt asset markets

...the Fed has historically only done two things:

  1. Buy long bonds (QE)
  2. Cap yields (Yield Curve Control)

They won't act preemptively. They only act after stress appears.

Historical references:

  • 2008–2014: 30-year yield fell from ~4.5% to ~2.2% → TLT surged +70%
  • 2020: 30-year yield fell from ~2.4% to ~1.2% → TLT surged +40% in under 12 months

This isn't just theory—this has happened!

Inflation Is Cooling, Economic Cracks Appearing

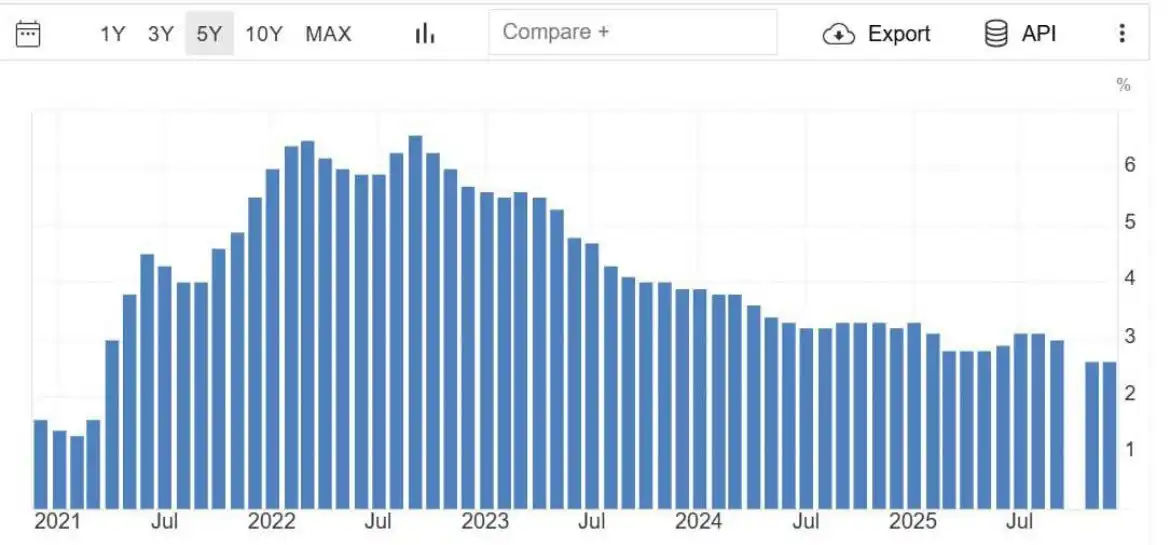
Recent data shows core inflation falling back to 2021 levels (see Chart 4).

  • CPI momentum is fading.
  • Consumer confidence is at a decade low.
  • Credit pressures are building.
  • The labor market is starting to crack.
Markets are forward-looking. The bond market is already starting to smell this.

Extremely Crowded Short Position

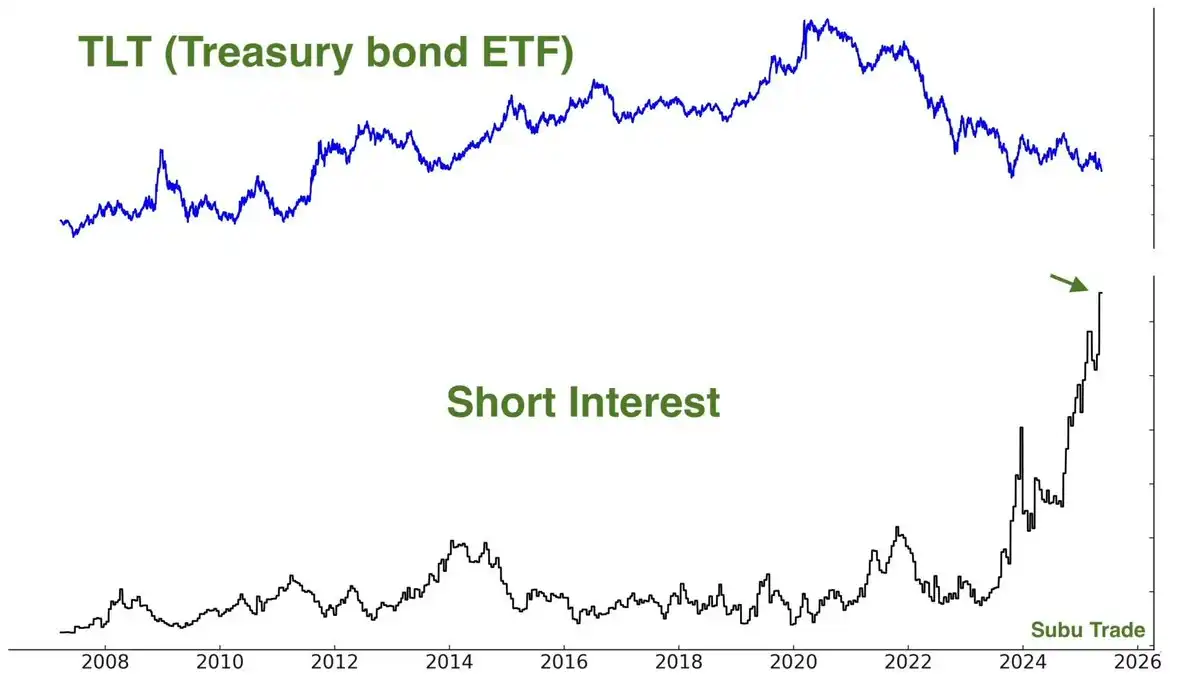
TLT short interest is extremely high:

  • ~144 million shares sold short.
  • Days to cover exceeds 4 days.

Crowded trades don't unwind slowly. They reverse violently—especially when the market narrative shifts.

And importantly:

"Shorts pile in AFTER the move, not before."

This is classic late-cycle behavior!

Smart Money Is Moving In

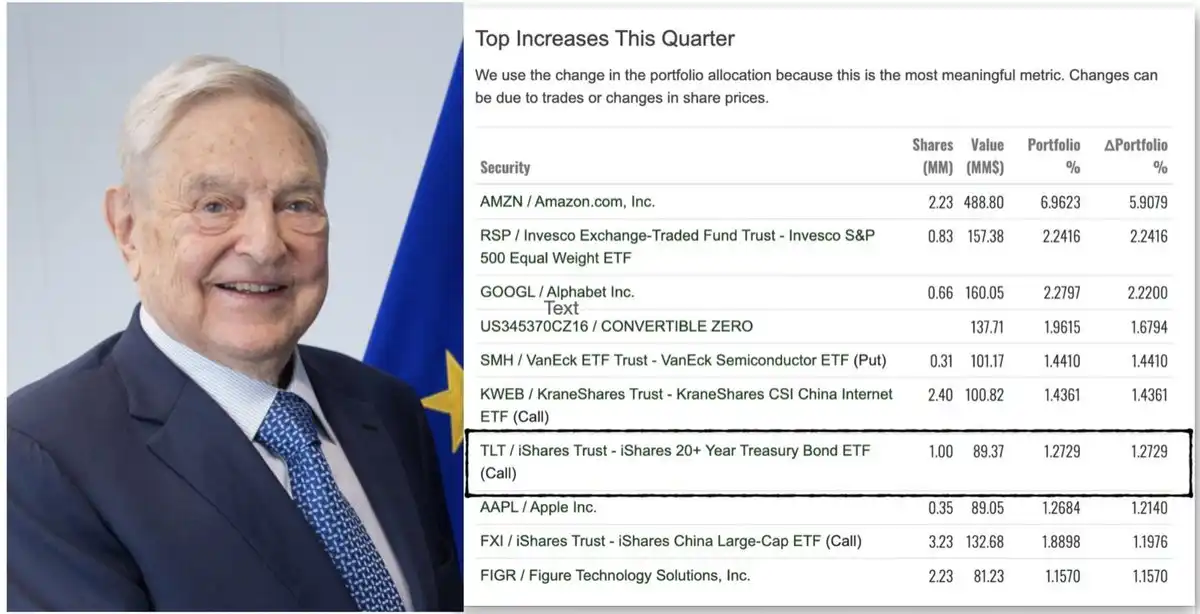
Recent widely circulated 13F institutional holding reports showed a large fund's quarterly increase list featured significant TLT call options.

Whoever it's attributed to, the message is simple: Sophisticated capital is starting to reposition for duration. Even George Soros's fund held TLT call options in its latest 13F disclosure.
Deflationary Shock from Tariff Friction

Recent news is reinforcing the "risk-off" logic. President Trump announced new tariff threats regarding the Denmark/Greenland dispute, and European officials are now openly discussing freezing or suspending participation in the EU-US tariff agreement in response.

Trade friction will:

  • Hit growth
  • Squeeze margins
  • Reduce demand
  • Push capital into bonds over stocks

This is not an inflationary impulse; it's a deflationary shock.

Valuation Mismatch: Stocks vs. Bonds

Today's stock pricing reflects:

  • Strong growth
  • Stable margins
  • Benign financing conditions

While bond pricing reflects:

  • Fiscal stress
  • Sticky inflation worries
  • Permanently high yields

If either of these narratives is wrong, returns will diverge violently.

Long-duration bonds have "convexity"; stocks do not.

$TLT Upside Case Analysis

TLT has:

  • ~15.5 years effective duration
  • You earn ~4.4–4.7% yield while you wait

Scenario Analysis:

  • If long-end yields fall 100 basis points (bps), TLT price return is +15–18%.
  • Fall 150 bps, TLT return is +25–30%.
  • Fall 200 bps (not extreme historically),意味着 it will surge +35–45% or more!

This doesn't include interest income, convexity bonuses, or the accelerating effect of short covering. This is why I see "asymmetric upside."

Conclusion

Honestly: After the惨状 of 2022, I swore I'd never touch long bonds again. Watching duration assets get crushed was a frustrating experience.

But the market doesn't care about your psychological trauma—it only cares about probabilities and price.

When everyone agrees bonds are "uninvestable," when sentiment bottoms, when shorts pile up, when yields are high and growth risks are rising...

That's when I start buying!

  • TLT + TMF are currently ~60% of my portfolio. I made 75% returns in the 2025 stock market and redeployed most of it into bond ETFs in November 2025.
  • I'm "getting paid to wait" (earning over 4% yield).
  • My position is based on policy and growth shifts, not虚无的 narrative.

2026 will finally be the "Year of the Bond."

Câu hỏi Liên quan

QAccording to the article, why does the author believe long-duration U.S. Treasuries (like TLT) could be the highest-returning asset in 2026?

AThe author believes a combination of factors creates an 'asymmetric bet' for long bonds: unsustainable U.S. interest expenses, gold price signaling deflationary risks, extremely crowded short positions in bonds, cooling inflation, emerging economic weaknesses, and the high probability of policy intervention (like QE or Yield Curve Control) to lower long-term rates, which would cause their prices to surge.

QWhat historical pattern does the author cite regarding gold's performance and what it has typically preceded?

AThe author states that historically, whenever gold has risen over 200% in a short period, it has not signaled persistent inflation but instead preceded economic stress, recession, and falling real interest rates (disinflation/deflation). Examples given are the 1970s, early 1980s, 2000s, and 2008.

QWhat is 'Fiscal Dominance' as described in the article, and why is it a problem for the U.S.?

A'Fiscal Dominance' is described as a vicious cycle where high interest rates lead to higher budget deficits, which require more government debt issuance. This increased issuance leads to a higher term premium (the extra yield investors demand for holding long-term bonds), which in turn leads to even higher interest expenses, creating a self-reinforcing loop that is unsustainable.

QHow does the current structure of U.S. Treasury debt issuance create a 'short-term trap'?

AThe Treasury has drastically reduced the issuance of long-term bonds (20/30-year) to about 1.7% of total issuance, pushing most of the borrowing into short-term bills. This doesn't solve the debt problem; it merely kicks it down the road. These short-term bills must be constantly refinanced at future (potentially higher) rates, increasing systemic refinancing risk and keeping long-term yields high due to the market's perceived risk.

QWhat specific market positioning factor does the author highlight as a potential catalyst for a rapid price increase in long-term bond ETFs like TLT?

AThe author highlights the extremely crowded short interest in TLT, with approximately 144 million shares sold short and a high 'days to cover' ratio. This creates the conditions for a violent short squeeze, where a shift in market narrative would force short sellers to buy back shares rapidly, accelerating any upward price move.

Nội dung Liên quan

Từ Vàng Đến Bitcoin: Nguồn Cung Cố Định + Sự Cuồng Nhiệt Của Tổ Chức, Có Tái Diễn Diễn Biến Giá 'Bùng Nổ'?

Bài viết phân tích triển vọng giá Bitcoin thông qua viễn cảnh so sánh với quỹ ETF vàng (GLD). ETF vàng ra mắt năm 2004, đã chứng kiến giá vàng tăng mạnh trong 20 năm, đạt vốn hóa gần 28 nghìn tỷ USD, dù trải qua chu kỳ tăng trưởng rồi điều chỉnh mạnh. Chuyên gia Eric Balchunas cho rằng lộ trình này có thể lặp lại với ETF Bitcoin: một giai đoạn tăng vọt ban đầu, sau đó là đợt điều chỉnh sâu và phục hồi chậm, nhưng đáy mỗi chu kỳ được nâng cao. Bitcoin, tương tự vàng, là công cụ lưu trữ giá trị không sinh lãi với nguồn cung gần cố định, giá cả phụ thuộc vào tâm lý nhà đầu tư. Việc phê duyệt ETF Bitcoin đầu năm 2024 đã thu hút mạnh dòng tiền tổ chức, nhưng cũng dẫn đến biến động lớn, như việc BlackRock's IBIT đã bán gần 100.000 Bitcoin gần đây. Dù giá Bitcoin đã giảm hơn 50% từ đỉnh tháng 10/2025, nhiều nhà phân tích lạc quan về nhu cầu tổ chức bền vững từ ETF và việc các doanh nghiệp đa dạng hóa danh mục. Kết luận, nếu Bitcoin có thể bắt chước một phần hành trình của vàng với tư cách là nơi lưu trữ giá trị, tiềm năng tăng giá vẫn rất lớn, dù hành trình đó sẽ đi kèm với sự biến động mạnh mẽ đặc trưng của thị trường tiền mã hóa.

Foresight News4 phút trước

Từ Vàng Đến Bitcoin: Nguồn Cung Cố Định + Sự Cuồng Nhiệt Của Tổ Chức, Có Tái Diễn Diễn Biến Giá 'Bùng Nổ'?

Foresight News4 phút trước

Sau 9 tháng bán khống, chuyển sang toàn diện mua vào, nhà giao dịch nổi tiếng xây dựng vị thế Bitcoin quanh mức 64k, sự phân hóa tâm lý thị trường crypto gia tăng

Sau 9 tháng làm ròng, trader nổi tiếng Doctor Profit tuyên bố đóng toàn bộ vị thế bán và bắt đầu mua Bitcoin ở mức ~64.000 USD. Ông lập luận rằng các yếu tố cơ bản như luật CLARITY, sự tham gia của các tổ chức tài chính lớn và làn sóng mã hóa tài sản có thể khiến đáy chu kỳ 4 năm đến sớm hơn dự kiến. Phân tích kỹ thuật từ chuyên gia on-chain gumsays cho thấy sự phân kỳ tăng trên biểu đồ tuần đã kéo dài 147 ngày, gần với mức 161 ngày trước khi hình thành đáy năm 2022. Tuy nhiên, nhà nghiên cứu Jake Pahor đưa ra quan điểm đối lập. Dựa trên dữ liệu lịch sử, ông chỉ ra rằng mọi đáy thị trường gấu từ năm 2014 đều đáp ứng ba điều kiện: thời gian kéo dài ~12 tháng, chỉ số sợ hãi cực đoan (dưới 20) kéo dài, và giá phá vỡ "Giá thực hiện" (hiện ~53.000 USD). Chu kỳ hiện tại chưa đạt điều kiện nào trong số này. Thị trường đang chia rẽ giữa phe "mua sớm" tin vào sự thay đổi cấu trúc và phe "chờ tín hiệu xác nhận" tuân theo khuôn mẫu lịch sử. Giá Bitcoin hiện quanh 64.800 USD, nằm ngay trên đường trung bình 200 tuần (~63.000 USD) trong bối cảnh chỉ số Fear & Greed ở mức 25 (Sợ hãi tột độ).

marsbit1 giờ trước

Sau 9 tháng bán khống, chuyển sang toàn diện mua vào, nhà giao dịch nổi tiếng xây dựng vị thế Bitcoin quanh mức 64k, sự phân hóa tâm lý thị trường crypto gia tăng

marsbit1 giờ trước

Lời chia sẻ của một trader kỳ cựu: Làm thế nào để giao dịch với kỳ vọng sai lầm của thị trường?

**Tóm tắt: Giao dịch "Kỳ vọng Sai lầm" từ một Trader Kỳ cựu** Đây là một giao dịch điển hình về "kỳ vọng sai lầm" của thị trường. Khi dữ liệu CPI yếu được công bố, thị trường lập tức phản ứng tích cực, cho rằng chính sách tiền tệ sẽ nới lỏng và đẩy chỉ số Nasdaq (NQ) lên cao. Tuy nhiên, lãi suất thực dài hạn (30 năm) ngay trong đêm đó đã tăng lên mức cao nhất trong 20 năm. Điều này cho thấy một sự "từ chối" ở phía dài hạn: thị trường vốn dài hạn không hề rẻ đi như kỳ vọng. Các công ty công nghệ vốn phụ thuộc vào vốn vay dài hạn để phát triển sẽ bị ảnh hưởng nặng nề, và trần định giá cho nhóm cổ phiếu này đã bị khóa chặt. Trader này đã thực hiện năm lệnh bán khống NQ, tận dụng đợt giảm từ 30060 xuống 28768 điểm. Phương pháp cốt lõi là: **không chỉ nhìn vào dữ liệu, mà phải phân tích xem thị trường *nghĩ* dữ liệu đó sẽ tác động thế nào, và sau đó kiểm tra xem cơ chế tác động đó có còn hiệu lực hay không.** Bài học chính: Thị trường thường phản ứng theo các "hàm phản ứng cũ" đã thành thói quen (ví dụ: dữ liệu yếu = lãi suất giảm = cổ phiếu công nghệ tăng). Khi bối cảnh vĩ mô thay đổi (ví dụ: áp lực lãi suất dài hạn dai dẳng), các mối quan hệ nhân quả cũ này có thể bị phá vỡ. Cơ hội Alpha không nhất thiết đến từ việc biết thông tin sớm hơn, mà đến từ việc nhận ra sự sai lệch giữa kỳ vọng của đám đông (dựa trên hàm phản ứng cũ) với thực tế mới của thị trường. Tóm lại, hãy luôn tự hỏi: **Phản ứng đầu tiên của thị trường đang dựa trên chuỗi nguyên nhân-kết quả nào? Và chuỗi đó, hôm nay có còn đúng không?**

marsbit1 giờ trước

Lời chia sẻ của một trader kỳ cựu: Làm thế nào để giao dịch với kỳ vọng sai lầm của thị trường?

marsbit1 giờ trước

Quan điểm: Mối quan hệ phòng hộ giữa trái phiếu Mỹ và thị trường chứng khoán đã mất hiệu lực, BTC với tư cách là tài sản rủi ro chịu áp lực kép

Tác giả: CryptoSlate / Andjela Radmilac Biên dịch: TechFlow sâu Dẫn nhập: Mối quan hệ phòng hộ truyền thống trong 20 năm qua, theo đó trái phiếu Mỹ tăng khi thị trường chứng khoán giảm và ngược lại, đã hoàn toàn thất bại. Hiện tại, cả hai đang giảm đồng thời, điều này đồng nghĩa với việc "bộ giảm xóc" cuối cùng trong danh mục đầu tư đã biến mất. Bitcoin, với tư cách là tài sản rủi ro ở đầu xa nhất của đường cong, đang phải chịu áp lực kép. Trong hai thập kỷ qua, nhà đầu tư Mỹ được hưởng một loại bảo hiểm miễn phí: trái phiếu kho bạc tăng khi cổ phiếu giảm, giúp bù đắp một phần tổn thất. Cơ chế này đã ngừng hoạt động từ khoảng năm 2020 và chưa được phục hồi. UBS tính toán hệ số tương quan hai tháng giữa chỉ số S&P 500 và lợi suất trái phiếu 10 năm Mỹ là -0.69, mức thấp nhất kể từ năm 1996, cho thấy mức độ biến động đồng bộ chưa từng có trong 30 năm. Lý do chính cho sự thay đổi này là lạm phát. Khi yếu tố tăng trưởng chi phối, cổ phiếu và trái phiếu biến động ngược chiều. Tuy nhiên, kể từ năm 2022, lạm phát đã trở thành yếu tố chủ đạo, và sự biến động của lạm phát (chứ không phải mức độ tuyệt đối) mới là vấn đề then chốt khiến cả hai tài sản cùng chịu áp lực giảm. Các nhà đầu tư hiện đang tìm kiếm sự an toàn mà không có rủi ro thời hạn (duration risk), chuyển sang nắm giữ tiền mặt, tín phiếu và trái phiếu ngắn hạn, trong khi bán ra các trái phiếu dài hạn. Vị trí của Bitcoin lúc này rất nhạy cảm với điều kiện vĩ mô. BTC thường hoạt động tốt khi lợi suất thực giảm, USD suy yếu và điều kiện tài chính nới lỏng. Việc thị trường trái phiếu giảm đã đồng thời loại bỏ ba yếu tố hỗ trợ này. Lợi suất không rủi ro cao hơn làm tăng chi phí cơ hội của việc nắm giữ tài sản không trả lãi như Bitcoin, trong khi cổ phiếu giảm làm giảm khẩu vị rủi ro. Điều này khiến Bitcoin phải hấp thụ cả hai loại áp lực cùng lúc. Vấn đề của Bitcoin là các điều kiện củng cố logic dài hạn của nó (như thâm hụt ngân sách và gánh nặng lãi suất cao) lại gây tổn hại cho nó trong ngắn hạn. Cho đến khi biến động lạm phát giảm bớt và rủi ro tăng trưởng trở lại thành yếu tố chủ đạo, Bitcoin sẽ tiếp tục giao dịch trong một thị trường mà loại tài sản có tính thanh khoản sâu nhất thế giới không còn đóng vai trò hấp thụ cú sốc. Điều này làm mất đi tấm đệm phía dưới mọi tài sản rủi ro, và những tài sản không trả bất kỳ khoản nào để chờ đợi sẽ bị ảnh hưởng nhanh nhất.

marsbit1 giờ trước

Quan điểm: Mối quan hệ phòng hộ giữa trái phiếu Mỹ và thị trường chứng khoán đã mất hiệu lực, BTC với tư cách là tài sản rủi ro chịu áp lực kép

marsbit1 giờ trước

Giao dịch

Giao ngay
活动图片