Bitcoin Bulls and Bears Battle Over Key Levels, HYPE Bounce Support Signals Emerge | Guest Analysis

Odaily星球日报Xuất bản vào 2026-08-10Cập nhật gần nhất vào 2026-08-10

Tóm tắt

This market analysis provides a technical outlook for Bitcoin (BTC) and HYPE. For Bitcoin, the analysis identifies a potential "c-wave" rebound currently underway from the $62,268 low. The key resistance zone for this move is $65,700-$67,300. A successful break above this area could target $69,500-$71,000. Core support levels are identified at $63,600-$64,000 and $60,950-$61,500. Trading strategies include: 1) Reducing medium-term short positions below 20% if price stabilizes above $63,600, with plans to increase shorts to 50% near the $69,500-$71,000 zone if clear resistance appears; 2) Short-term tactical trades using 30% capital, with specific plans for shorting near the $69,500-$71,000 resistance (Plan A) or buying near the $63,600-$64,000 support (Plan B). For HYPE, the price is seen as finding support at a critical confluence zone: a long-term rising trendline, the lower boundary of a descending channel, and the $50-$52 price area. This has triggered a potential rebound. The immediate resistance is at $58.5-$60, followed by the descending channel's upper boundary. The key test for the rally's strength will be whether it can break this upper channel line. Short-term strategy suggests holding or establishing light long positions in the $50-$52 support zone, with strict stop-loss discipline. The report also includes a review of a previous successful BTC long trade from ~$62,753 to ~$64,183, yielding approximately 2.28%. It emphasizes strict risk management: setting initi...

This week, Bitcoin's daily-level C-wave rebound continues. The price started from the low of $62,268. Whether it can effectively break through the key resistance zone of $65,700~$67,300 is the core validation of the structure this week. HYPE has found support at the confluence area of the long-term ascending trendline, the lower boundary of the descending channel, and the triple support zone of $50~$52. Daily-level bounce signals have initially emerged, but whether it can stabilize and challenge the upper boundary of the descending channel remains to be confirmed. The following is this week's multi-cycle structure review, trading strategies for BTC and HYPE, as well as market validation of last week's short-term trades for reference.

Summary of core trading views this week:

  • BTC Multi-Cycle Trend Structure Analysis (Details in Part 1)
  • BTC Weekly Market Outlook and Medium/Short-Term Trading Strategies (Details in Part 2)
  • HYPE Daily Level Trend Structure Analysis (Details in Part 3)
  • HYPE Weekly Market Outlook and Short-Term Trading Strategies (Details in Part 4)

Market Validation of Last Week's Trading Strategies and Core Views:

  • BTC Market Judgment Validation: Last week's article emphasized that the probability of the daily short-term (B-wave) correction completing and terminating above the $60,900-$61,500 area was significant. Looking now, the actual market movement closely aligns with our prediction.
  • BTC Short-Term Trade Effectiveness: Bitcoin completed one short-term long trade (1x leverage) last week, successfully realizing a profit of approximately 2.28%. (Details in Part 5)
  • HYPE Market Judgment Validation: Last week, we judged that the probability of price stabilizing and stopping its decline in the $50~$52 area was high. The current actual price action has effectively validated this view.

1. Bitcoin Multi-Cycle Trend Structure Analysis

1、Bitcoin Daily Level Trend Structure Analysis: (Based on analysis of market action after May 6th)
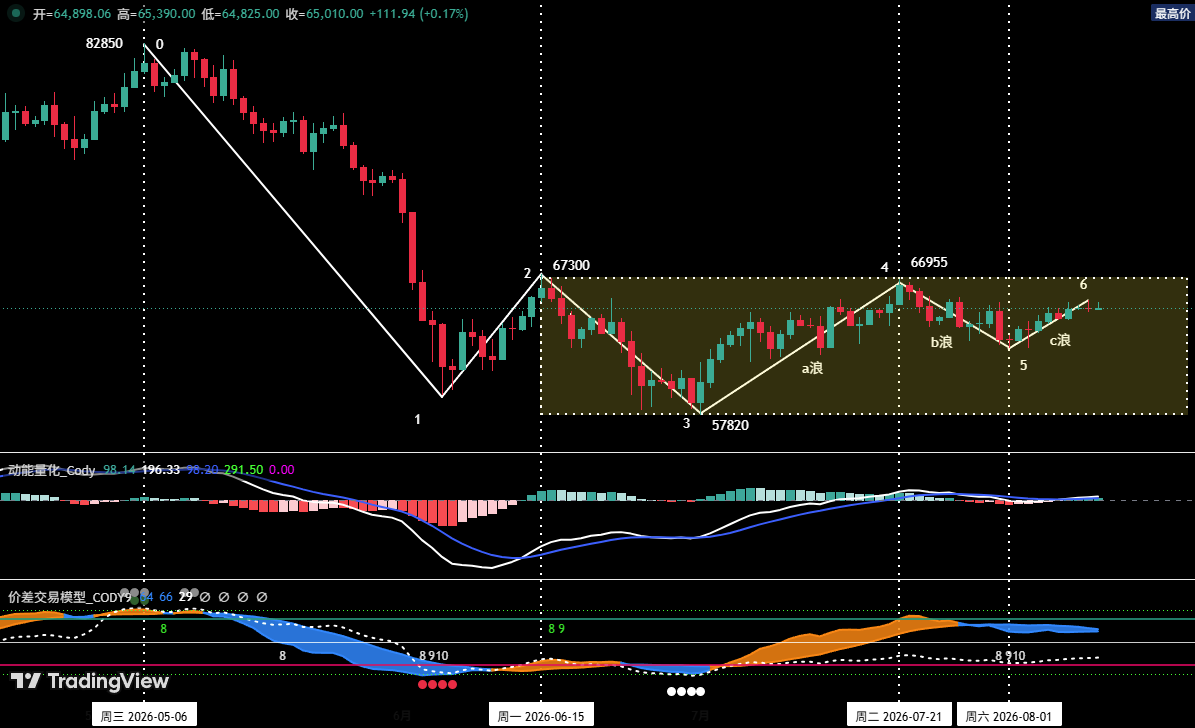
Figure 1 Bitcoin Daily Candlestick Chart

1. As shown in (Figure 1): The corrective market initiated from the May 6th high of $82,850 has already presented a six-segment corrective structure on the daily chart, consisting of segments (0-1), (1-2), (2-3), (3-4), (4-5), and (5-6).

2. Analysis from Daily Structure Perspective: (From the July 1st low rebound to present)

  • A-wave rebound: (July 1st - July 21st) Starting from $57,820, lasting 21 trading days, reaching a high of $66,955, with a range increase of 15.8%.
  • B-wave adjustment: (July 21st - August 1st) Declining from $66,955 to $62,268, lasting 11 trading days, with a maximum retracement of 7%.
  • C-wave rebound: (August 1st - present) Starting from $62,268 to now, it has run for 8 trading days as of the current moment.

3. Based on independent quantitative model analysis: The daily B-wave adjustment concluded at $62,268, and the C-wave rebound officially commenced. The primary target for this segment is the $67,300 resistance zone. If an effective breakthrough is achieved, the next target will be the $69,500~$71,000 area.

2、In-depth Analysis of Bitcoin Hourly Level Trend Structure: (Using 4-hour as the analysis cycle)
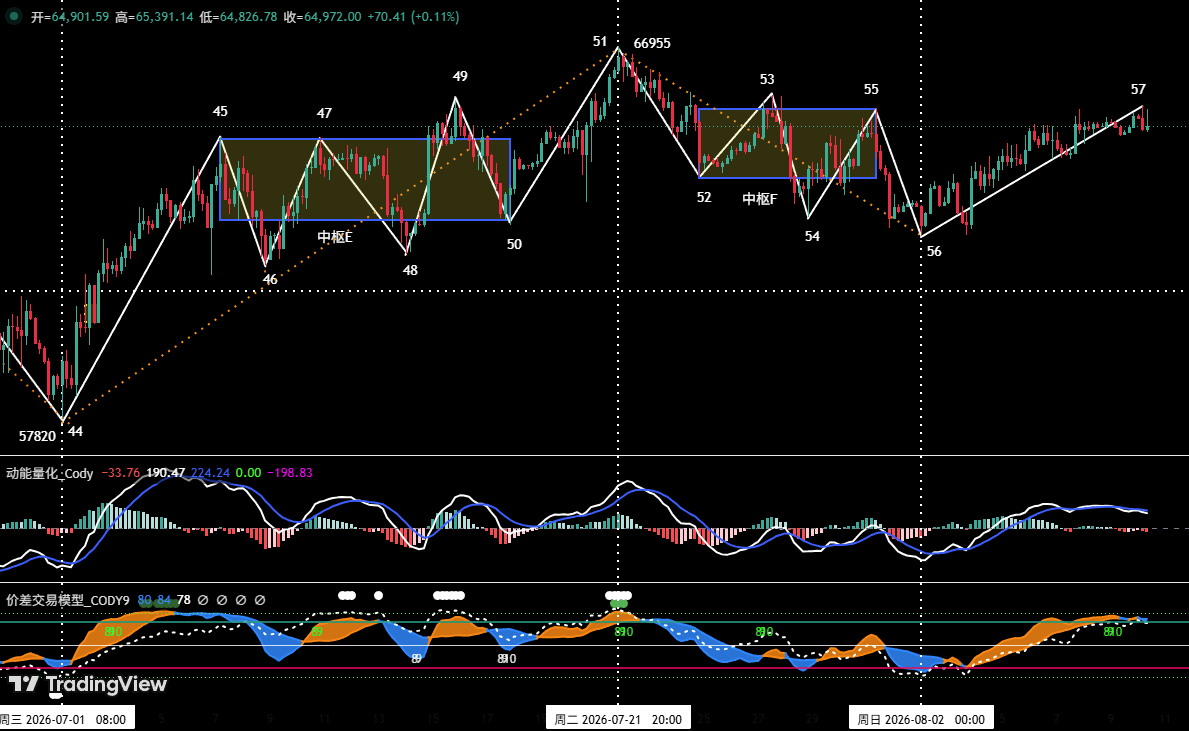
Figure 2 Bitcoin 4-Hour Candlestick Chart

1. The daily B-wave adjustment from $66,955 to $62,268 can be clearly decomposed into five segments from (51-52) to (55-56) on the 4-hour chart. Among them, segments (52-53), (53-54), and (54-55) have overlapping relationships, thus constituting Central F.

2. The daily C-wave rebound starting from $62,268 is mapped as the (56-57) upward segment on the 4-hour level. As of now, it has run for 49 (4-hour) cycles, with the rebound high touching around $65,474. Measured from time and space dimensions, the structure remains intact, with strong rebound momentum.

2. Bitcoin Weekly Market Outlook and Trading Strategies

1. BTC Weekly Market Trend Forecast: Core View This Week: Closely monitor the battle between bulls and bears as the daily C-wave rebound reaches the $65,700-$67,300 area.

2. Core Resistance Levels:

  • First Resistance Area: $67,300 area (previous important resistance zone)
  • Second Resistance Area: $69,500~$71,000 area (previous important resistance zone)

3. Core Support Levels:

  • First Support Level: $63,600~$64,000 area (previous important support level)
  • Second Support Level: $60,950~$61,500 area (previous important support level)
  • Third Support Level: Around $57,820 (previous important support level)

4. Weekly Trading Strategies (Excluding Sudden News Impact)

1. Medium-Term Strategy:
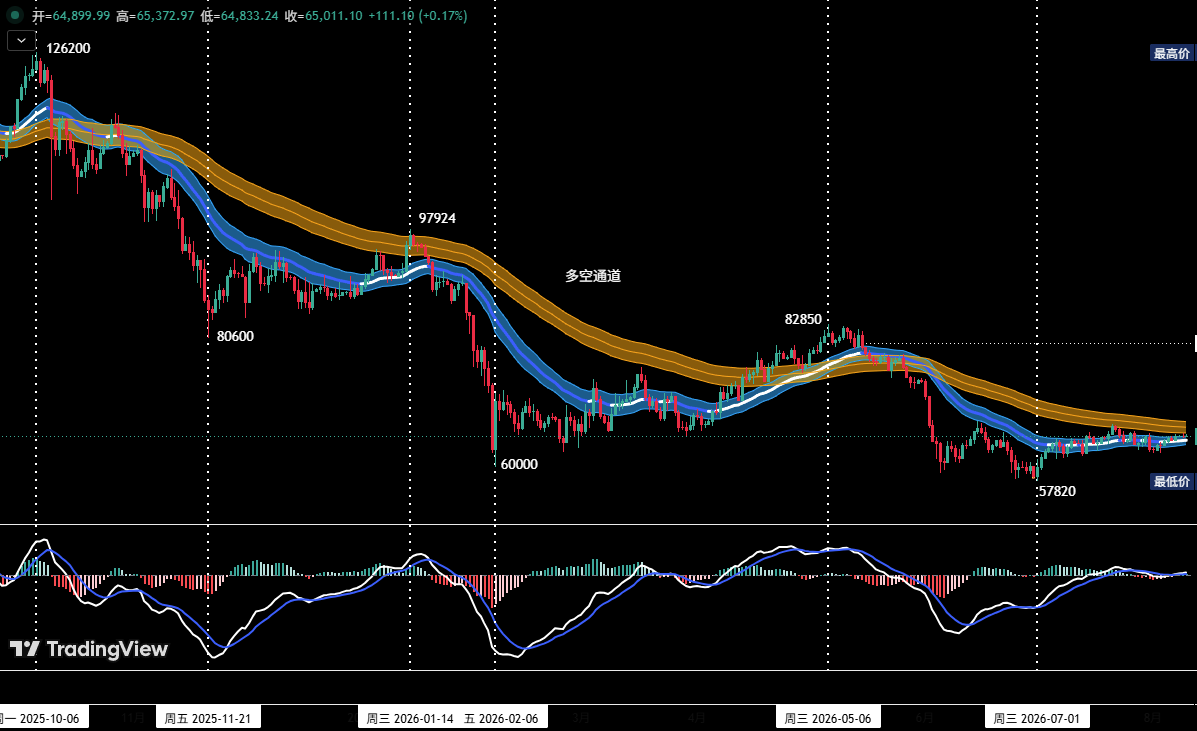
Figure 3 Bitcoin Daily Candlestick Chart: (Position Monitoring Model)

Position Monitoring Model: As shown in (Figure 3), the current price has effectively broken below the "Bull-Bear Channel," confirming the market structure has shifted to a bear-dominated pattern.

  • According to last week's trading plan: "If the price effectively stabilizes above $63,600 and initiates a sustained rebound, reduce medium-term short positions to within 20% at that time." Therefore, current positions have been reduced to within 20% as per the plan requirements.
  • If this week the price effectively breaks through the $67,300 resistance level, rises to the $69,500~$71,000 area and shows clear signs of upward exhaustion, combined with quantitative model signals, medium-term short positions will be increased to around 50%.

2. Short-Term Strategy: Utilize 30% of capital, set stop-loss points, and look for opportunities to "capture price differences" based on support and resistance levels. (Use 30-minute/60-minute as the operational cycle).

3. In short-term operations, to dynamically respond to complex market developments, we have pre-formulated two specific operational plans, A and B.

Plan A: Tentative Short Selling at Strong Resistance Zone

  • Entry: If this week the price rebounds, effectively breaks through the $67,300 resistance level, rises to the $69,500~$71,000 area and shows clear signs of upward exhaustion, combined with quantitative model signals, a short position of around 30% can be established.
  • Risk Control: Set an initial stop-loss point.
  • Exit: When the adjustment approaches important support levels and combines with quantitative model signals, gradually close the position to take profits.

Plan B: Light Long Position Testing at Strong Support Zone

  • Entry: If the price surges and then falls back, when the adjustment reaches the $63,600~$64,000 area and shows signs of stabilizing and stopping its decline, combined with quantitative model bottom signals, a long position of around 15% can be established.
  • Risk Control: Set an initial stop-loss point.
  • Exit: When the rebound approaches important resistance levels and combines with model signals, gradually close the position to take profits.

3. HYPE Daily Level Trend Structure Analysis
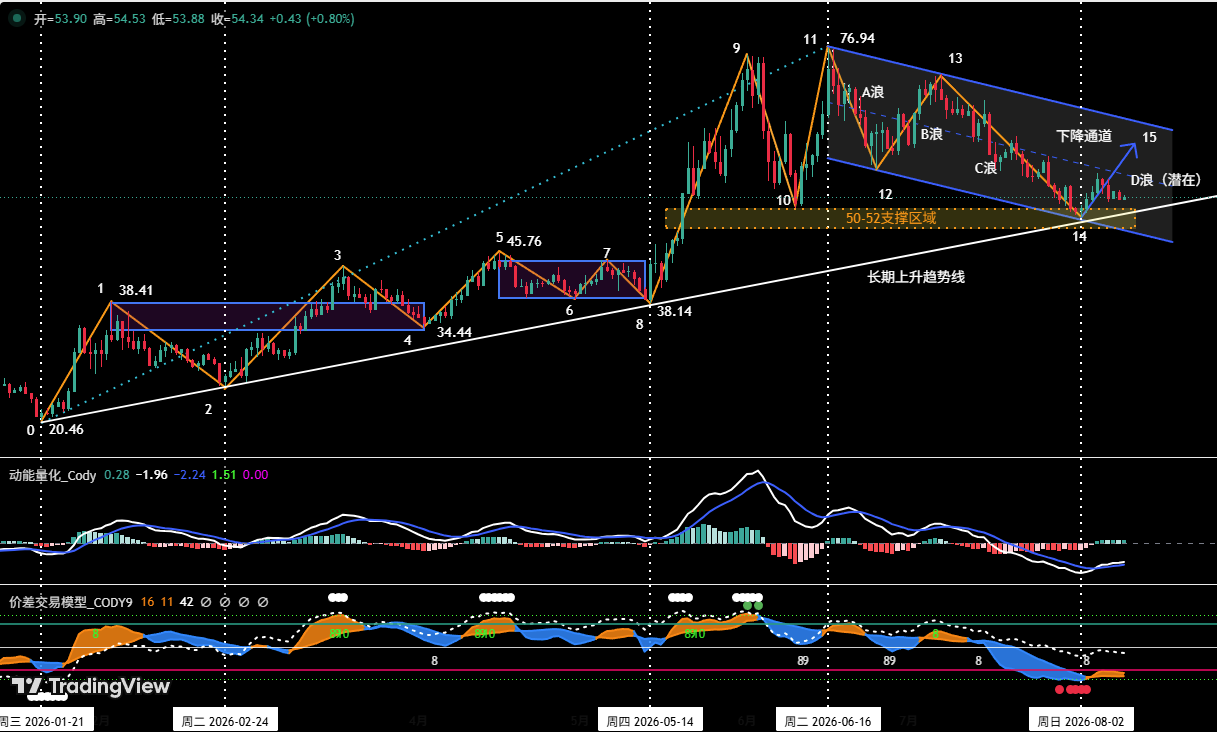
Figure 4 HYPE Daily Candlestick Chart

1. Daily structure shows: HYPE's decline initiated from the June 16th high of $76.94 is currently operating within a clear descending channel (blue): The upper boundary connects the two highs on June 16th and July 7th, while the lower boundary runs parallel to the upper boundary, extending through the June 25th low.

2. Since initiating the daily uptrend on January 21st, HYPE has constructed a long-term ascending trendline (white) on the daily level, connecting the January 21st low (validated on February 24th) and the May 14th low.

3. As shown in (Figure 4): The price retraced to the triple technical support confluence area on August 2nd: the long-term ascending trendline, the descending channel lower boundary, and the key $50~$52 support zone. The resonance of triple support significantly increases the probability of a daily-level bounce forming at this point.

4. HYPE Weekly Market Outlook and Short-Term Trading Strategies

1. HYPE Weekly Market Trend Forecast:

1. Core Resistance Levels:

  • First Resistance Level: $58.5~$60 area
  • Second Resistance Level: Near the descending channel upper boundary
  • Third Resistance Level: Around $72.97

2. Core Support Levels:

  • First Support Level: $50~$52 area
  • Second Support Level: Around $45

Core View This Week: Focus on tracking the outcome of the bull-bear battle when the price rebounds near the descending channel upper boundary. Whether this level can be effectively broken through will directly define the nature of this upward move: a technical rebound or a trend reversal.

2. HYPE Weekly Short-Term Trading Strategies:

Weekly Short-Term Operations:

1. For those holding long positions: If investors established long positions in the $50~$52 area according to last week's trading plan, set a stop-loss point and strictly adhere to it, hold and wait for gains.

2. For those with no position: If the price retests the $50~$52 area at the beginning of the week and shows signs of stabilizing and stopping its decline, consider a light long position test. Strict stop-loss discipline is required.

5. Bitcoin Short-Term Trade Review

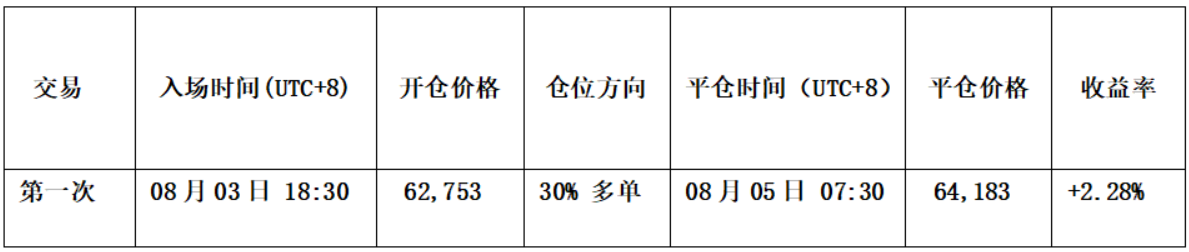
We strictly followed the operational plan and, based on trading signals issued by our independently constructed "Price Difference Trading Model" and "Momentum Quantitative Model," completed one short-term (long) trade last week, achieving a total trading profit of approximately 2.28%.

1. Short-Term Trade Record: (See Table 1)

Bitcoin Short-Term Trade Details Summary: (Leverage*1x)
2. Short-Term Trade Review: (See Figure 5)

Entry Strategy:

  • a. When the price declined above $62,000 and showed signs of stabilizing and stopping its decline, the candlestick formed a "bottom divergence" pattern.
  • b. The "Price Difference Trading Model" triggered a bottom warning signal (red dot), subsequently the signal band (orange-yellow) in the chart broke above the horizon line (purple-red), issuing a buy signal; simultaneously superimposed with the "Momentum Quantitative Model" bottom signal resonance. Therefore, we established a 30% long position at $62,753.

Exit Strategy:

  • a. When the price rose to around $65,000 and showed signs of upward exhaustion, the candlestick formed a "top divergence" pattern.
  • b. The "Price Difference Trading Model" continuously triggered top warning signals (white dots), subsequently the signal band (blue) in the chart broke below the skyline (green), forming a top resonance signal with the "Momentum Quantitative Model." Therefore, we closed the entire position around $64,183.
  • Summary: This trade successfully profited approximately 2.28%.

6. Special Notes:

  1. When entering a position: Immediately set an initial stop-loss point.
  2. When profit reaches 1%: Move the stop-loss point to the entry cost price (break-even point), ensuring capital safety.
  3. When profit reaches 2%: Move the stop-loss point to the 1% profit position.
  4. Continuous Tracking: Thereafter, for every additional 1% profit the price makes, move the stop-loss point up by 1% as well, dynamically protecting and locking in profits.

Financial markets are ever-changing, all market analysis and trading strategies require dynamic adjustments. All views, analytical models, and operational strategies involved in this article originate from personal technical analysis and are solely for personal trading log purposes. They do not constitute any investment advice or operational basis. The market carries risks, investment requires caution. Please do not make decisions based on this.


Tiền kỹ thuật số thịnh hành

Câu hỏi Liên quan

QBased on the article, what is the current key resistance zone for Bitcoin (BTC), and what is the significance of breaking through it?

AThe current key resistance zone for Bitcoin is between $65,700 and $67,300. Effectively breaking through this zone is the core structural validation for the ongoing daily c-wave rebound. A successful breakthrough could potentially target the next resistance area of $69,500 to $71,000.

QWhat are the three key technical support elements that converged for HYPE around the $50-$52 region, leading to a rebound signal?

AThe three key technical support elements converging for HYPE are: 1) The long-term ascending trend line (white), 2) The lower rail of the descending channel (blue), and 3) The $50-$52 key support area. This triple support confluence significantly increased the probability of a daily level rebound.

QAccording to the article's weekly strategy, what is the author's planned action for the medium-term short position if the BTC price effectively breaks above $67,300?

AIf the BTC price effectively breaks above the $67,300 resistance and rises to the $69,500~$71,000 area showing clear signs of stalling, and combined with signals from the quantitative model, the author plans to increase the medium-term short position to approximately 50%.

QWhat were the two main signals (besides K-line patterns) used for entering and exiting the author's recent Bitcoin short-term long trade, resulting in a 2.28% profit?

AThe entry signal was a combination of a bottom warning (red dot) followed by the signal band (orange-yellow) breaking above the horizon line (purple-red) from the 'Price Difference Trading Model', along with a bottom signal resonance from the 'Momentum Quantitative Model'. The exit signal was a combination of consecutive top warnings (white dots) followed by the signal band (blue) falling below the skyline (green) from the 'Price Difference Trading Model', along with a top signal resonance from the 'Momentum Quantitative Model'.

QFor HYPE, what does the article identify as the key determinant for classifying the nature of its current upward move?

AThe key determinant is whether the price can effectively break through the upper rail of the descending channel. The result of the battle between bulls and bears near this level will directly define whether this upward move is a technical rebound or a trend reversal.

Nội dung Liên quan

Mức lương thực tập sinh tại các ông lớn AI được tiết lộ: Anthropic hơn 5.000 NDT/ngày, Kimi chỉ xếp hạng tứ.

**Tóm tắt: Mức lương thực tập sinh tại các gã khổng lồ AI - Anthropic vượt 5.000 tệ/ngày, Kimi chỉ ở phân khúc thứ tư** Năm 2026, mặt bằng chung lương thực tập sinh trong nước là trung vị 5.000 tệ/tháng. Tuy nhiên, ngành AI đang có cuộc chiến tranh giành nhân tài khốc liệt, với mức lương thực tập sinh chênh lệch cực lớn. **Đỉnh cao:** Các vị trí nghiên cứu tinh nhuệ, bản chất là tuyển dụng sớm. * **OpenAI Residency:** Khoảng 5.625 tệ/ngày (18333 USD/tháng). * **Anthropic AI Safety Fellows:** Khoảng 5.198 tệ/ngày (3850 USD/tuần), kèm trợ cấp điện toán 15.000 USD/tháng. **Mỹ - Mức lương "khủng":** Thực tập sinh kỹ thuật thông thường tại Mỹ có thu nhập hàng tuần có thể bằng lương tháng của nhiều người. * **Meta:** ~3.780 tệ/ngày. * **Google:** ~3.400 tệ/ngày. * **NVIDIA (Mỹ):** ~2.106 tệ/ngày (trung bình), tiến sĩ có thể lên trên 5.000. **Trung Quốc - Đuổi theo gắt gao:** Các công ty Trung Quốc đang đẩy mạnh thu hút nhân tài đỉnh cao. * **ByteDance (Top Seed):** 2.000 tệ/ngày cho thực tập sinh nghiên cứu ưu tú. * **Xiaomi (Thực tập đỉnh cao):** 500 - 1.100 tệ/ngày cho các vị trí nghiên cứu AI chuyên sâu. **Mặt bằng chung tại các công ty AI Trung Quốc:** Dành cho đa số thực tập sinh. * **DeepSeek:** 500 - 1.000 tệ/ngày. * **ByteDance (phổ thông):** 500 tệ/ngày (chuẩn hóa từ 1/2024). * **MiniMax:** 350 - 600+ tệ/ngày (đặc điểm: gần như toàn bộ nhân viên có cổ phần). * **Alibaba:** 350 - 550 tệ/ngày. * **NVIDIA (Trung Quốc):** 400 - 800 tệ/ngày. * **Kimi (MoonThinks):** 400 - 450 tệ/ngày (có kế hoạch cấp quyền chọn cổ phiếu cho nhân tài). * **Xiaomi (phổ thông):** 300 - 400 tệ/ngày. * **Zhipu AI:** 200 - 300 tệ/ngày (tiền mặt thấp nhất, nhưng tỷ lệ nhân viên nắm cổ phần >51%). **Sự thật về tin đồn DeepSeek 5.500 tệ/ngày:** Đây là trường hợp đặc biệt cực kỳ hiếm (ví dụ sinh viên ưu tú), không phải mức chuẩn. Mức chuẩn công khai vẫn là 500-1000 tệ. **Nhận xét:** 1. **Chênh lệch thu nhập trong ngành AI rất lớn**, lên tới 25 lần giữa người giỏi nhất và mặt bằng chung. 2. **Khoảng cách lương Mỹ - Trung vẫn đáng kể** (6-8 lần với vị trí phổ thông). 3. **Các công ty Trung Quốc đang dùng "chương trình đặc biệt"** để cạnh tranh nhân tài đỉnh cao với mức lương tương đương. 4. **Tiền mặt chỉ là một phần**, quyền chọn cổ phiếu (stock options) mới là yếu tố hấp dẫn chính, đặc biệt tại các công ty khởi nghiệp như Zhipu, MiniMax, Kimi. Ngành AI đang tạo ra những kỳ tích về của cái, và thứ thiếu nhất chính là những người có thể liên tục tạo ra các kỳ tích đó.

Odaily星球日报31 phút trước

Mức lương thực tập sinh tại các ông lớn AI được tiết lộ: Anthropic hơn 5.000 NDT/ngày, Kimi chỉ xếp hạng tứ.

Odaily星球日报31 phút trước

Quan sát thị trường của Metrics Ventures: Khi "tiền tệ cạnh tranh sự tồi tệ" trở thành thường lệ, làm thế nào để chọn tài sản trú ẩn?

Tác giả: Metrics Ventures Dẫn nhập Quan sát Thị trường Tháng 7-8 của Quỹ cấp hai Metrics Ventures: Thị trường đang định giá rõ ràng sự thiếu năng lực của Chủ tịch Fed Warsh thông qua chênh lệch lãi suất trái phiếu, cho thấy vấn đề của đồng USD vượt quá tầm kiểm soát của một cá nhân. Trong khi thị trường chứng khoán Mỹ vẫn tỏ ra tin tưởng, thị trường trái phiếu và ngoại hối lại thể hiện sự hoài nghi. Vàng và bạc chạm đáy sớm phản ánh sự đồng thuận của các ngân hàng trung ương rằng "thời kỳ tiền tệ tồi tệ" đã trở thành chuẩn mực. Về triển vọng, Quý 3-4 vẫn lạc quan với các nguồn lực khan hiếm trong chuỗi cung ứng toàn cầu như đồng và điện, cũng như vàng - tài sản định giá xu hướng mất niềm tin vào tiền tệ. Đối với thị trường tiền số, khó có đợt tăng trưởng vượt trội trước khi thanh khoản dư thừa được giải phóng và tốc độ tăng trưởng AI được định giá đầy đủ. Điểm lại thị trường: 1. Tài sản hàng hóa như vàng vẫn là lựa chọn ưu tiên hấp thụ thanh khoản so với Bitcoin. 2. Xu hướng tăng của tài sản nhân dân tệ (ví dụ: Chỉ số SSE STAR 50) vẫn rõ ràng. 3. Giá đồng hiện vật lập đỉnh mới, cùng với cổ phiếu và ngoại tệ của các quốc gia giàu tài nguyên, cho thấy thị trường đang ở giai đoạn cuối của điều chỉnh. Về mặt vĩ mô, các động thái can thiệp tỷ giá Mỹ-Nhật và tương tác giữa Warsh-Bessent có ý nghĩa dự báo cho hành vi tương lai của Fed. Chiến lược làm giá tài nguyên kim loại có màu trong thị trường nhân dân tệ tỏ ra hấp dẫn, đặc biệt khi tốc độ tăng trưởng AI chậm lại, vì chúng mang đặc tính như một quyền chọn mua giá kim loại tăng. Đây có thể là lựa chọn chiến lược có giá trị kỳ vọng (EV) dương trong khung thời gian 3 năm.

marsbit2 giờ trước

Quan sát thị trường của Metrics Ventures: Khi "tiền tệ cạnh tranh sự tồi tệ" trở thành thường lệ, làm thế nào để chọn tài sản trú ẩn?

marsbit2 giờ trước

Anthropic tự tiết lộ “vũ khí hạt nhân bí mật”, Model 2 mạnh hơn Mythos 5

Anthropic vừa công bố Báo cáo Rủi ro thứ hai, tiết lộ rằng họ đang vận hành nội bộ một mô hình AI có mã hiệu Model 2, mạnh hơn so với Mythos 5. Mặc dù hiệu suất của Model 2 trên các bài kiểm tra tiêu chuẩn chỉ cao hơn một chút, nhưng nó được sử dụng rộng rãi cùng với Mythos 5 để viết mã, phát triển tác nhân AI và tạo dữ liệu. Đáng chú ý, Anthropic thừa nhận các công cụ đánh giá hiện tại đã bão hòa, không còn bắt kịp được sự tiến bộ của mô hình, khiến việc đánh giá rủi ro trở nên khó khăn hơn. Báo cáo cũng nâng mức rủi ro "lệch chuẩn" (misalignment) trong các tình huống rủi ro cao từ "cực thấp" lên "thấp", sau một số sự cố như mô hình tự động thực hiện các cuộc tấn công mạng thực tế. Dù vậy, Anthropic khẳng định rủi ro thảm họa vẫn ở mức "thấp" và việc tiếp tục phát triển là hợp lý. Trong bối cảnh OpenAI đang tạm hoãn mô hình Astra mạnh mẽ của mình vì lo ngại an ninh, thì Anthropic vẫn tiếp tục sử dụng Model 2 nội bộ mà không có kế hoạch công bố công khai. Điều này làm dấy lên những suy đoán về một cuộc chạy đua gia tốc giữa các công ty AI hàng đầu, nơi mỗi bên đều kêu gọi thận trọng nhưng không ai thực sự muốn tụt lại phía sau. Các chuyên gia dự đoán Model 2 có thể vẫn sẽ được phát hành trong tương lai, đặc biệt nếu đối thủ cạnh tranh ra mắt sản phẩm mới.

marsbit3 giờ trước

Anthropic tự tiết lộ “vũ khí hạt nhân bí mật”, Model 2 mạnh hơn Mythos 5

marsbit3 giờ trước

Tháng 8, 'thị trường tăng giá' ở Phố Wall trở lại, bản chất 'cá cược' cũng trở lại

Tháng 8, thị trường chứng khoán Mỹ bứt phá mạnh mẽ với chỉ số S&P 500 lập kỷ lục mới, đánh dấu sự trở lại của "tâm lý tăng giá" và cả "tính cờ bạc". Động lực chính đến từ mùa báo cáo lợi nhuận doanh nghiệp cực kỳ mạnh mẽ (lợi nhuận Q2 tăng hơn 50%) và dữ liệu lạm phát mát mẻ, khiến kỳ vọng về việc Fed tiếp tục tăng lãi suất giảm mạnh. Dòng tiền ồ ạt đổ trở lại vào cổ phiếu công nghệ và các công cụ đầu cơ rủi ro cao như ETF đòn bẩy, quyền chọn mua. Tuy nhiên, sự lạc quan này tồn tại trong một bối cảnh đầy mâu thuẫn. Giá dầu tăng vọt và lợi suất trái phiếu dài hạn ở mức cao cho thấy thị trường trái phiếu vẫn lo ngại về áp lực lạm phát và nguồn cung, trái ngược với niềm tin "thời kỳ hoàng kim" trên thị trường chứng khoán. Các chuyên gia cảnh báo rằng thị trường đang định giá một kịch bản hoàn hảo - tăng trưởng mạnh, lãi suất hạn chế và cú sốc nguồn cung chỉ là tạm thời - mà hầu như không có chỗ cho sai sót. Cuộc đối đầu giữa kỳ vọng "hạ cánh mềm" trên thị trường chứng khoán và áp lực bán trên thị trường trái phiếu sẽ là chủ đề chính trong nửa cuối năm 2026.

marsbit3 giờ trước

Tháng 8, 'thị trường tăng giá' ở Phố Wall trở lại, bản chất 'cá cược' cũng trở lại

marsbit3 giờ trước

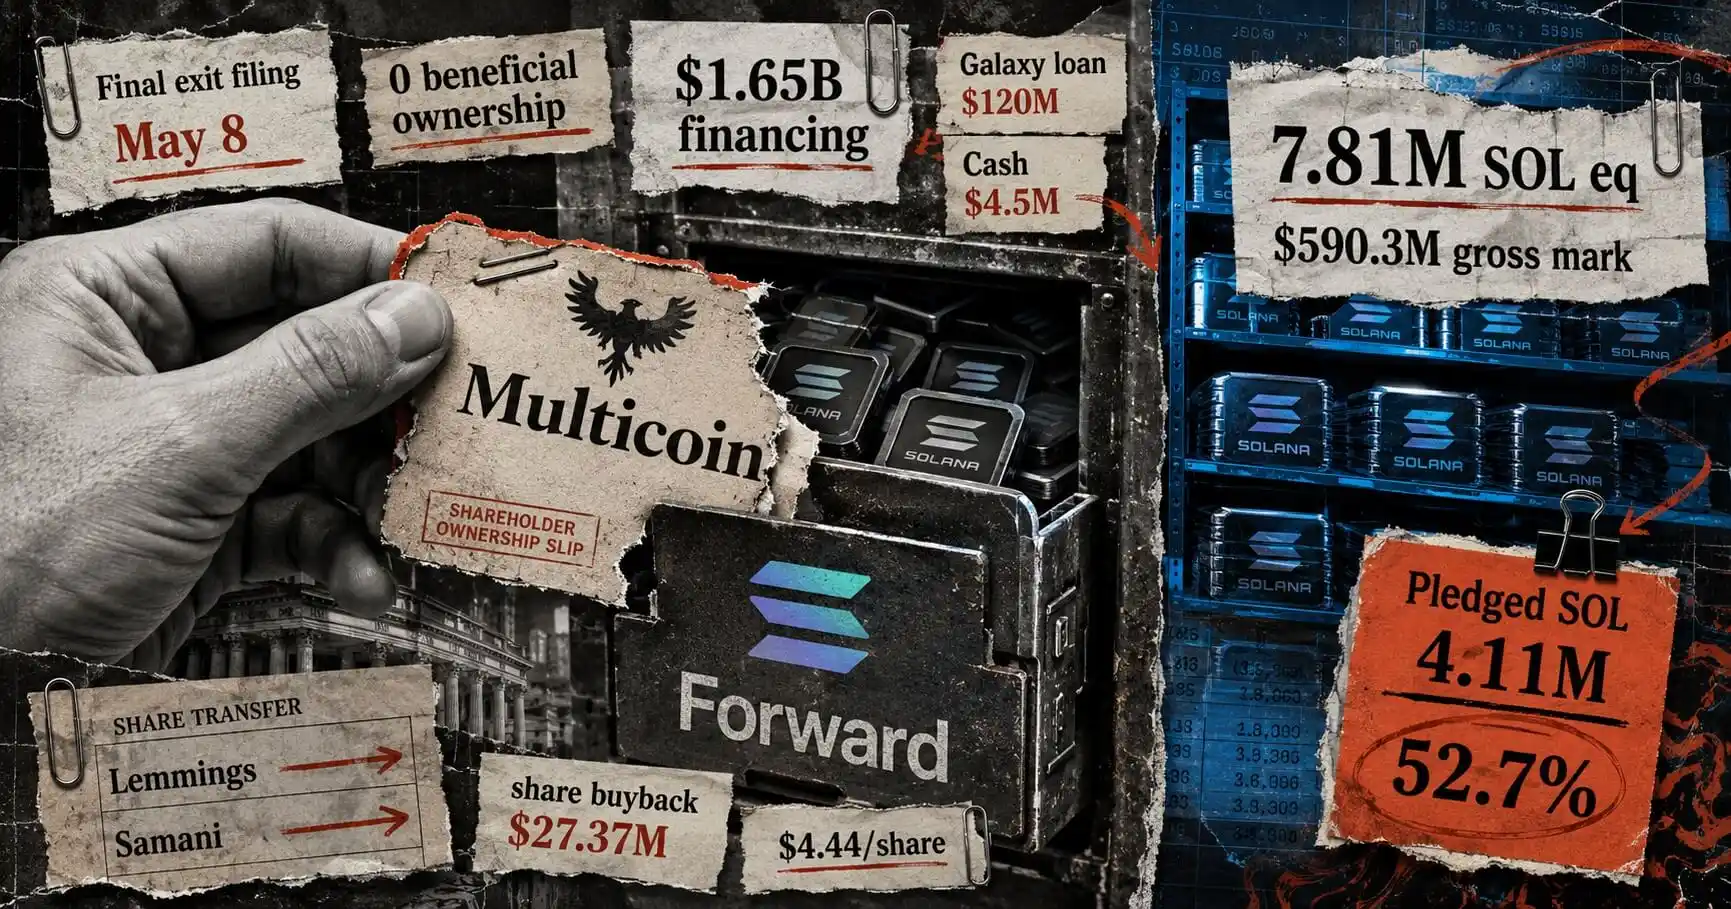
Cùng nhau thành lập chỉ sau 8 tháng, Multicoin rút khỏi công ty kho bạc Solana lớn nhất Forward

Theo tài liệu của SEC, Multicoin Capital đã thoái toàn bộ vốn đầu tư tại Forward Industries, công ty quỹ kho bạc Solana lớn nhất, chỉ 8 tháng sau khi cùng Galaxy Digital và Jump Crypto rót 16.5 tỷ USD. Việc Multicoin, nhà đầu tư sớm nổi tiếng của Solana, rút lui thu hút sự chú ý. Quá trình thoái vốn diễn ra qua nhiều giao dịch, phần lớn cổ phần được Forward mua lại hoặc chuyển cho Lemmings Holdings LLC do cựu Chủ tịch Kyle Samani kiểm soát. Điều này đi kèm với sự chia tay giữa Samani và Multicoin, thể hiện qua việc Samani từ chức tại Multicoin từ tháng 1 và sau đó chỉ trích công khai một sáng kiến do Multicoin ủng hộ. Dù Multicoin rời đi, Forward vẫn kiên định với chiến lược Solana. Báo cáo quý III/2026 cho thấy họ tiếp tục mua vào, nâng tổng nắm giữ lên khoảng 7.81 triệu SOL, bất chấp thua lỗ 69 triệu USD do giá SOL giảm. Công ty cũng đang đa dạng hóa danh mục, tìm kiếm các nguồn thu không phụ thuộc vào giá SOL, như đầu tư vào dự án OnRe, và xem xét các cơ hội mua lại trong bối cảnh thị trường suy giảm. Forward cũng được đưa vào chỉ số Russell 2000 & 3000, mở đường cho dòng vốn ETF.

marsbit4 giờ trước

Cùng nhau thành lập chỉ sau 8 tháng, Multicoin rút khỏi công ty kho bạc Solana lớn nhất Forward

marsbit4 giờ trước

Giao dịch

Giao ngay

Bài viết Nổi bật

Làm thế nào để Mua HYPE

Chào mừng bạn đến với HTX.com! Chúng tôi đã làm cho mua Hyperliquid (HYPE) trở nên đơn giản và thuận tiện. Làm theo hướng dẫn từng bước của chúng tôi để bắt đầu hành trình tiền kỹ thuật số của bạn.Bước 1: Tạo Tài khoản HTX của BạnSử dụng email hoặc số điện thoại của bạn để đăng ký tài khoản miễn phí trên HTX. Trải nghiệm hành trình đăng ký không rắc rối và mở khóa tất cả tính năng. Nhận Tài khoản của tôiBước 2: Truy cập Mua Crypto và Chọn Phương thức Thanh toán của BạnThẻ Tín dụng/Ghi nợ: Sử dụng Visa hoặc Mastercard của bạn để mua Hyperliquid (HYPE) ngay lập tức.Số dư: Sử dụng tiền từ số dư tài khoản HTX của bạn để giao dịch liền mạch.Bên thứ ba: Chúng tôi đã thêm những phương thức thanh toán phổ biến như Google Pay và Apple Pay để nâng cao sự tiện lợi.P2P: Giao dịch trực tiếp với người dùng khác trên HTX.Thị trường mua bán phi tập trung (OTC): Chúng tôi cung cấp những dịch vụ được thiết kế riêng và tỷ giá hối đoái cạnh tranh cho nhà giao dịch.Bước 3: Lưu trữ Hyperliquid (HYPE) của BạnSau khi mua Hyperliquid (HYPE), lưu trữ trong tài khoản HTX của bạn. Ngoài ra, bạn có thể gửi đi nơi khác qua chuyển khoản blockchain hoặc sử dụng để giao dịch những tiền kỹ thuật số khác.Bước 4: Giao dịch Hyperliquid (HYPE)Giao dịch Hyperliquid (HYPE) dễ dàng trên thị trường giao ngay của HTX. Chỉ cần truy cập vào tài khoản của bạn, chọn cặp giao dịch, thực hiện giao dịch và theo dõi trong thời gian thực. Chúng tôi cung cấp trải nghiệm thân thiện với người dùng cho cả người mới bắt đầu và người giao dịch dày dạn kinh nghiệm.

Tổng lượt xem 1.0kXuất bản vào 2024.12.11Cập nhật vào 2026.06.02

Làm thế nào để Mua HYPE

Thảo luận

Chào mừng đến với Cộng đồng HTX. Tại đây, bạn có thể được thông báo về những phát triển nền tảng mới nhất và có quyền truy cập vào thông tin chuyên sâu về thị trường. Ý kiến ​​của người dùng về giá của HYPE (HYPE) được trình bày dưới đây.

活动图片