Executive Summary
- Ethereum’s rally continues to accelerate, with the asset reaching $4.3k, its highest price since December 2021 and just -12.5% below its prior all-time high. However, growing speculation in the leading altcoin has driven open interest across the top altcoins to a combined record of $47B. This buildup of leverage creates a more volatile backdrop, with markets becoming increasingly reflexive to price shocks.
- Bitcoin momentum remains robust across key on-chain indicators. Short-Term Holder realized losses during the recent pullback to $112K were notably subdued, while the vast majority of investors remain in a profitable position.
- Options traders continue to price in a low-volatility regime, with at-the-money implied volatility (IV) across all tenors at multi-year lows. Historically, periods of exceptionally low IV have preceded sharp expansions in realized volatility, acting as a contrarian signal.
- Ethereum is approaching the +1σ Active Realized Price level at $4.7k, a zone that has historically triggered heightened sell-side pressure. Meanwhile, Bitcoin is nearing its +1σ Short-Term Holder cost-basis at $127K, a level that has consistently acted as cycle resistance, where a decisive breakout could open the path toward the +2σ level at $144K.
Altcoins Rally
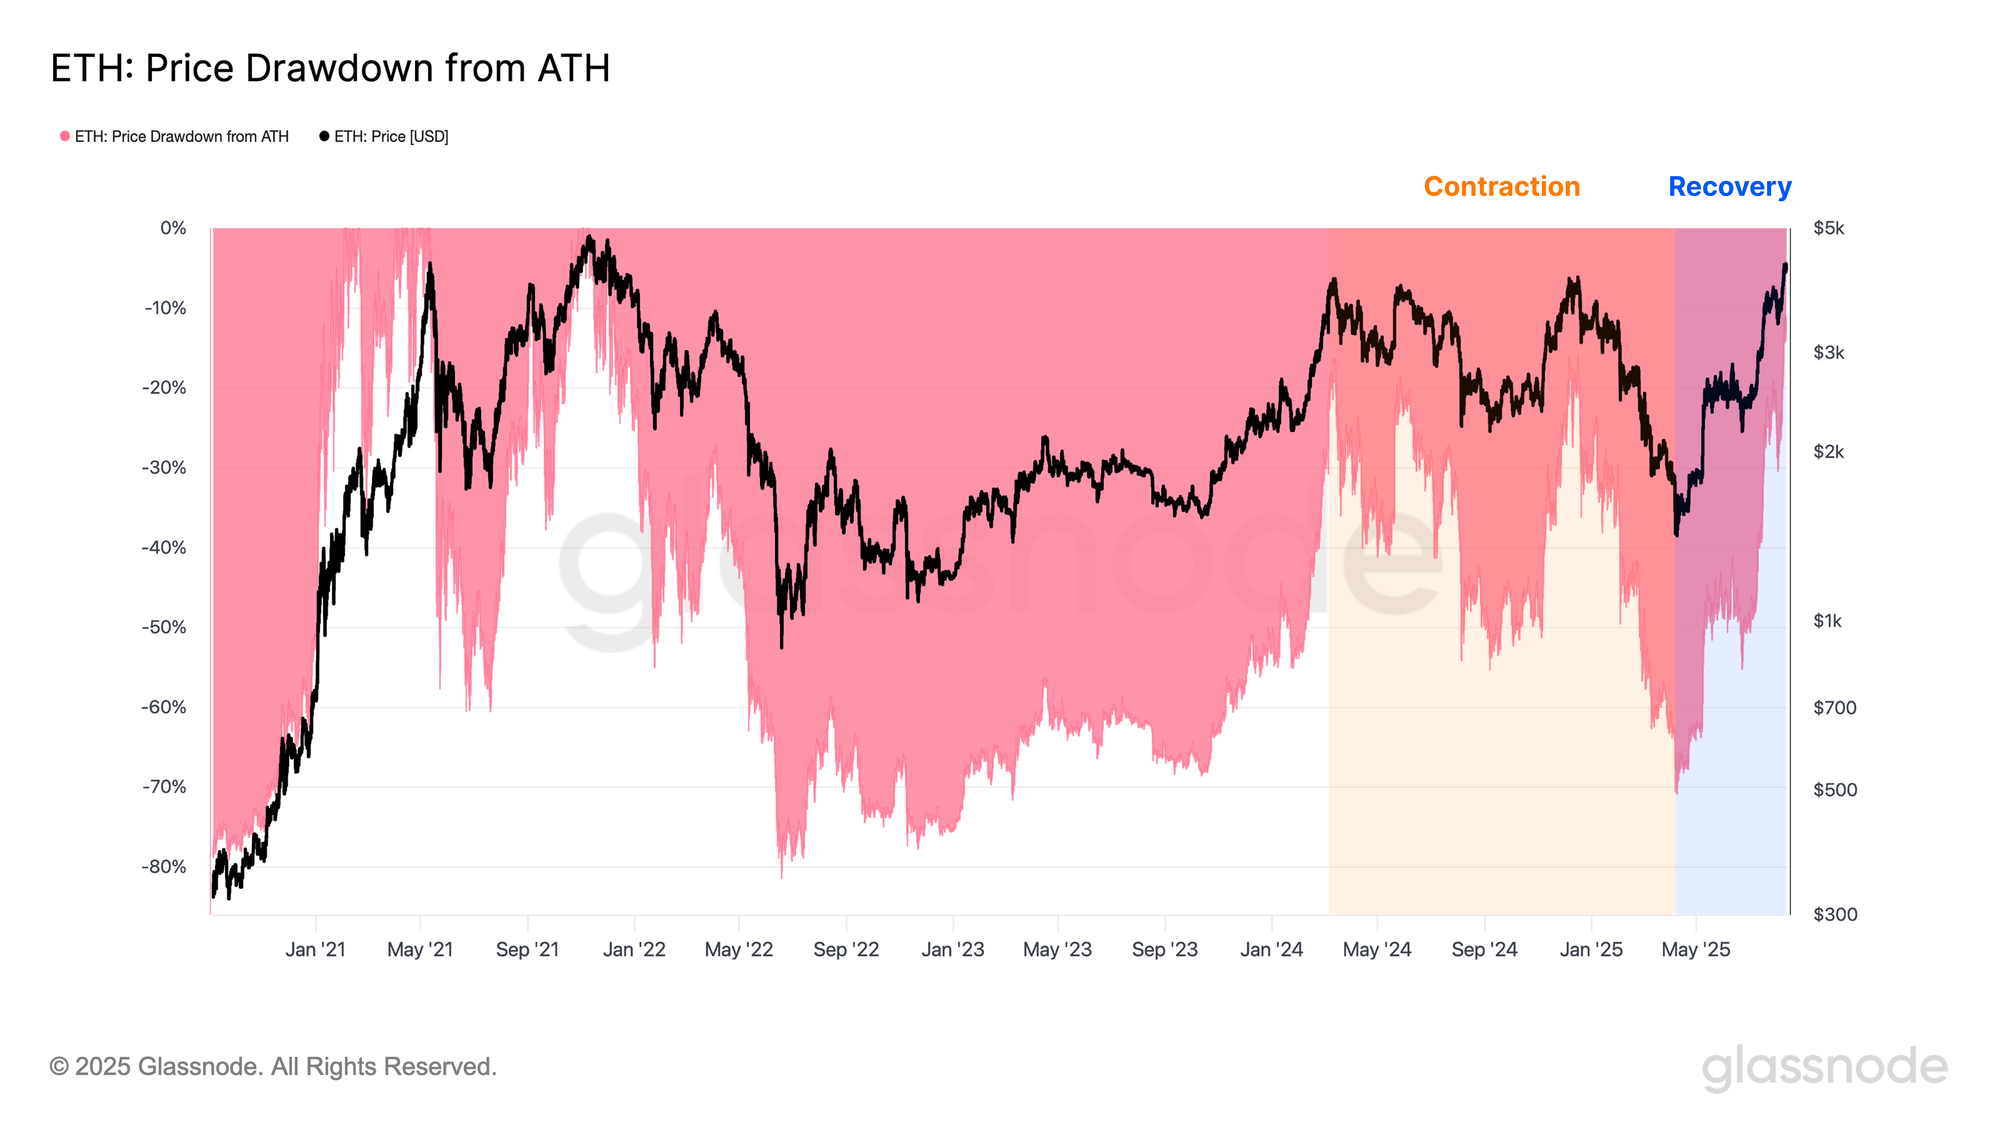
Momentum in digital asset markets continues to accelerate, with Ethereum at the forefront. The asset has climbed from $1.5K in April to $4.3K, its highest level since December 2021 and only 12.5% below its all-time high of $4.8K. Historically, Ethereum has served as a bellwether for broader altcoin performance, and its recent strength is now fueling increased speculation further along the risk curve.
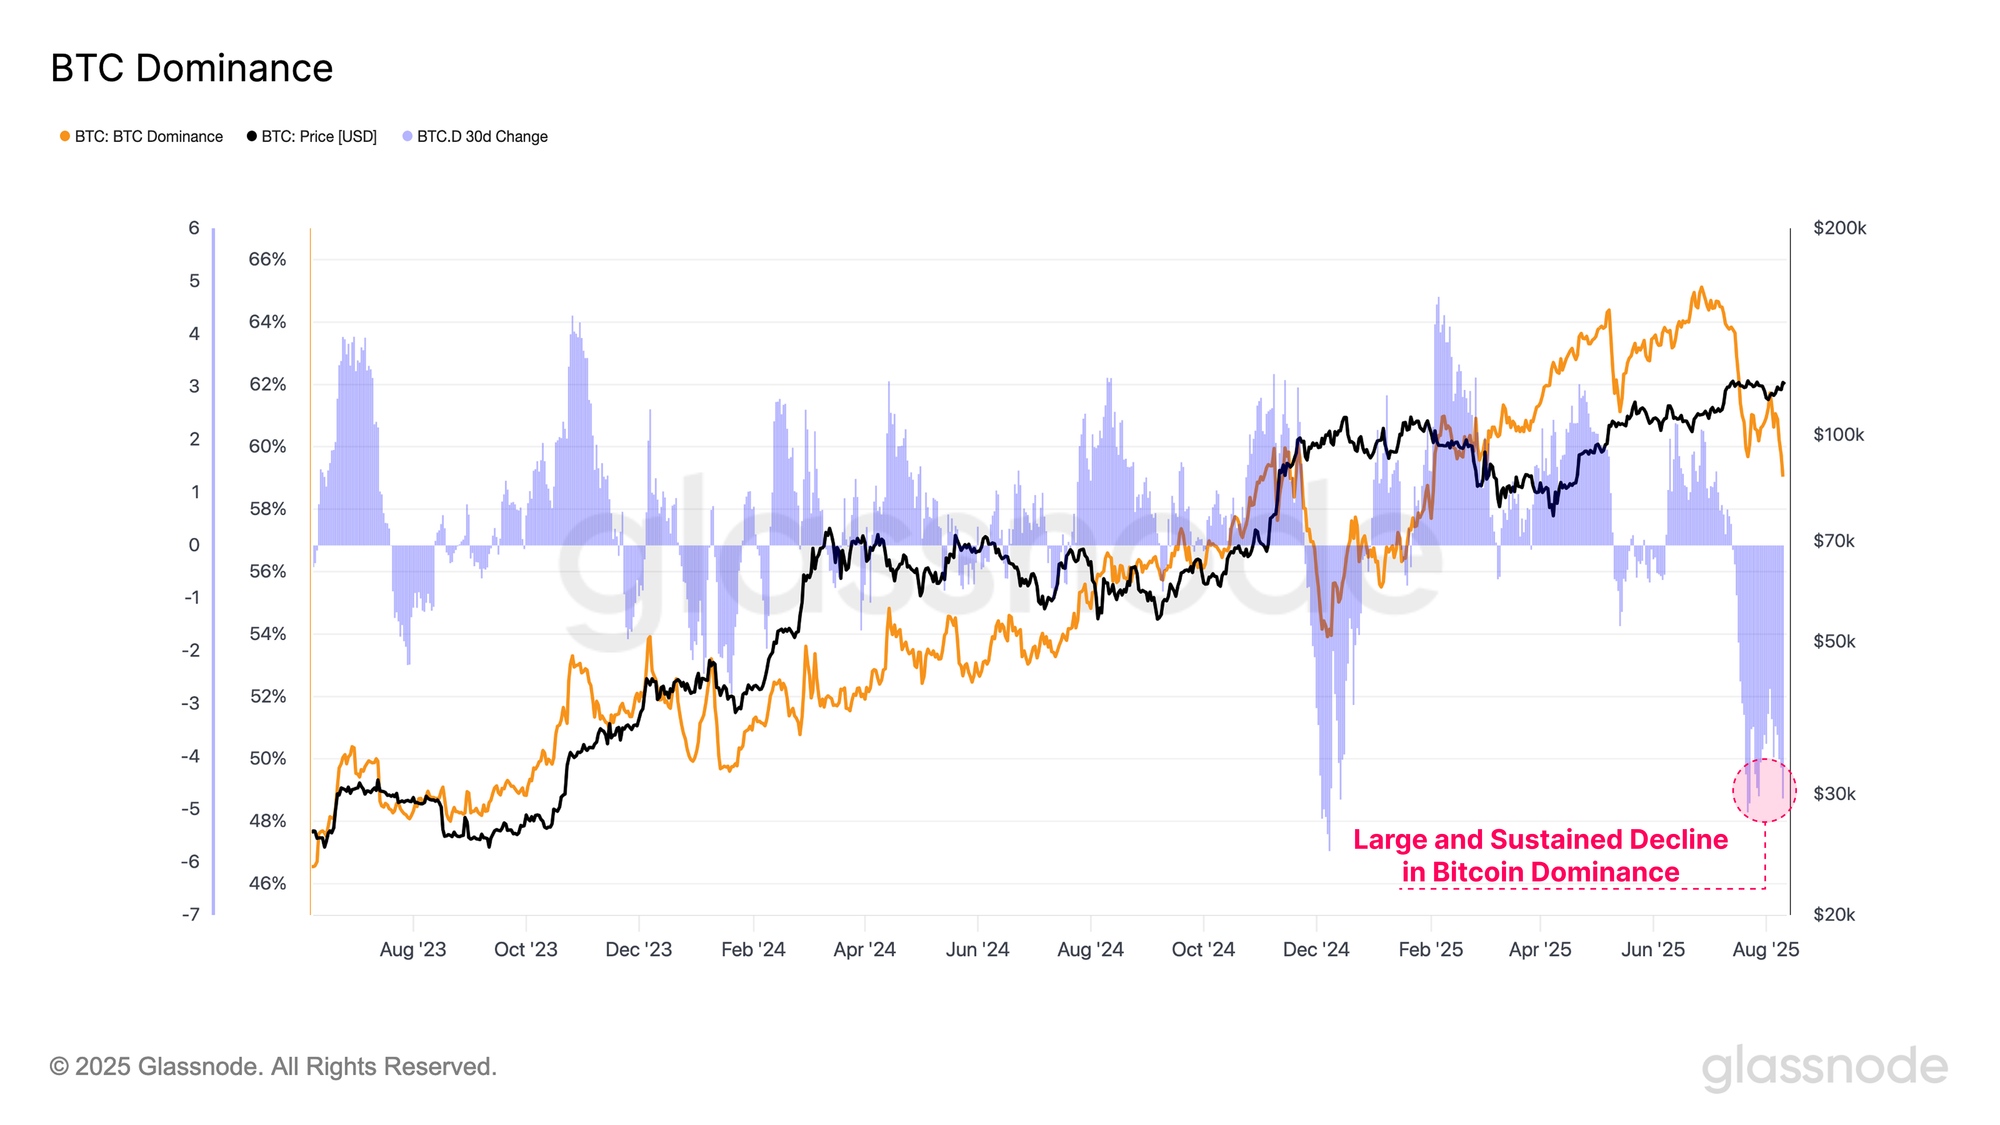
This rotation of capital is also reflected in the Bitcoin Dominance metric, which tracks Bitcoin’s share of total digital asset market capitalization. Over the past two months, dominance has fallen from 65% to 59%, underscoring an ongoing shift of capital further along the risk curve.
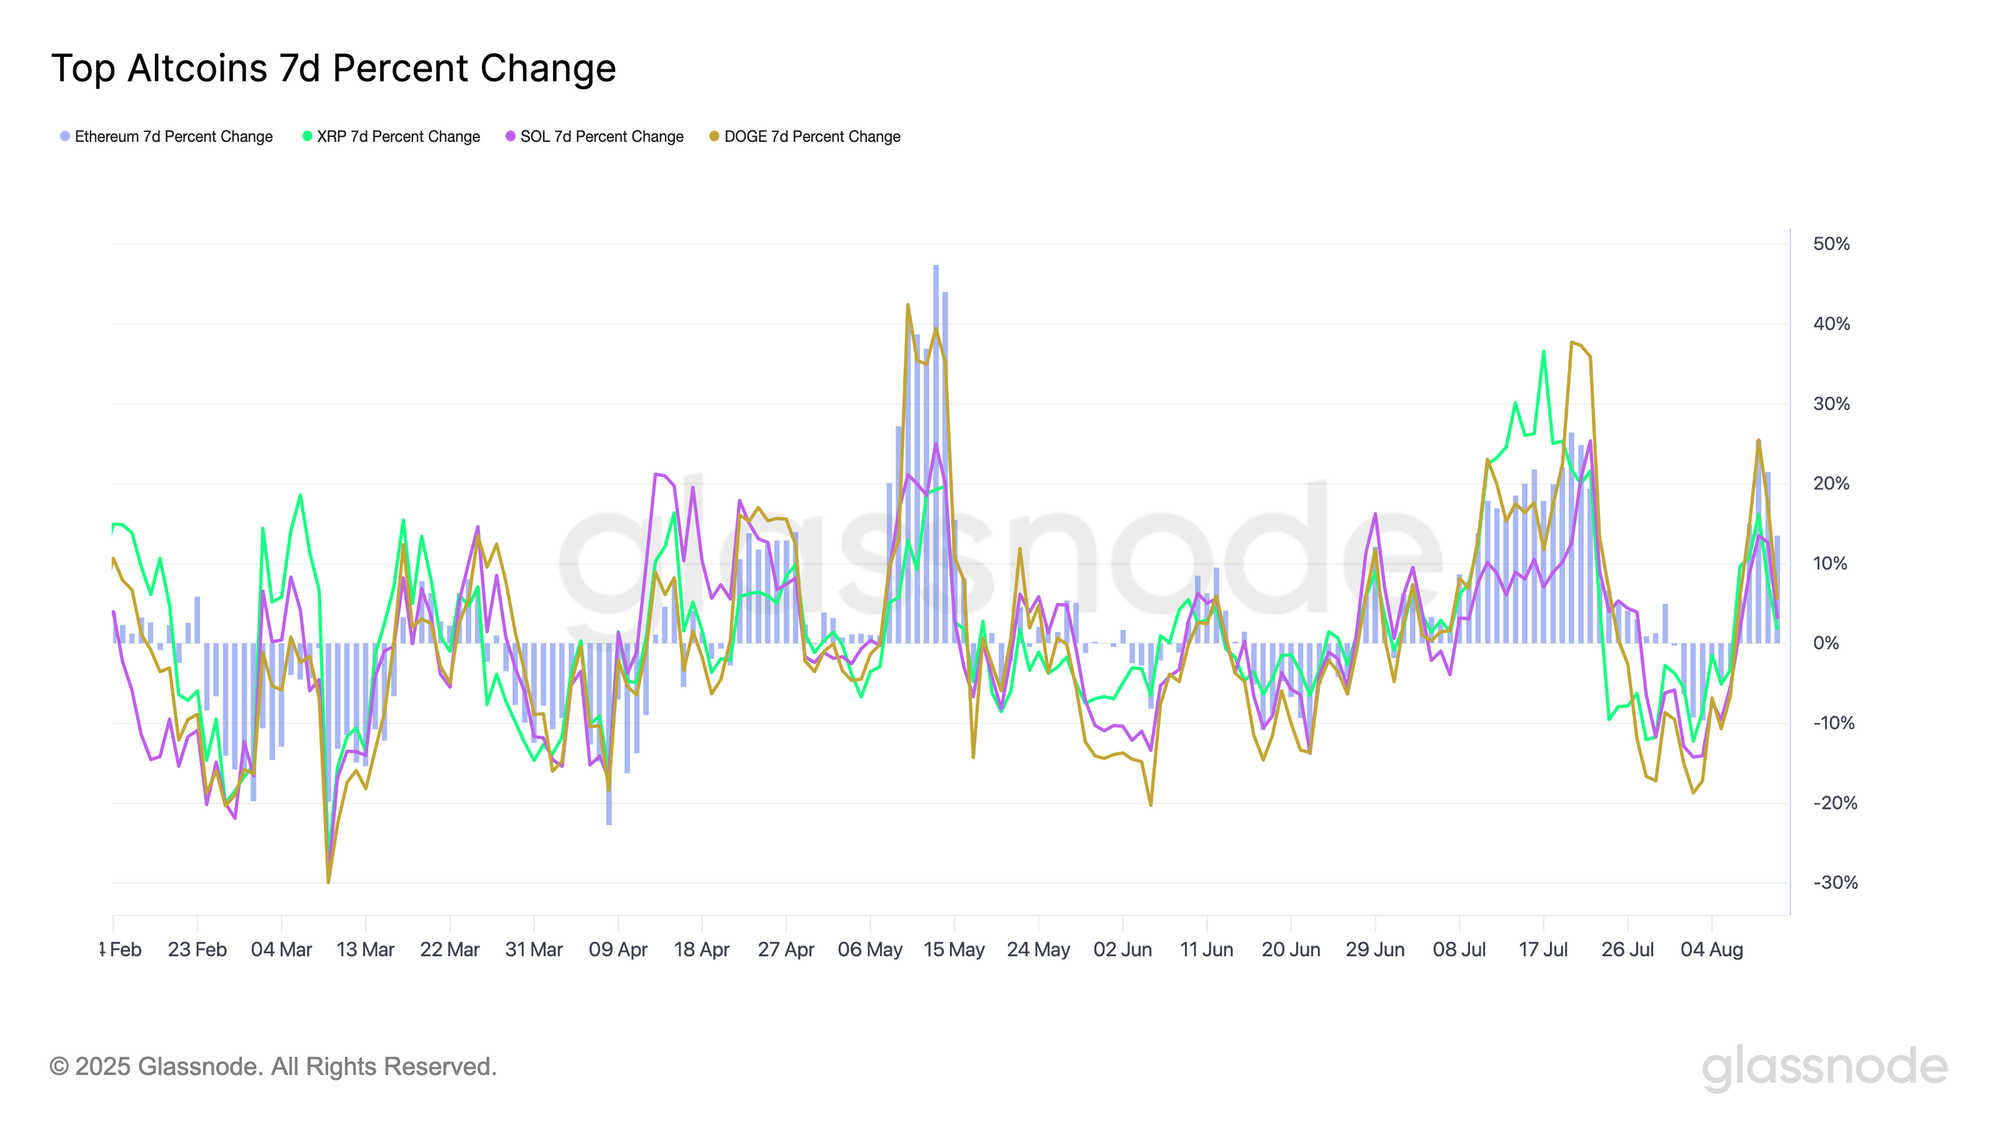
When examining the 7-day percentage change across the top altcoins (Ethereum, XRP, Solana, and Dogecoin), we observe several periods of strong performance throughout July and August.
- Ethereum 7-Day % Change: +25.5%
- XRP 7-Day % Change: +16.2%
- Solana 7-Day % Change: +13.6%
- Dogecoin 7-Day % Change: +25.5%
These moves underscore the broad-based rise in altcoins as speculative activity among investors continues to intensify.
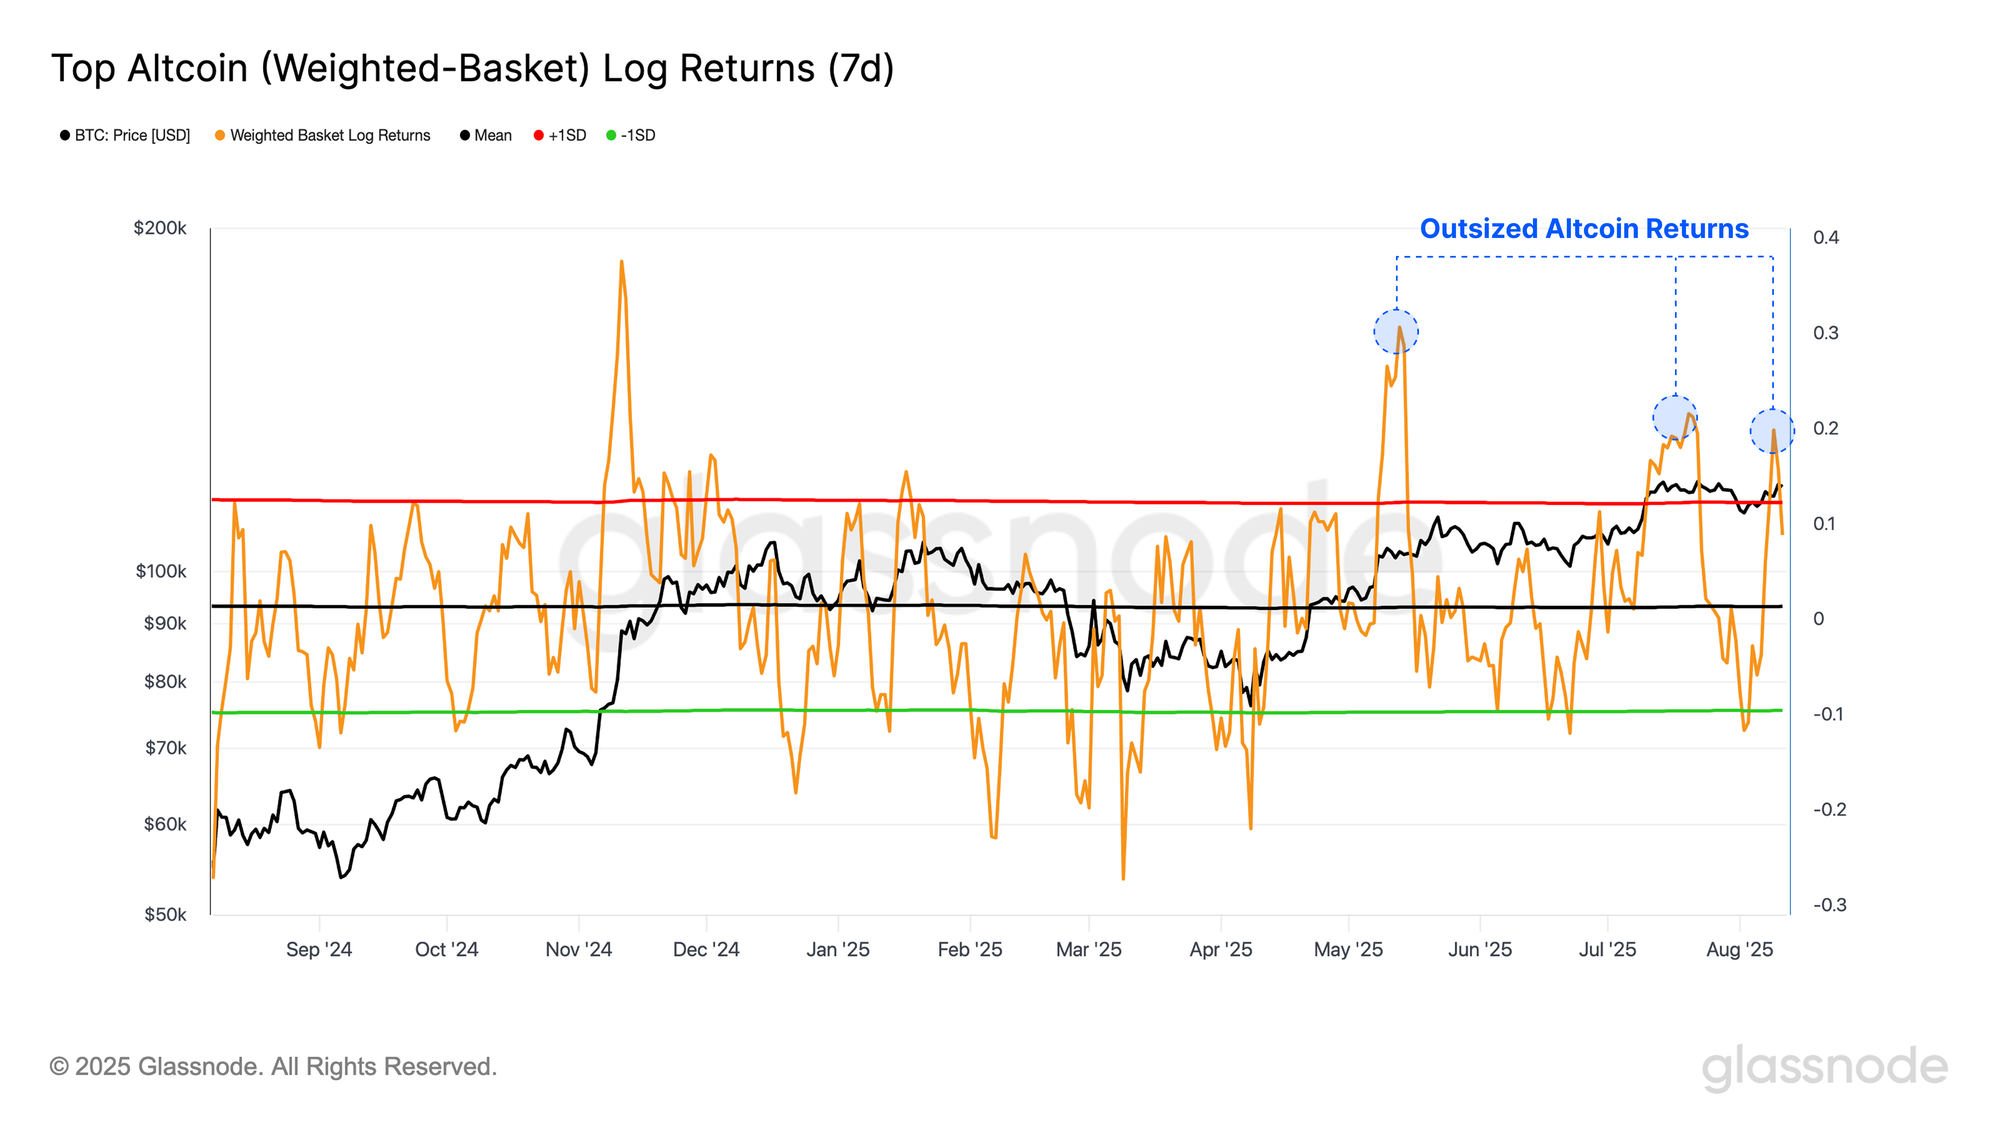
Another method to measure the performance of top altcoins is to construct a market-cap-weighted basket of the top altcoins and assess its 7-day log returns, which naturally account for scale differences across the various assets.
By applying ±1σ bands to the return series, we can identify periods of statistically significant over or underperformance. Across the past four months, this approach reveals three sustained periods of statistically strong performance, highlighting the outsized returns in the altcoin sector.
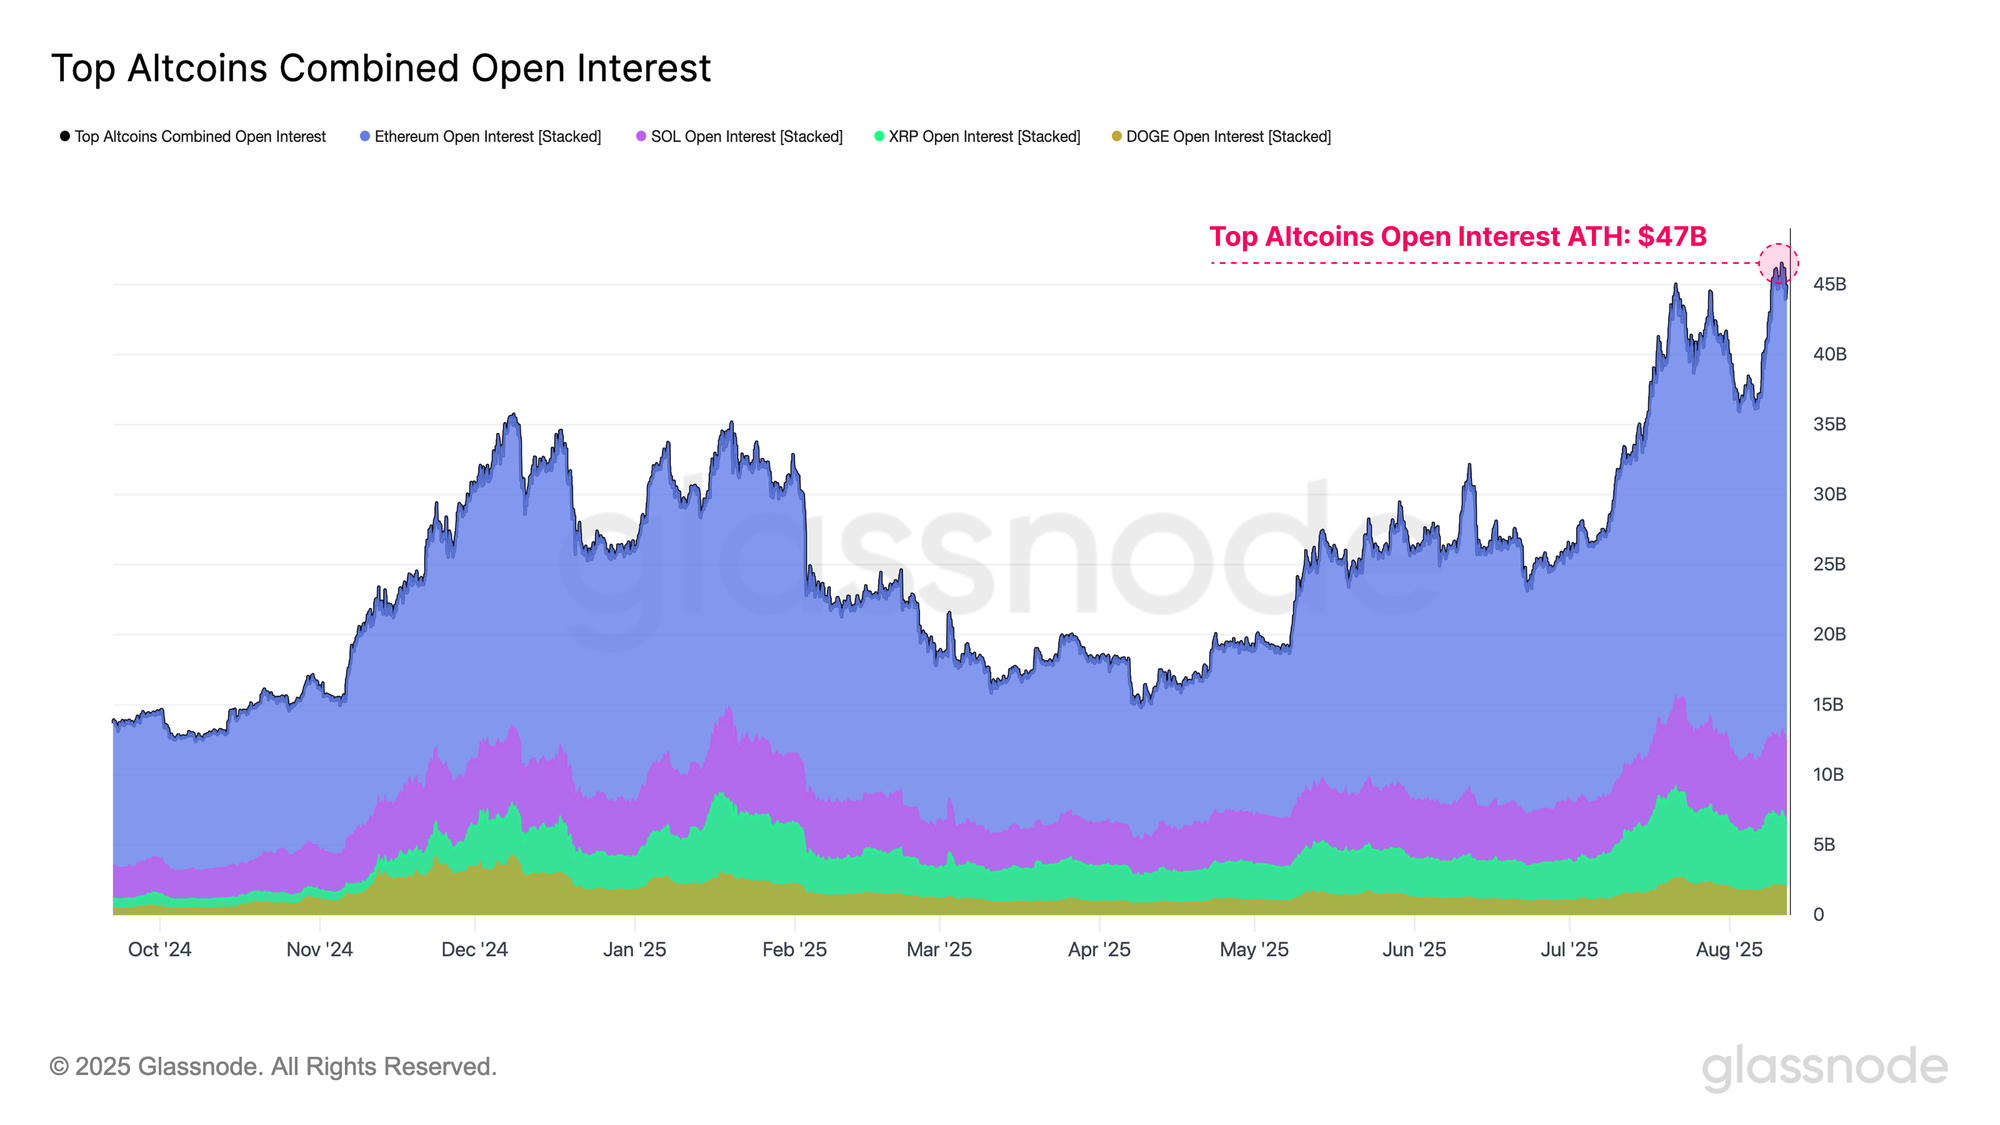
The pronounced price action across the top altcoins has driven a surge in open interest across the group, reaching a new all-time high of $47B. These conditions highlight a degree of leverage developing in the market, leaving it more vulnerable to sharp price swings. Elevated leverage can amplify both upward and downward moves, creating a more reflexive and fragile market environment.
Inflection Point
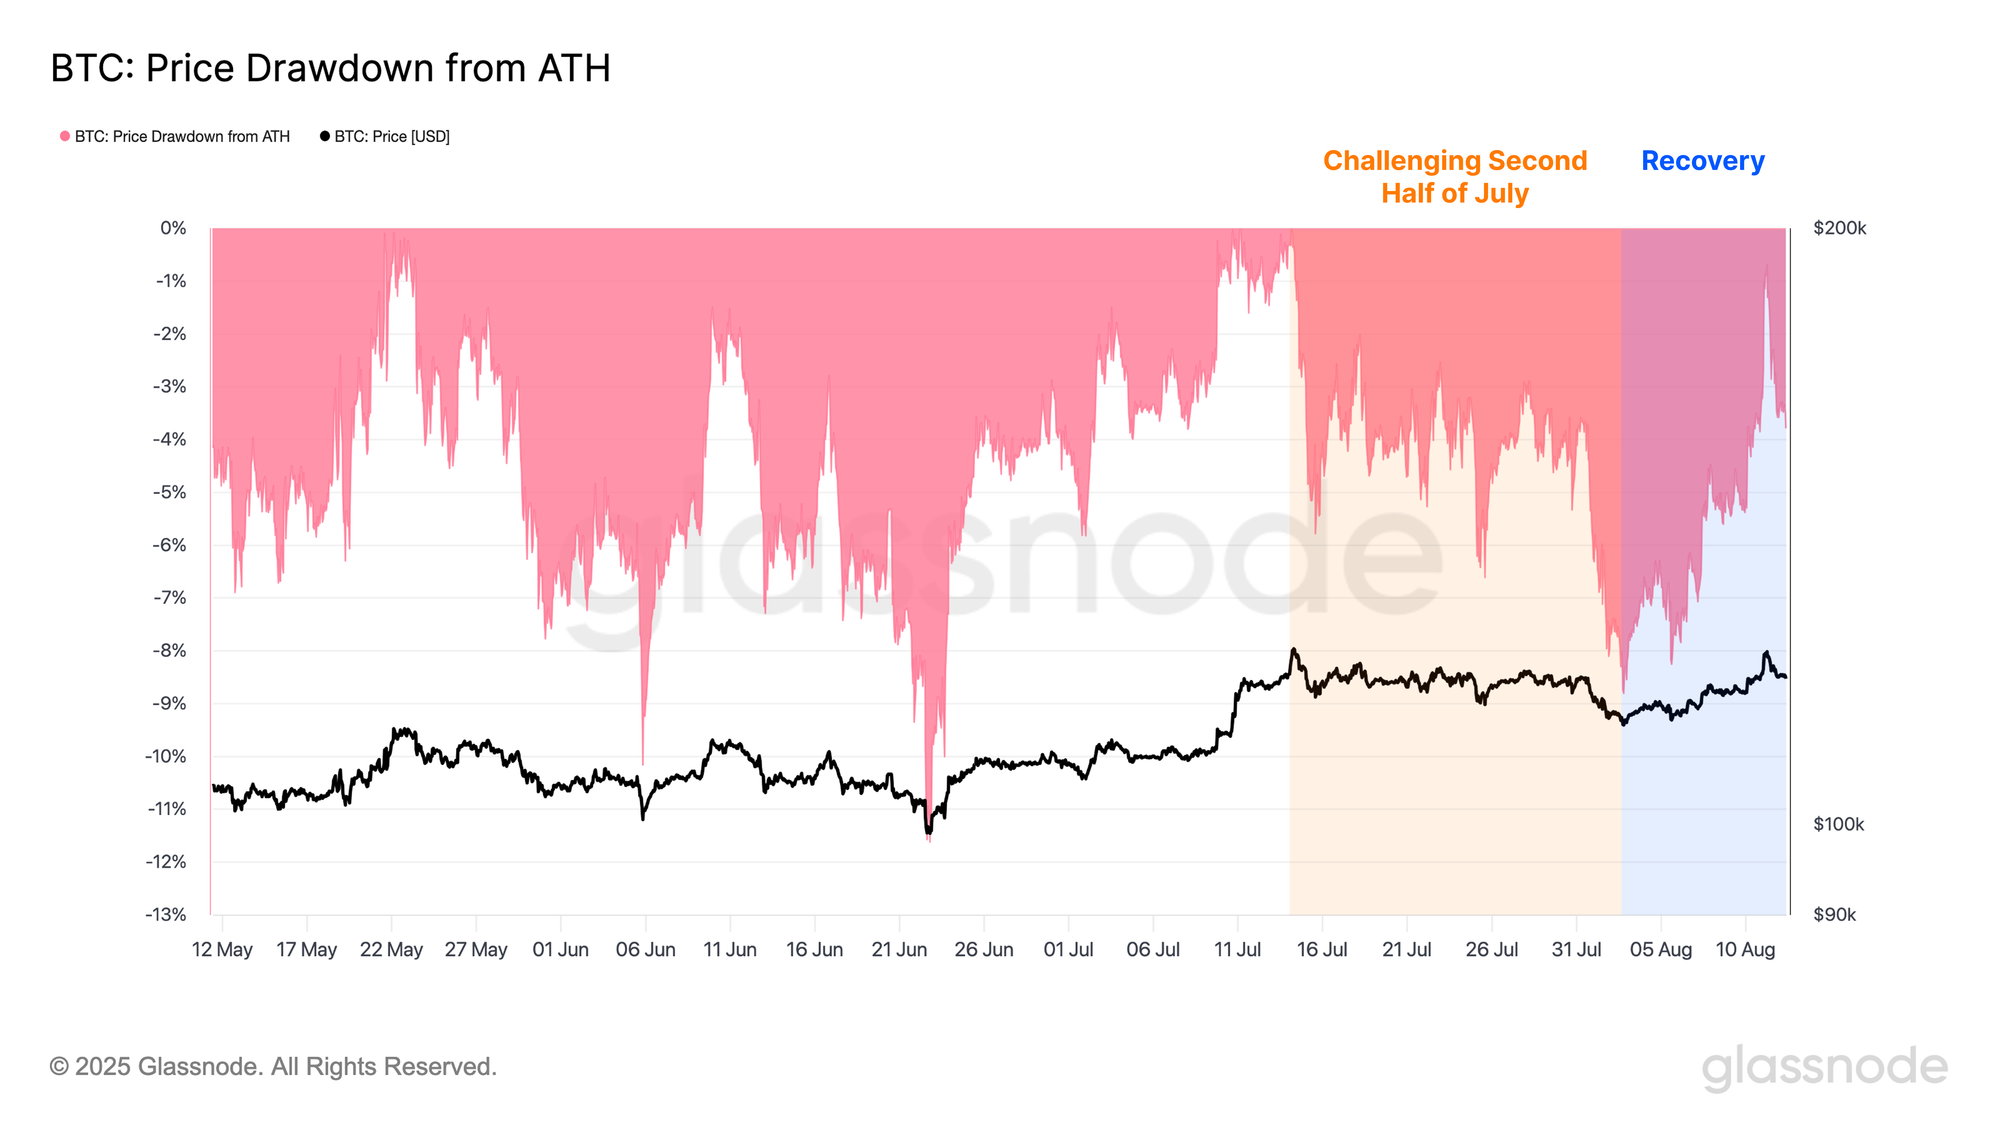
In contrast, Bitcoin, which has consistently outperformed most altcoins throughout the cycle, faced a challenging second half of July, experiencing a -9% drawdown as price fell to $112k and entered the low-liquidity air gap highlighted in WoC 30. Since then, the asset has staged a strong recovery and now sits just -1% below its all-time high, signaling a renewed attempt to enter a fresh phase of price discovery.
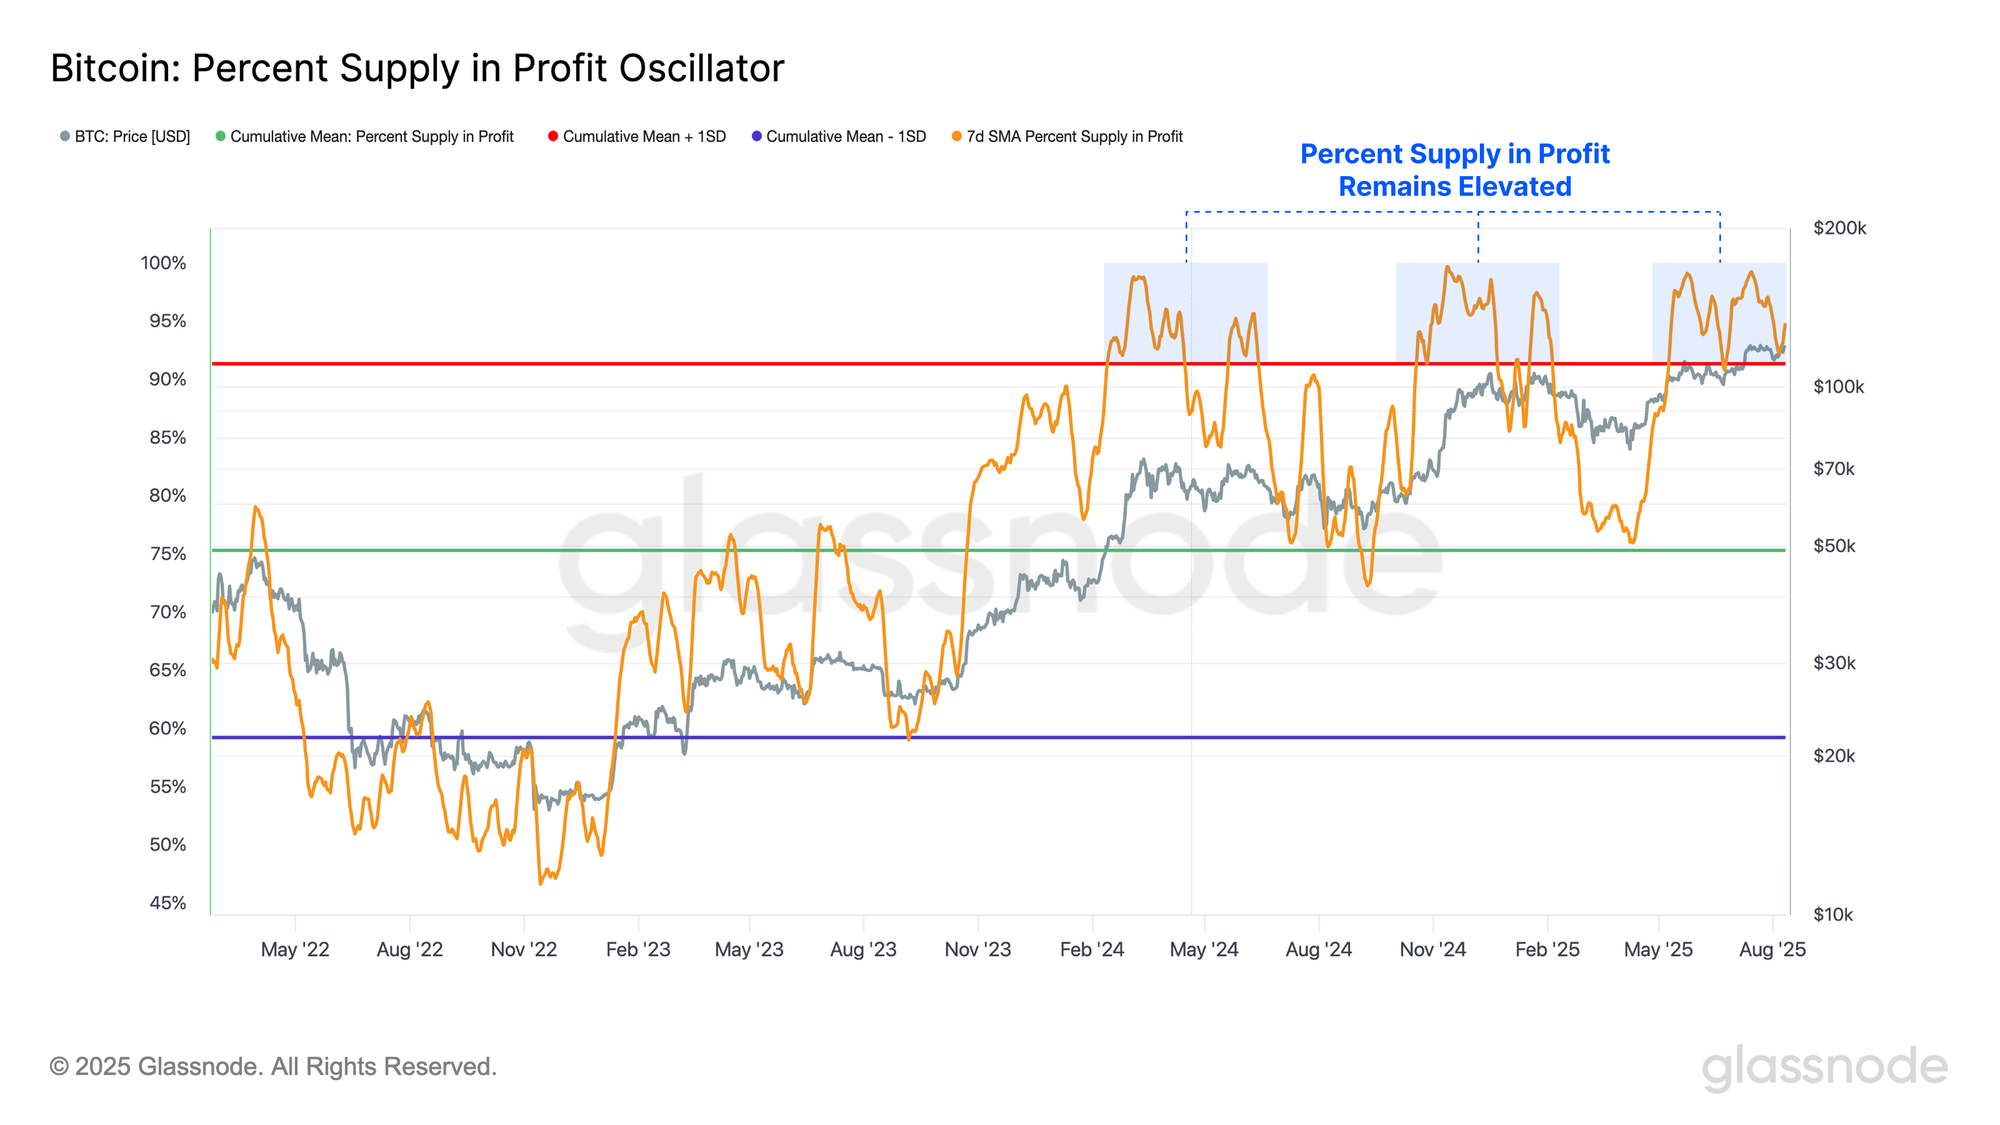
The recent push in upward momentum is supported by strong on-chain fundamentals. The percentage of the circulating supply in a position of profit has remained resilient throughout the correction, finding support at its +1σ level. This suggests that a supermajority of investors (95%) continue to hold unrealized gains and remain in a profitable position.
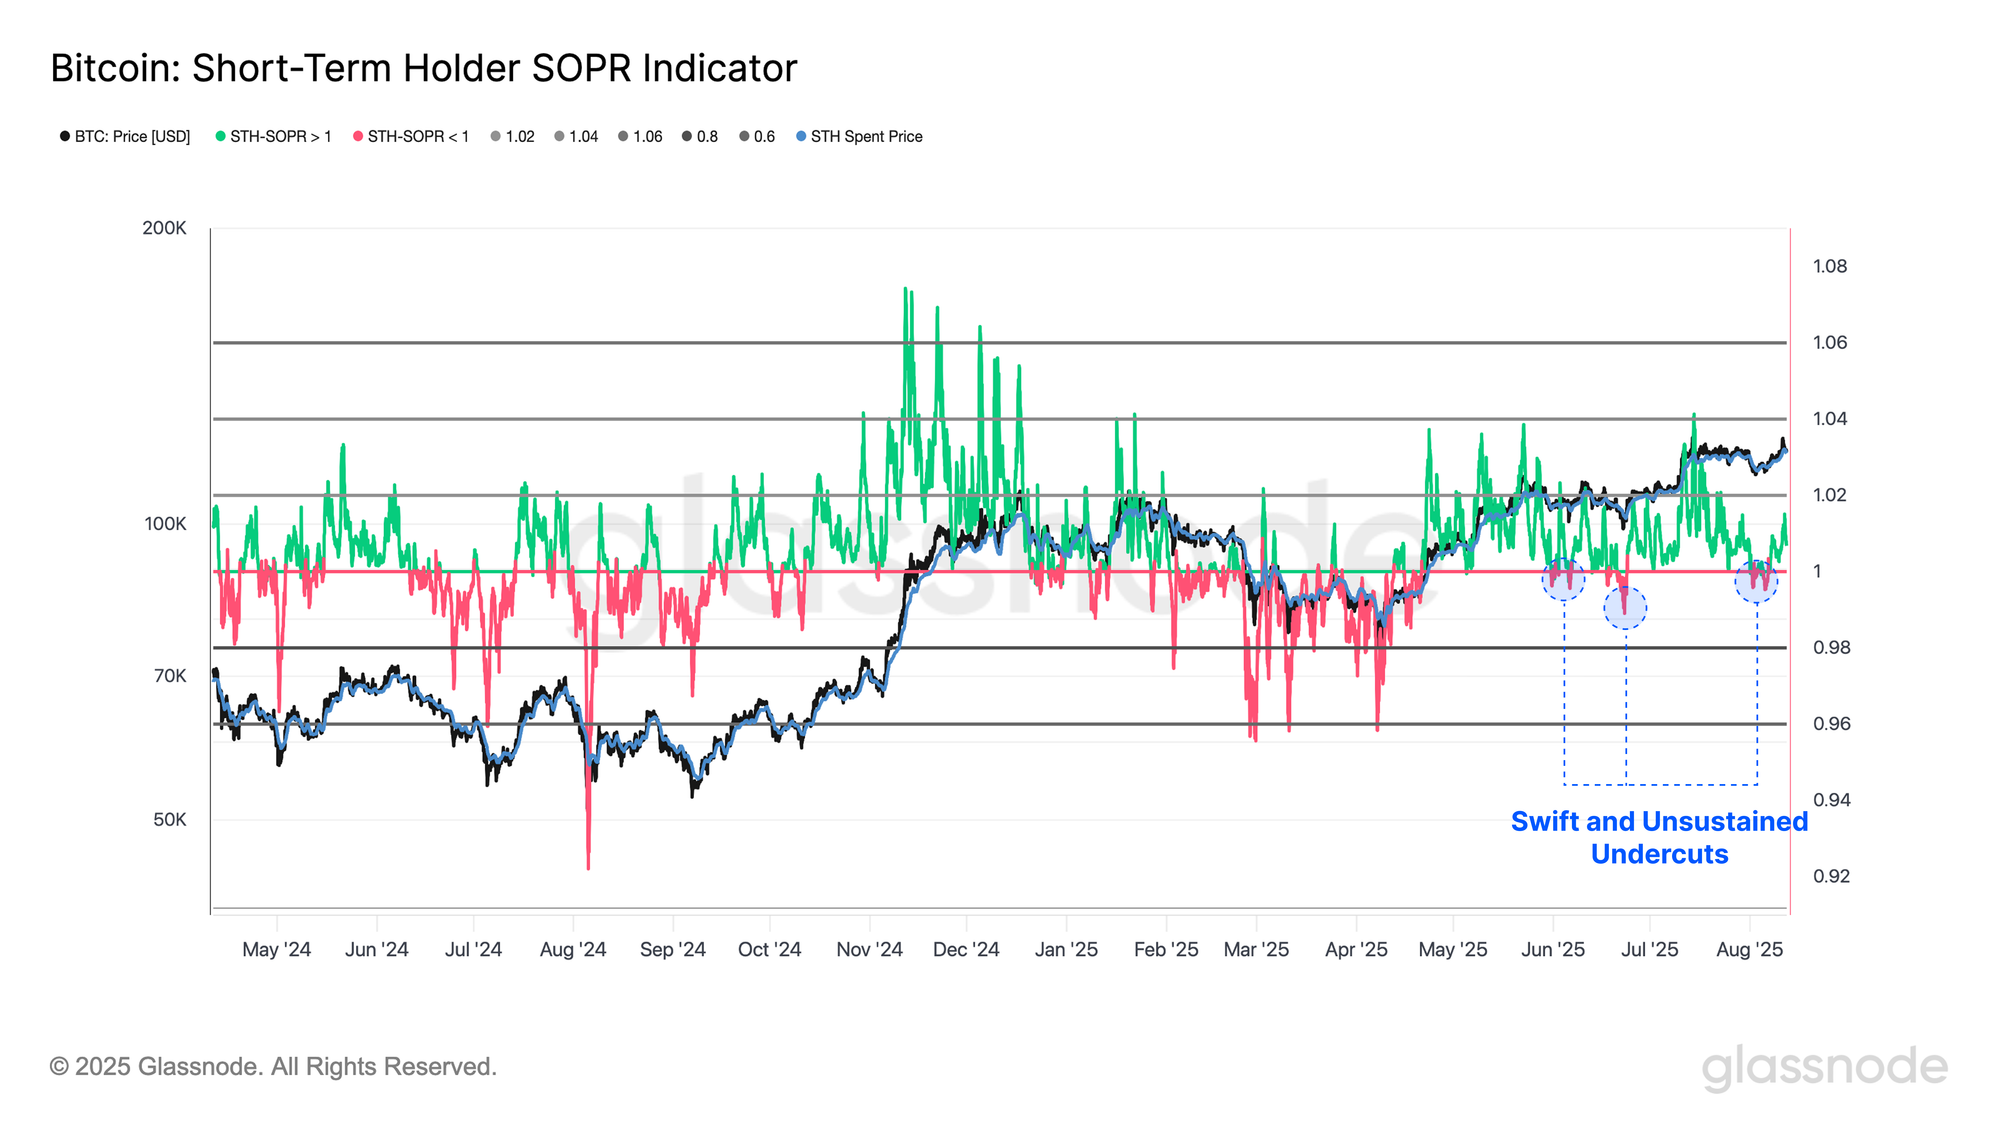
During the recent market downturn, the Short-Term Holder SOPR, which measures the aggregate profit or loss multiple across all coins transacted within this cohort, has reverted to its equilibrium level of 1.0, with only brief and shallow dips below it. This pattern suggests that newer investors have been actively defending their cost basis, and that realized losses remained relatively limited despite the sharp deterioration in market structure.
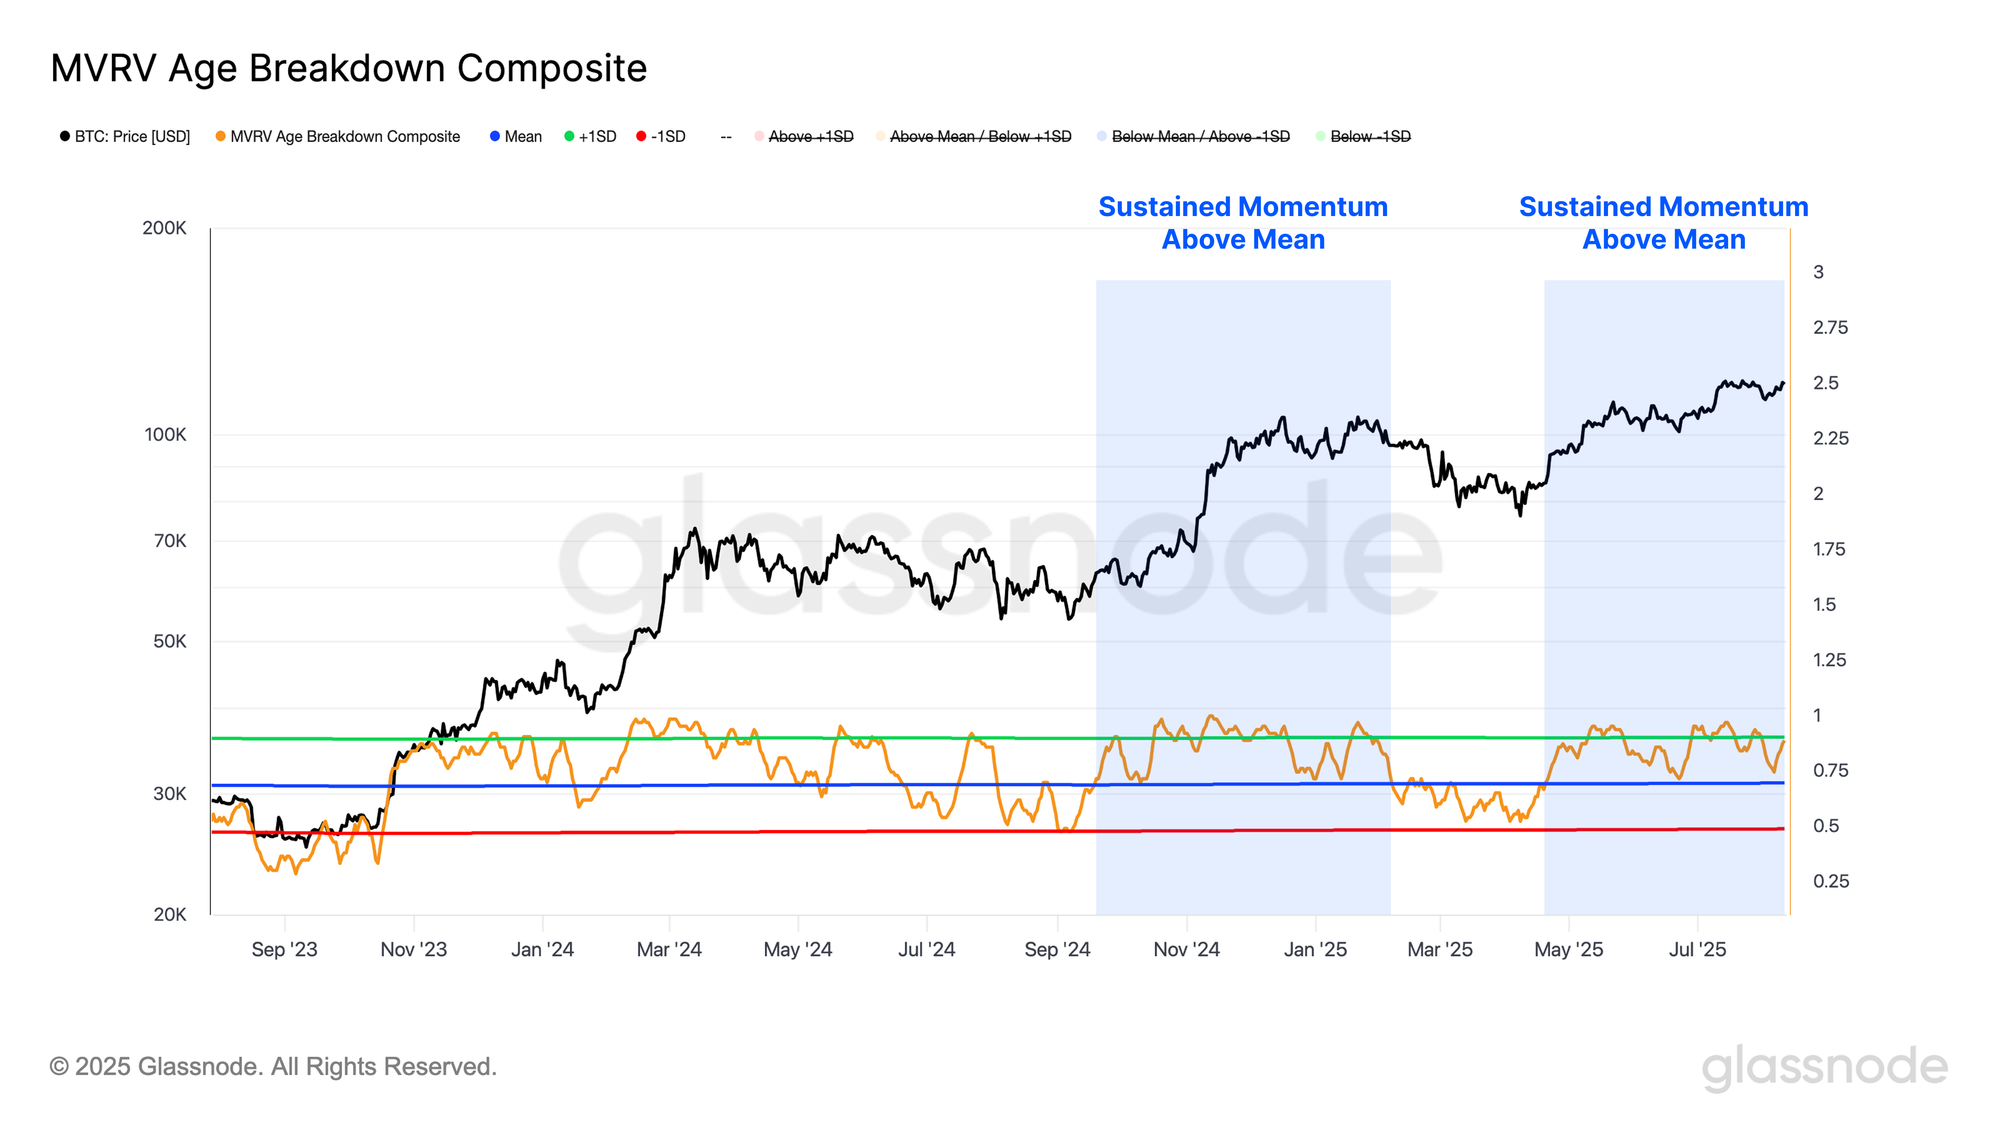
Additionally, we can employ an equal-weighted composite to measure the proportion of age-based cohorts that are on average, holding their coins in profit. This provides a visual gauge of market momentum by tracking when a growing share investors see their holdings shift from unrealized profit to unrealized loss.
The oscillator has held above its mean throughout the recent correction, finding strong support at that level, indicating that most investors remained profitable during the drawdown. Coupled with the marginal losses reflected in the STH-SOPR metric, this suggests minimal capitulation pressure among market participants. The preservation of this threshold signals improving market conditions and supports a constructive backdrop for continued momentum.
Implied Volatility Continues to Contract
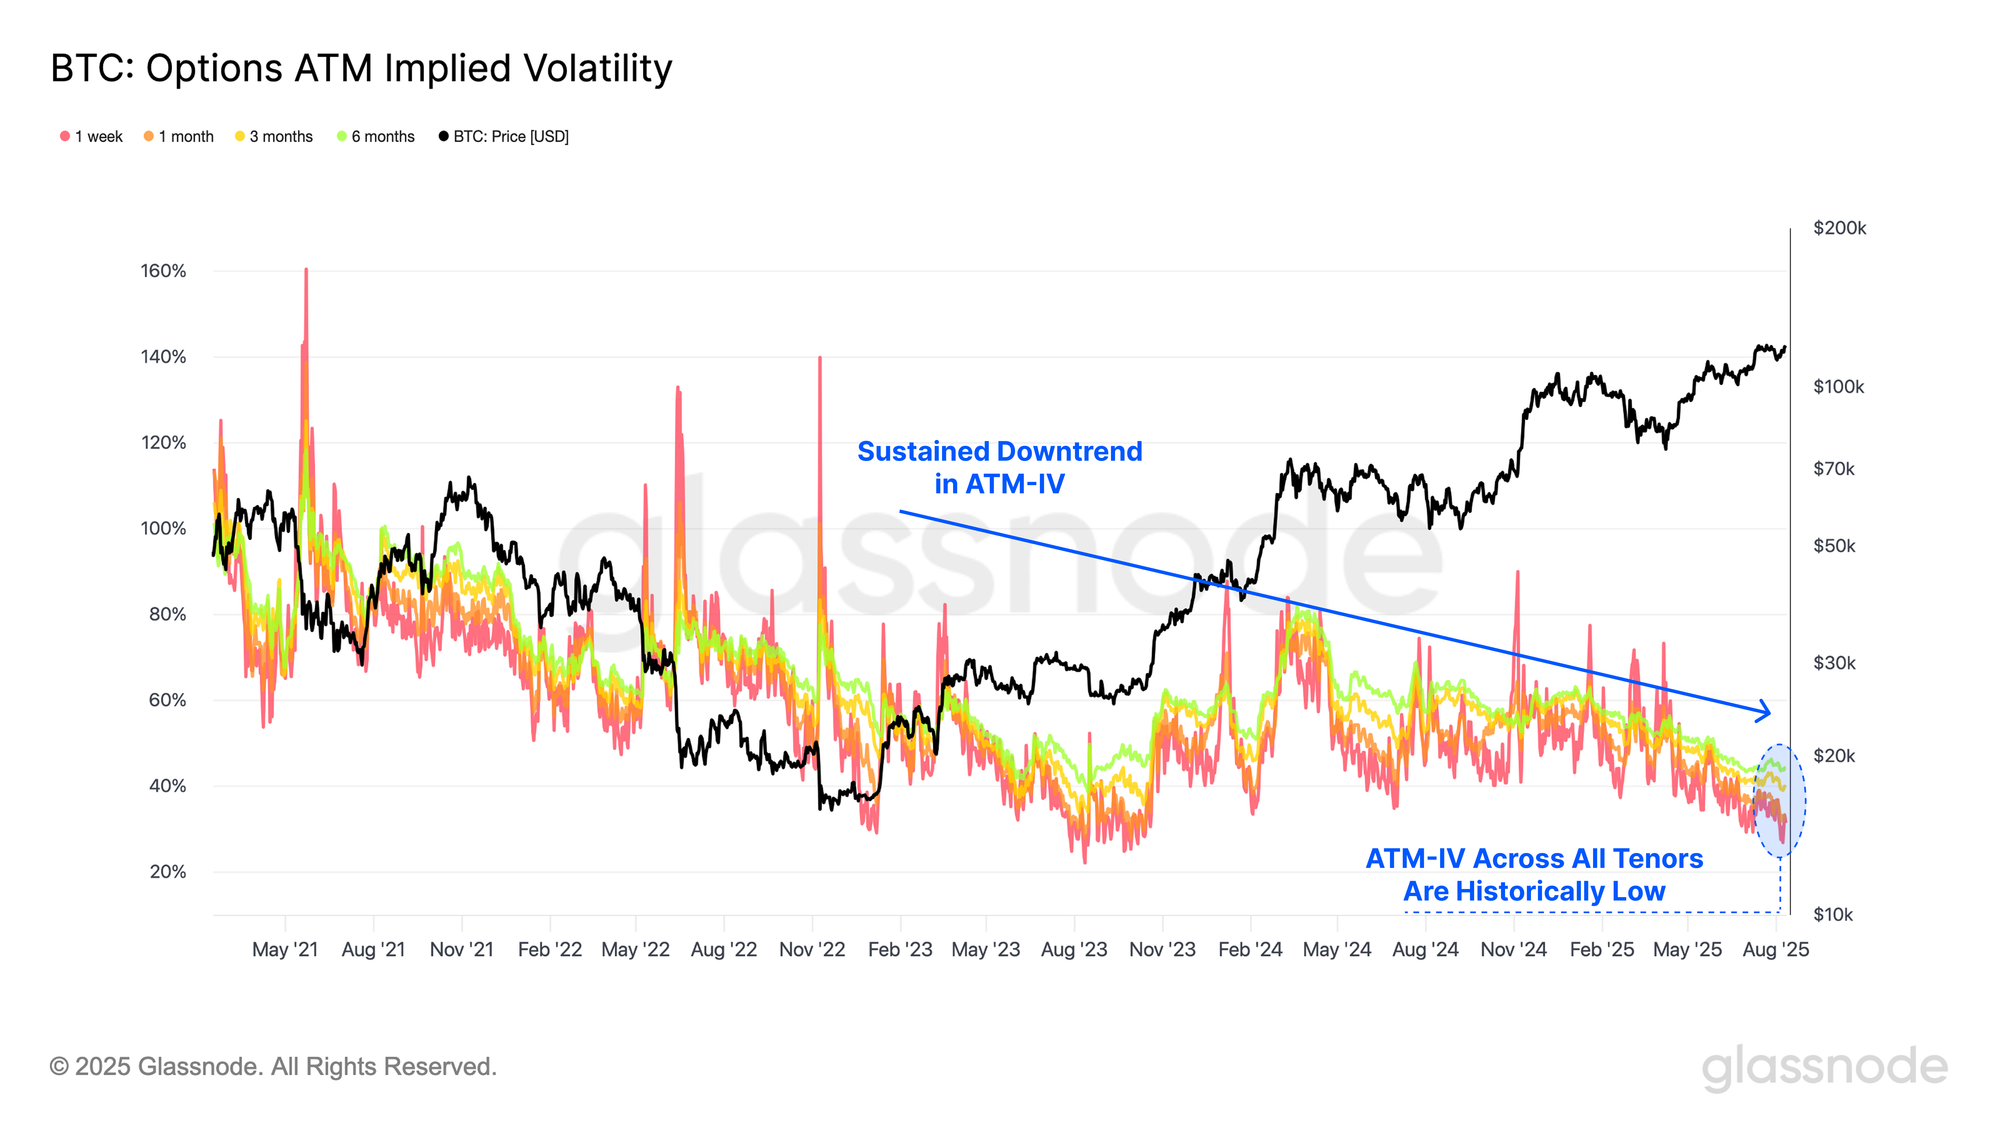
Moving towards options markets, at-the-money implied volatility (ATM IV) remains in a sustained downtrend, suggesting traders are not yet anticipating a shift to a high-volatility regime. Historically, such subdued volatility expectations have often preceded sharp market moves, making them a potential contrarian indicator.
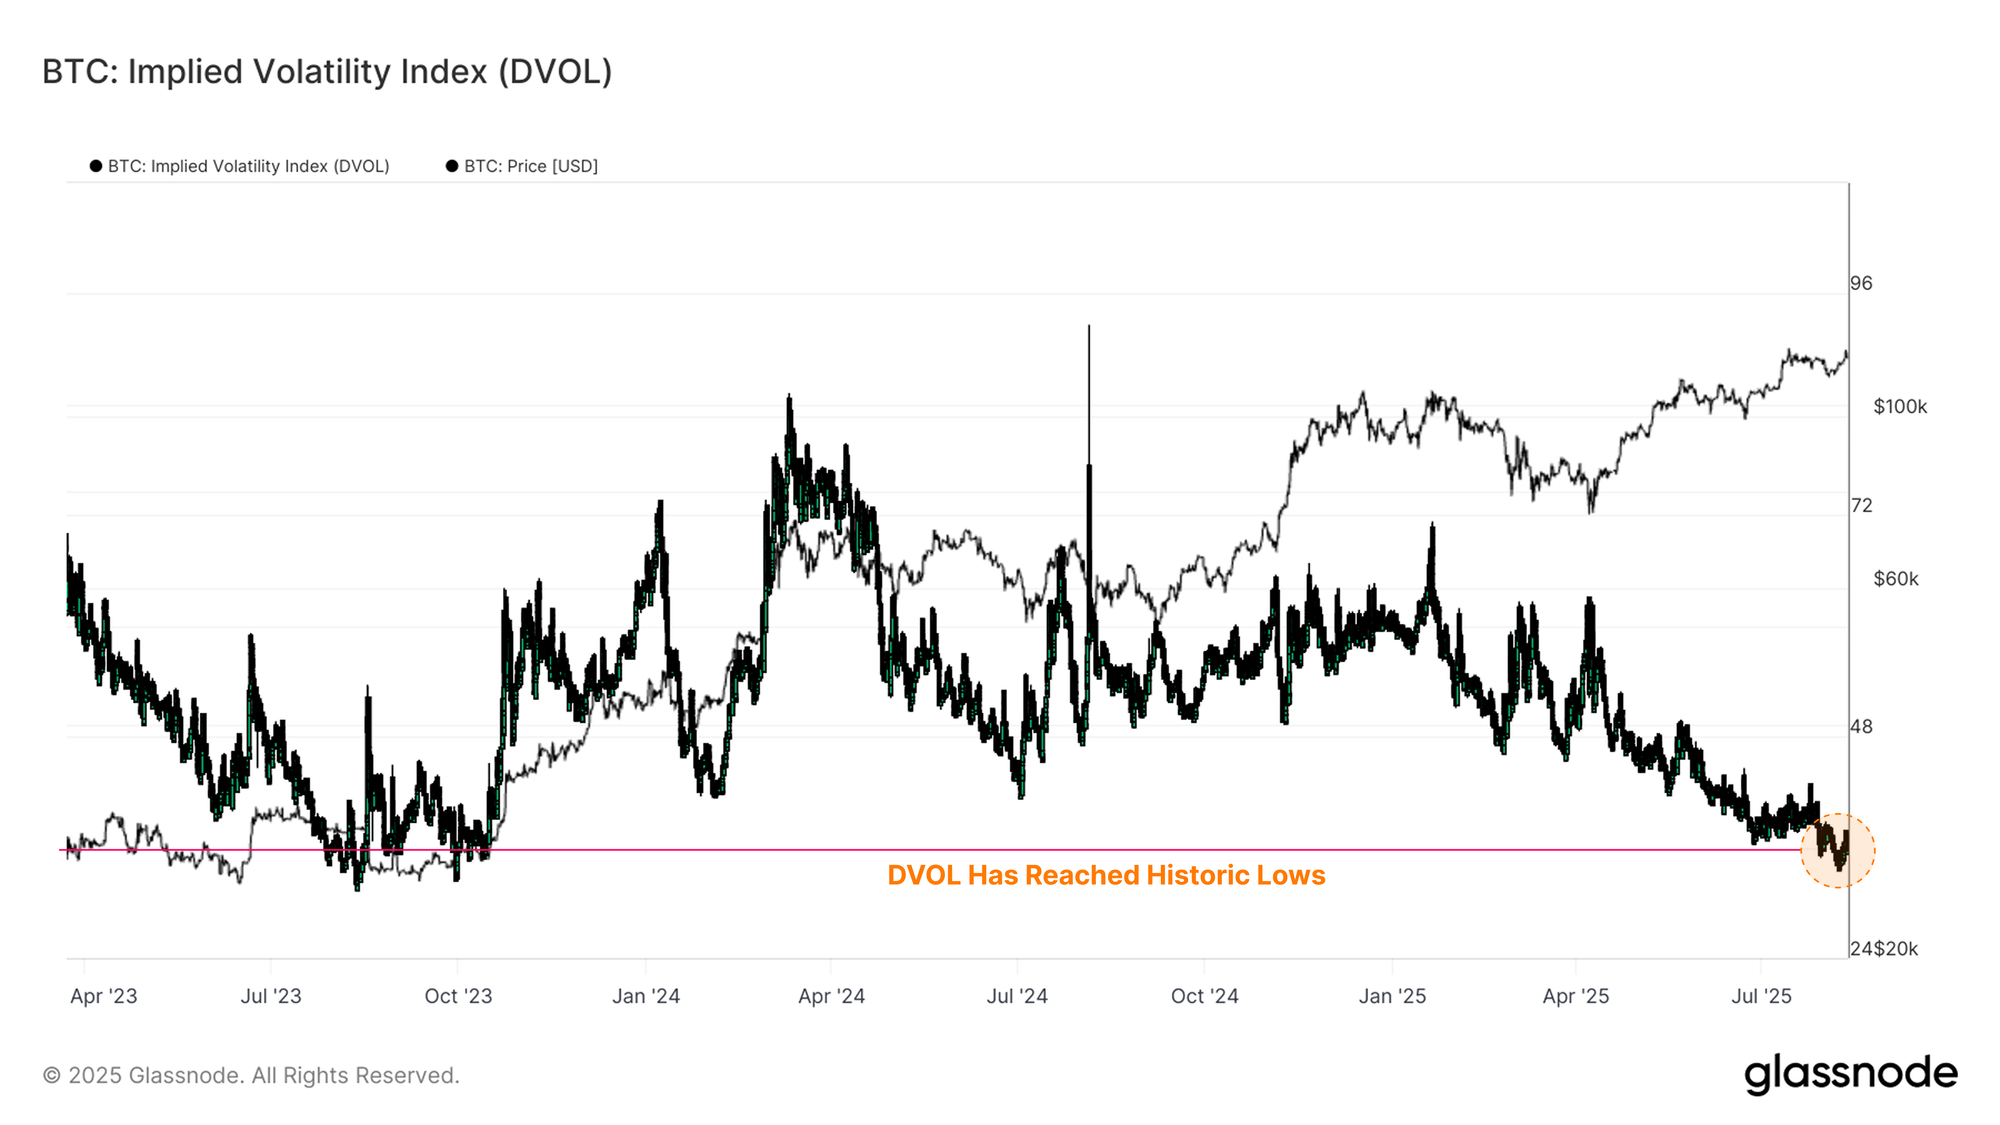
Furthermore, we can bolster our above observation by additionally exploring Deribit’s DVOL index, a 30-day implied volatility measure derived from the full range of option strikes rather than only at-the-money levels. Similar to the equity market’s VIX, it provides a broad view of market sentiment and expected price movement, helping traders gauge risk and spot periods of heightened speculation or uncertainty.
Current DVOL readings are historically low, with only 2.6% of trading days registering a lower value. Such levels often reflect market complacency and limited demand for hedging against large moves. While these conditions can persist, they leave the market exposed to sudden volatility spikes if a catalyst emerges, as past cycles have shown through sharp, disorderly price swings when risk is rapidly repriced.
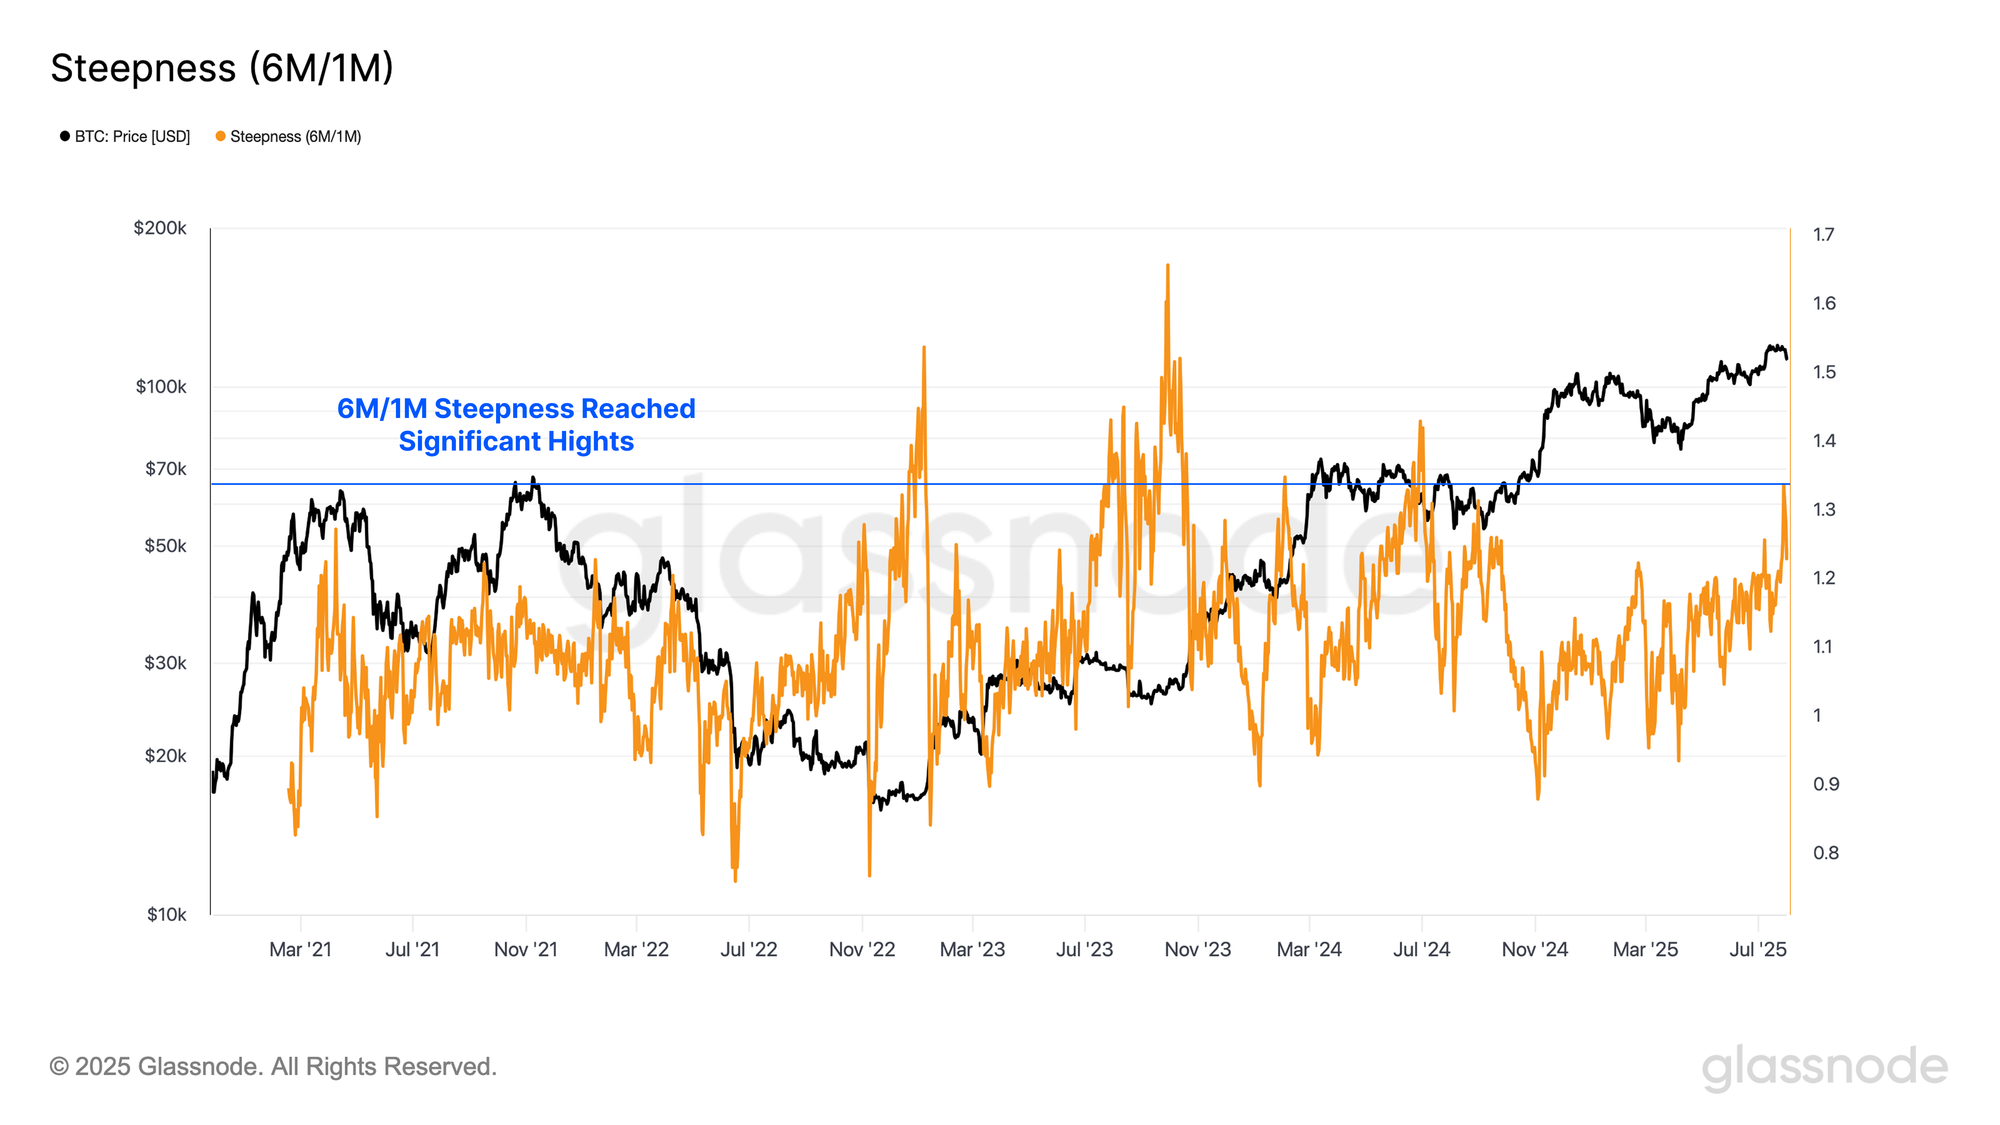
Additionally, we can track the 6M/1M IV ratio to gauge how the market’s volatility expectations shift across time. Changes in this slope can reveal whether traders see risk concentrated in the near term or building further out, helping identify shifts in sentiment and the timing of anticipated market stress or euphoria.
Currently, the 6M/1M IV ratio is steep, with only 3.2% of trading days recording a higher reading. This indicates that options traders are pricing significantly greater uncertainty in the longer term than in the near term, pointing to substantially elevated volatility expectations over the next two quarters.
Market Navigation
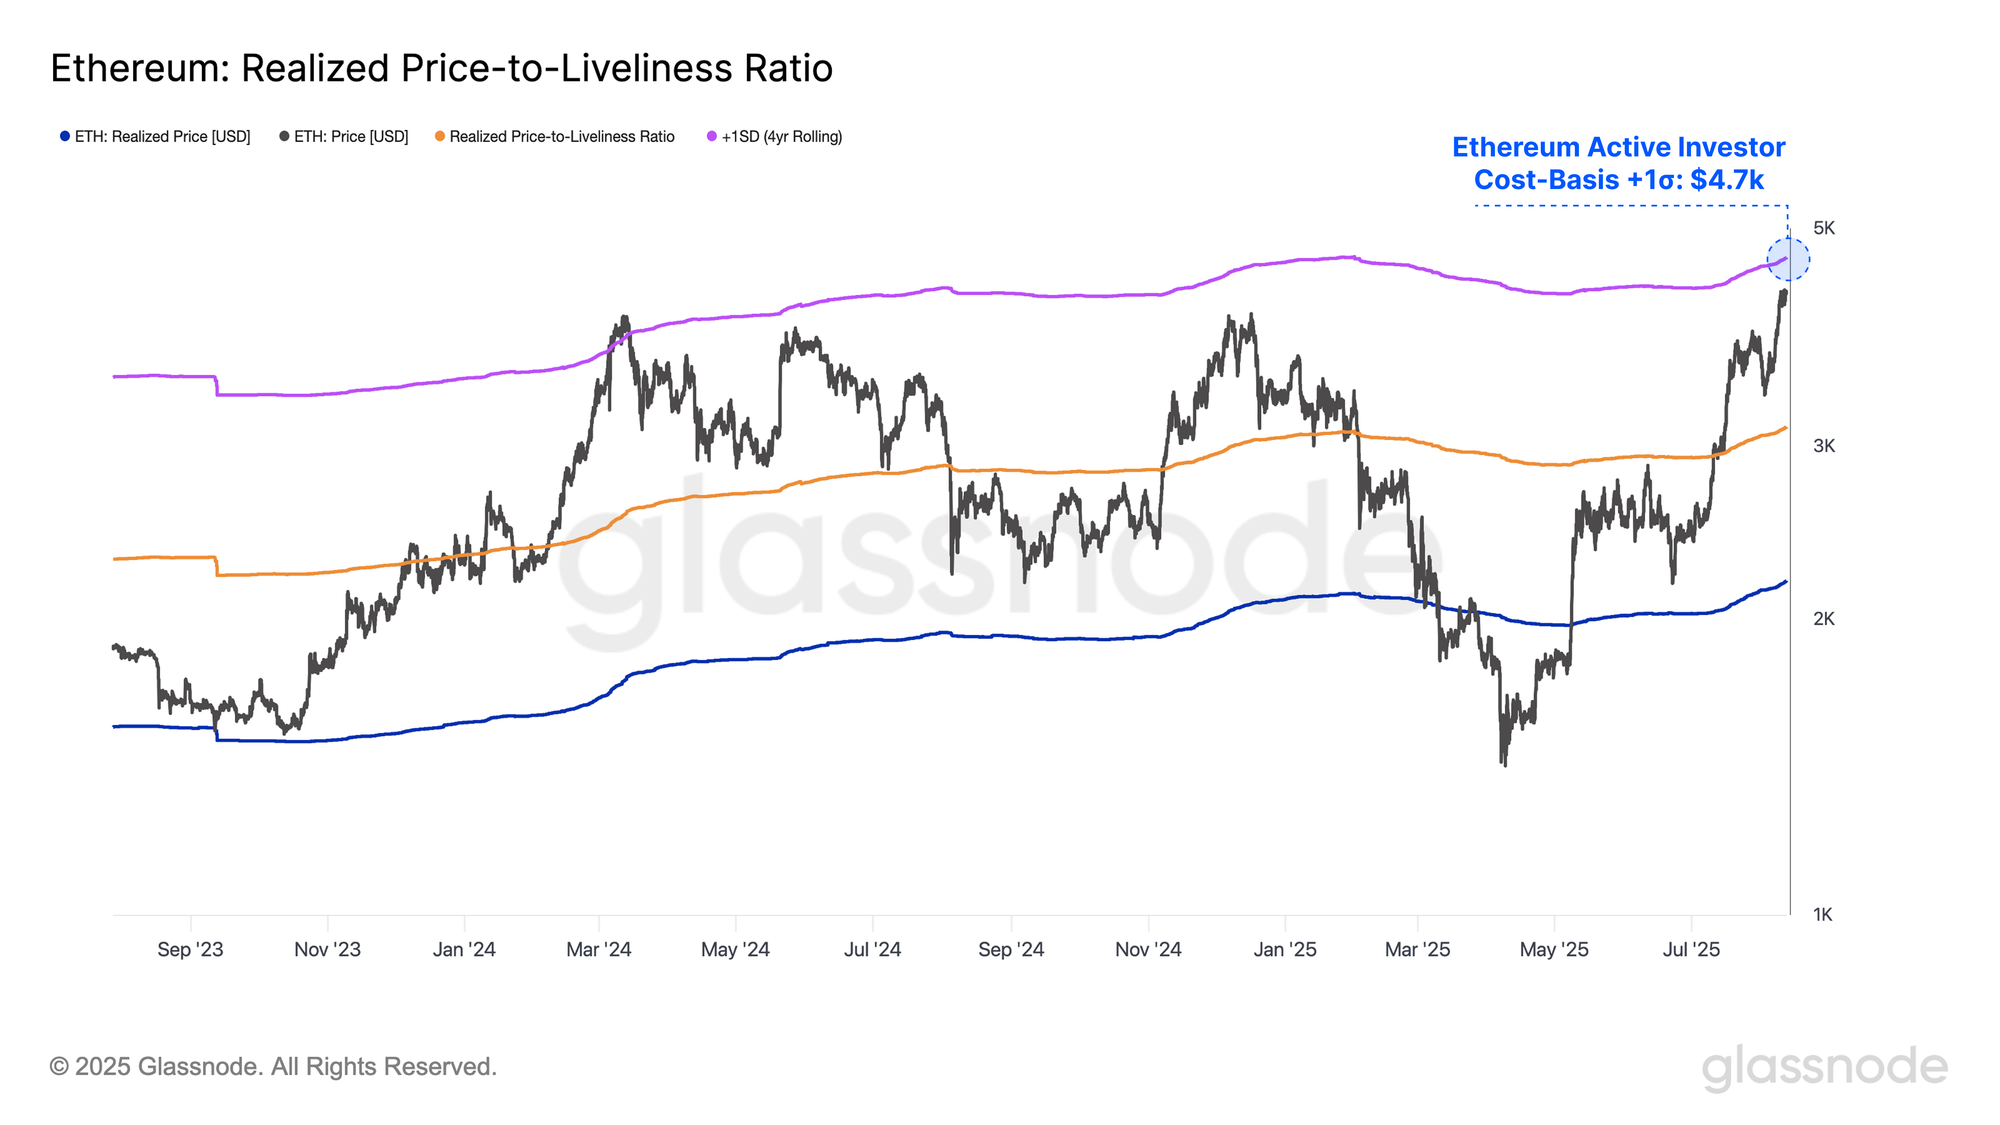
To assess potential upside targets for Ethereum’s current rally, one useful reference point is the +1 standard deviation level of its Active Realized Price, often marking where selling pressure starts to build. At present, the threshold resides at the $4.7k, which under current market conditions would likely represent an overheated area.
This level has historical significance, acting as a ceiling during the March 2024 rally and also serving as resistance multiple times in the 2020–21 bull cycle. When Ethereum has pushed above this band in the past, it has typically been accompanied by elevated investor exuberance and fragile market structures.
Given these dynamics, the $4.7k price point stands out as a key resistance to monitor. A decisive break above could signal the onset of a more speculative phase, but also increase the risk of a sharp reversal if sentiment turns.
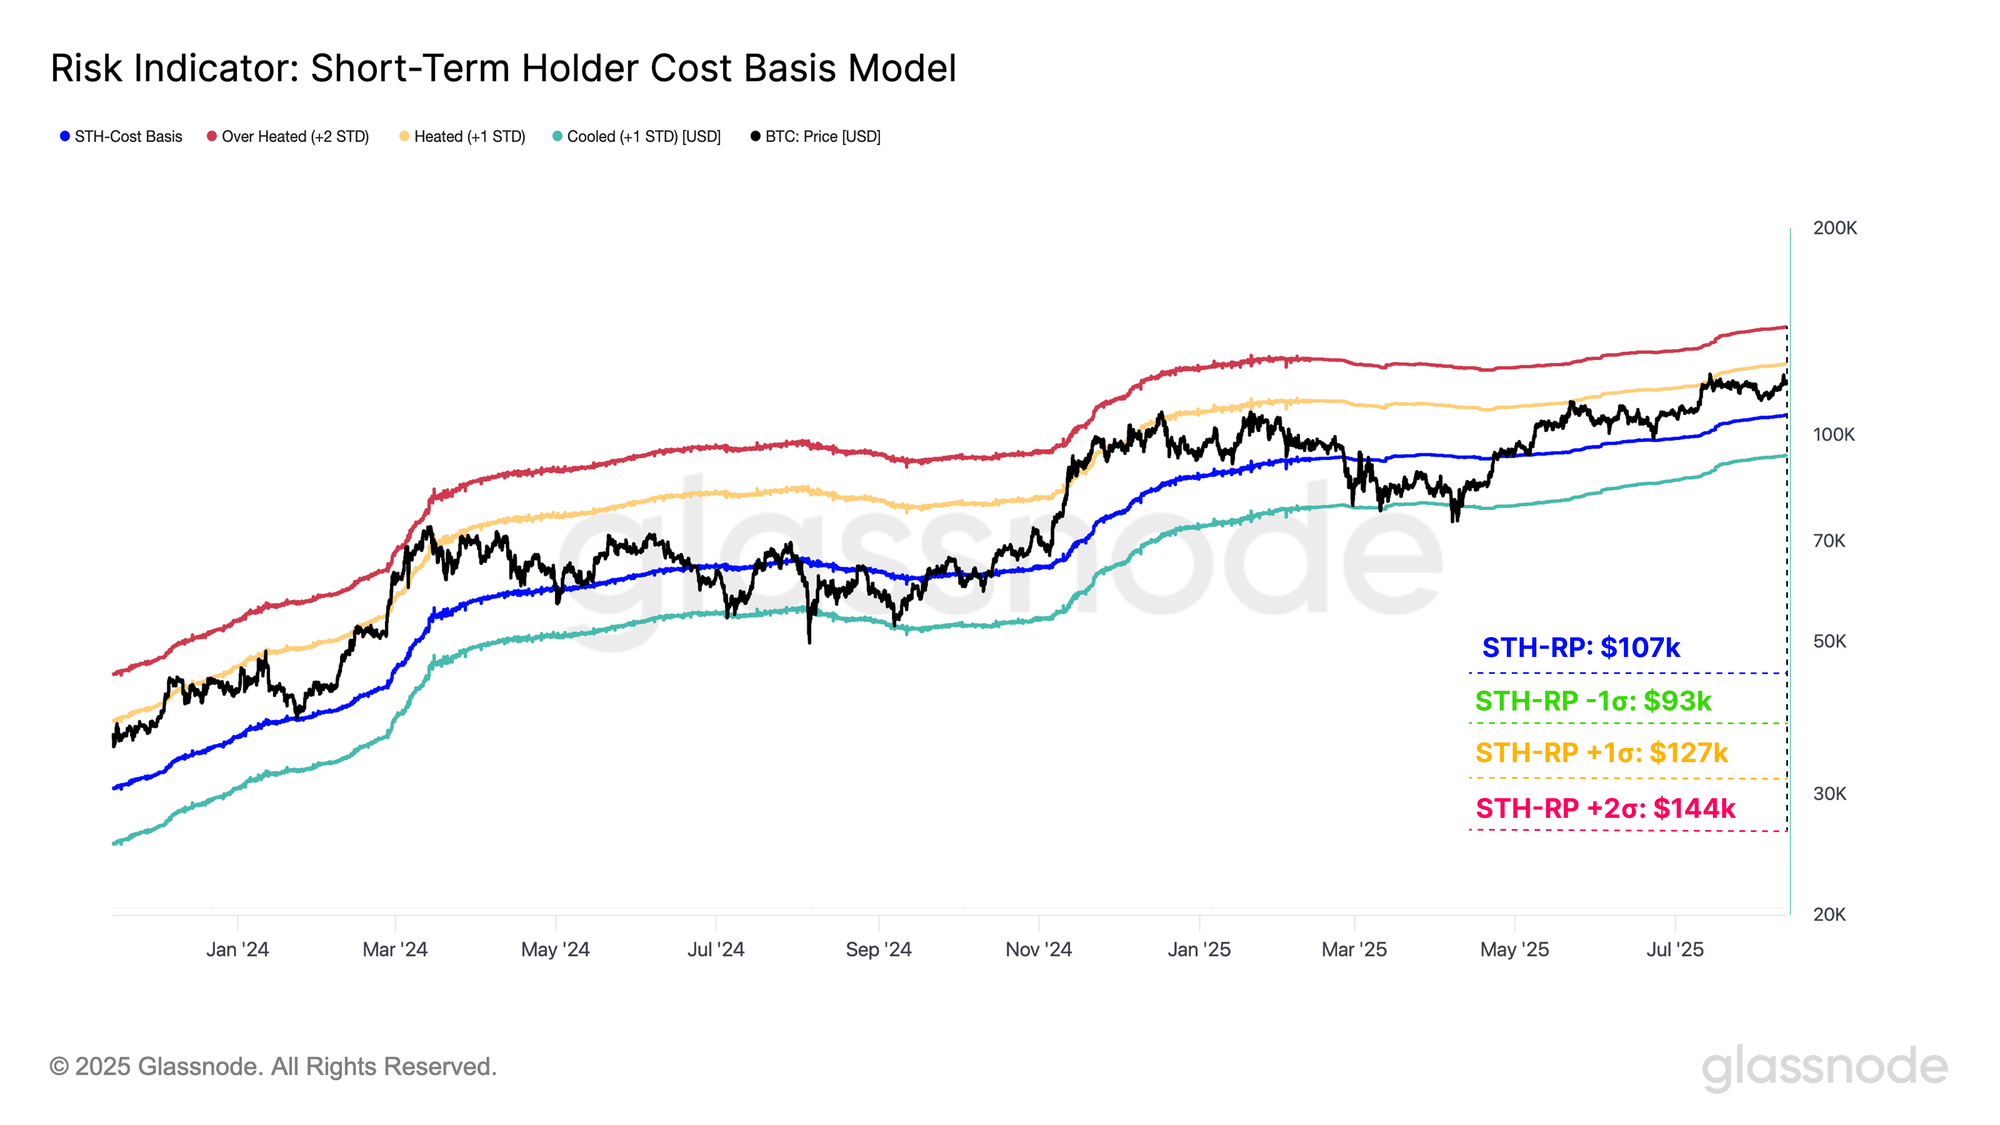
Conversely, for Bitcoin, we can evaluate the Short-Term Holder (STH) cost basis, which represents the average acquisition price of newer market participants, with this key pricing level historically marking a boundary between bullish and bearish local regimes. Adding statistical context, we can apply standard deviation bands around this level to assess for over or underheated conditions.
From the perspective of these pricing levels, the $127k level becomes a critical to level to monitor the reaction of price in the event of further upside, and is likely the first significant resistance point to overcome. Additionally, a decisive move above $127k would likely bring the $144K area into consideration, where the +2σ band aligns with a major resistance zone and could trigger a sharp increase in sell-side pressure.
Summary and Conclusions
Strength in digital asset markets continues to persist with Ethereum surging to $4.3k, its highest value since December 2021 and now only -12.5% below its all-time high, whilst Bitcoin’s momentum remains firmly supported by resilient on-chain strength.
Strong altcoin price action has fueled a surge in open interest across the top altcoins, which has climbed to a record $47B, increasing the potential for sharper, more reflexive price moves. In contrast, Bitcoin options markets remain priced for a low-volatility environment, with implied volatility at multi-year lows, a setup that has historically preceded abrupt expansions in realized volatility.
Both majors are now approaching historically important resistance markers: Ethereum at the +1σ Active Realized Price of $4.7k and Bitcoin at the +1σ Short-Term Holder cost basis of $127K. Price developments at these thresholds are likely to be pivotal in determining whether markets extend toward higher cycle targets or face a sharper, leverage-driven retracement.
Disclaimer: This report does not provide any investment advice. All data is provided for informational, and educational purposes only. No investment decision shall be based on the information provided here and you are solely responsible for your own investment decisions.
Exchange balances presented are derived from Glassnode’s comprehensive database of address labels, which are amassed through both officially published exchange information and proprietary clustering algorithms. While we strive to ensure the utmost accuracy in representing exchange balances, it is important to note that these figures might not always encapsulate the entirety of an exchange’s reserves, particularly when exchanges refrain from disclosing their official addresses. We urge users to exercise caution and discretion when utilizing these metrics. Glassnode shall not be held responsible for any discrepancies or potential inaccuracies.
Please read our Transparency Notice when using exchange data.
- Join our Telegram channel.
- For on-chain metrics, dashboards, and alerts, visit Glassnode Studio.