Author: Cecelia, Deep Tide TechFlow
Is DEX really going to replace CEX?
From a relatively low market share in 2020 to rapidly rising trading volumes this year, the presence of decentralized exchanges has indeed been growing stronger.
Is the DEX comeback really close? But perhaps not so fast?
Don't rush to applaud the victory of decentralization, and don't rush to dismiss it outright with old reasons like complex processes and poor user experience.
Read this report first, and you'll have your answer.
2025: The Year DEX Liquidity Took Off
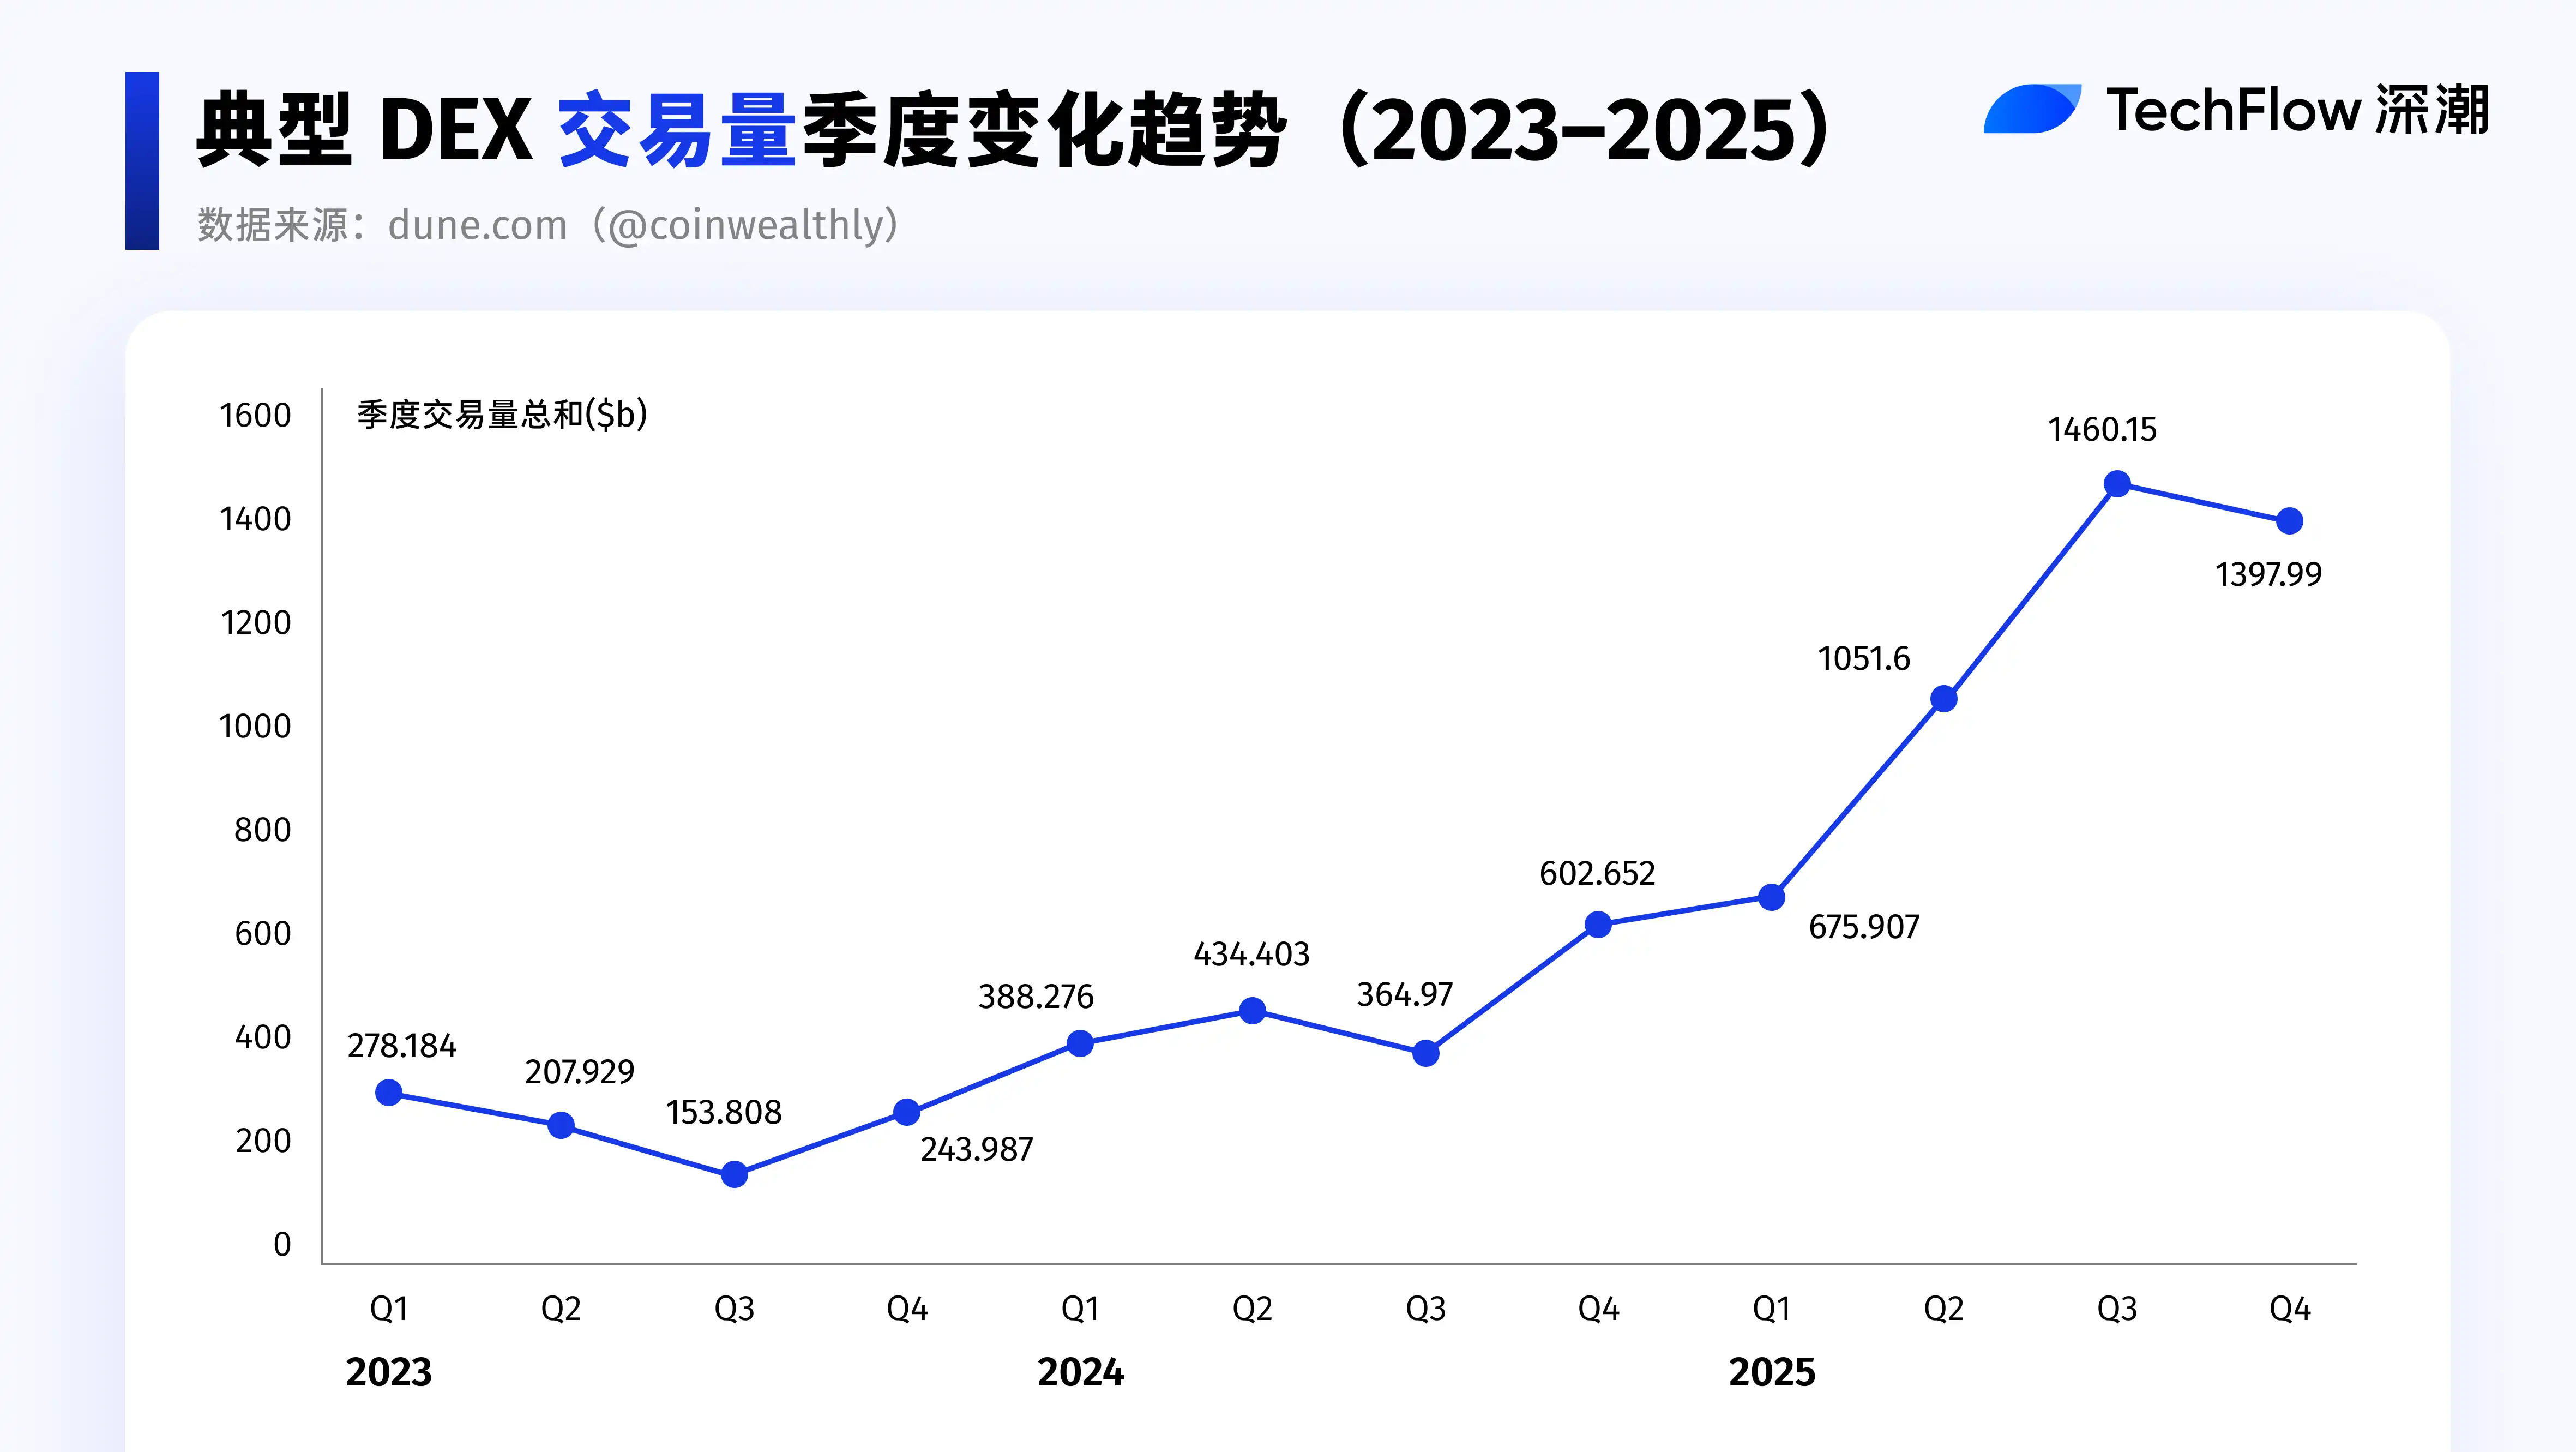
Compared to the slow rise in previous years, 2025 can truly be called the year DEX liquidity took off.
Both in terms of scale and growth rate, DEX trading volume has seen a significant leap, with the total trading volume nearly quadrupling.
Data source: dune.com (@coinwealthly)
If we break it down by quarter, this round of growth did not happen suddenly.
The takeoff in 2025 is essentially a continuation of the growth trend that started in Q4 2024.
It was in the fourth quarter of 2024 that DEX trading activity and liquidity began to accelerate, and this trend was fully amplified in the following year.
It can be said that the inflection point for DEX occurred in Q4 2024, and 2025 continued and amplified this trend.
Looking Back at the Inflection Point: Acceleration in 2024Q4 and Amplification in 2025
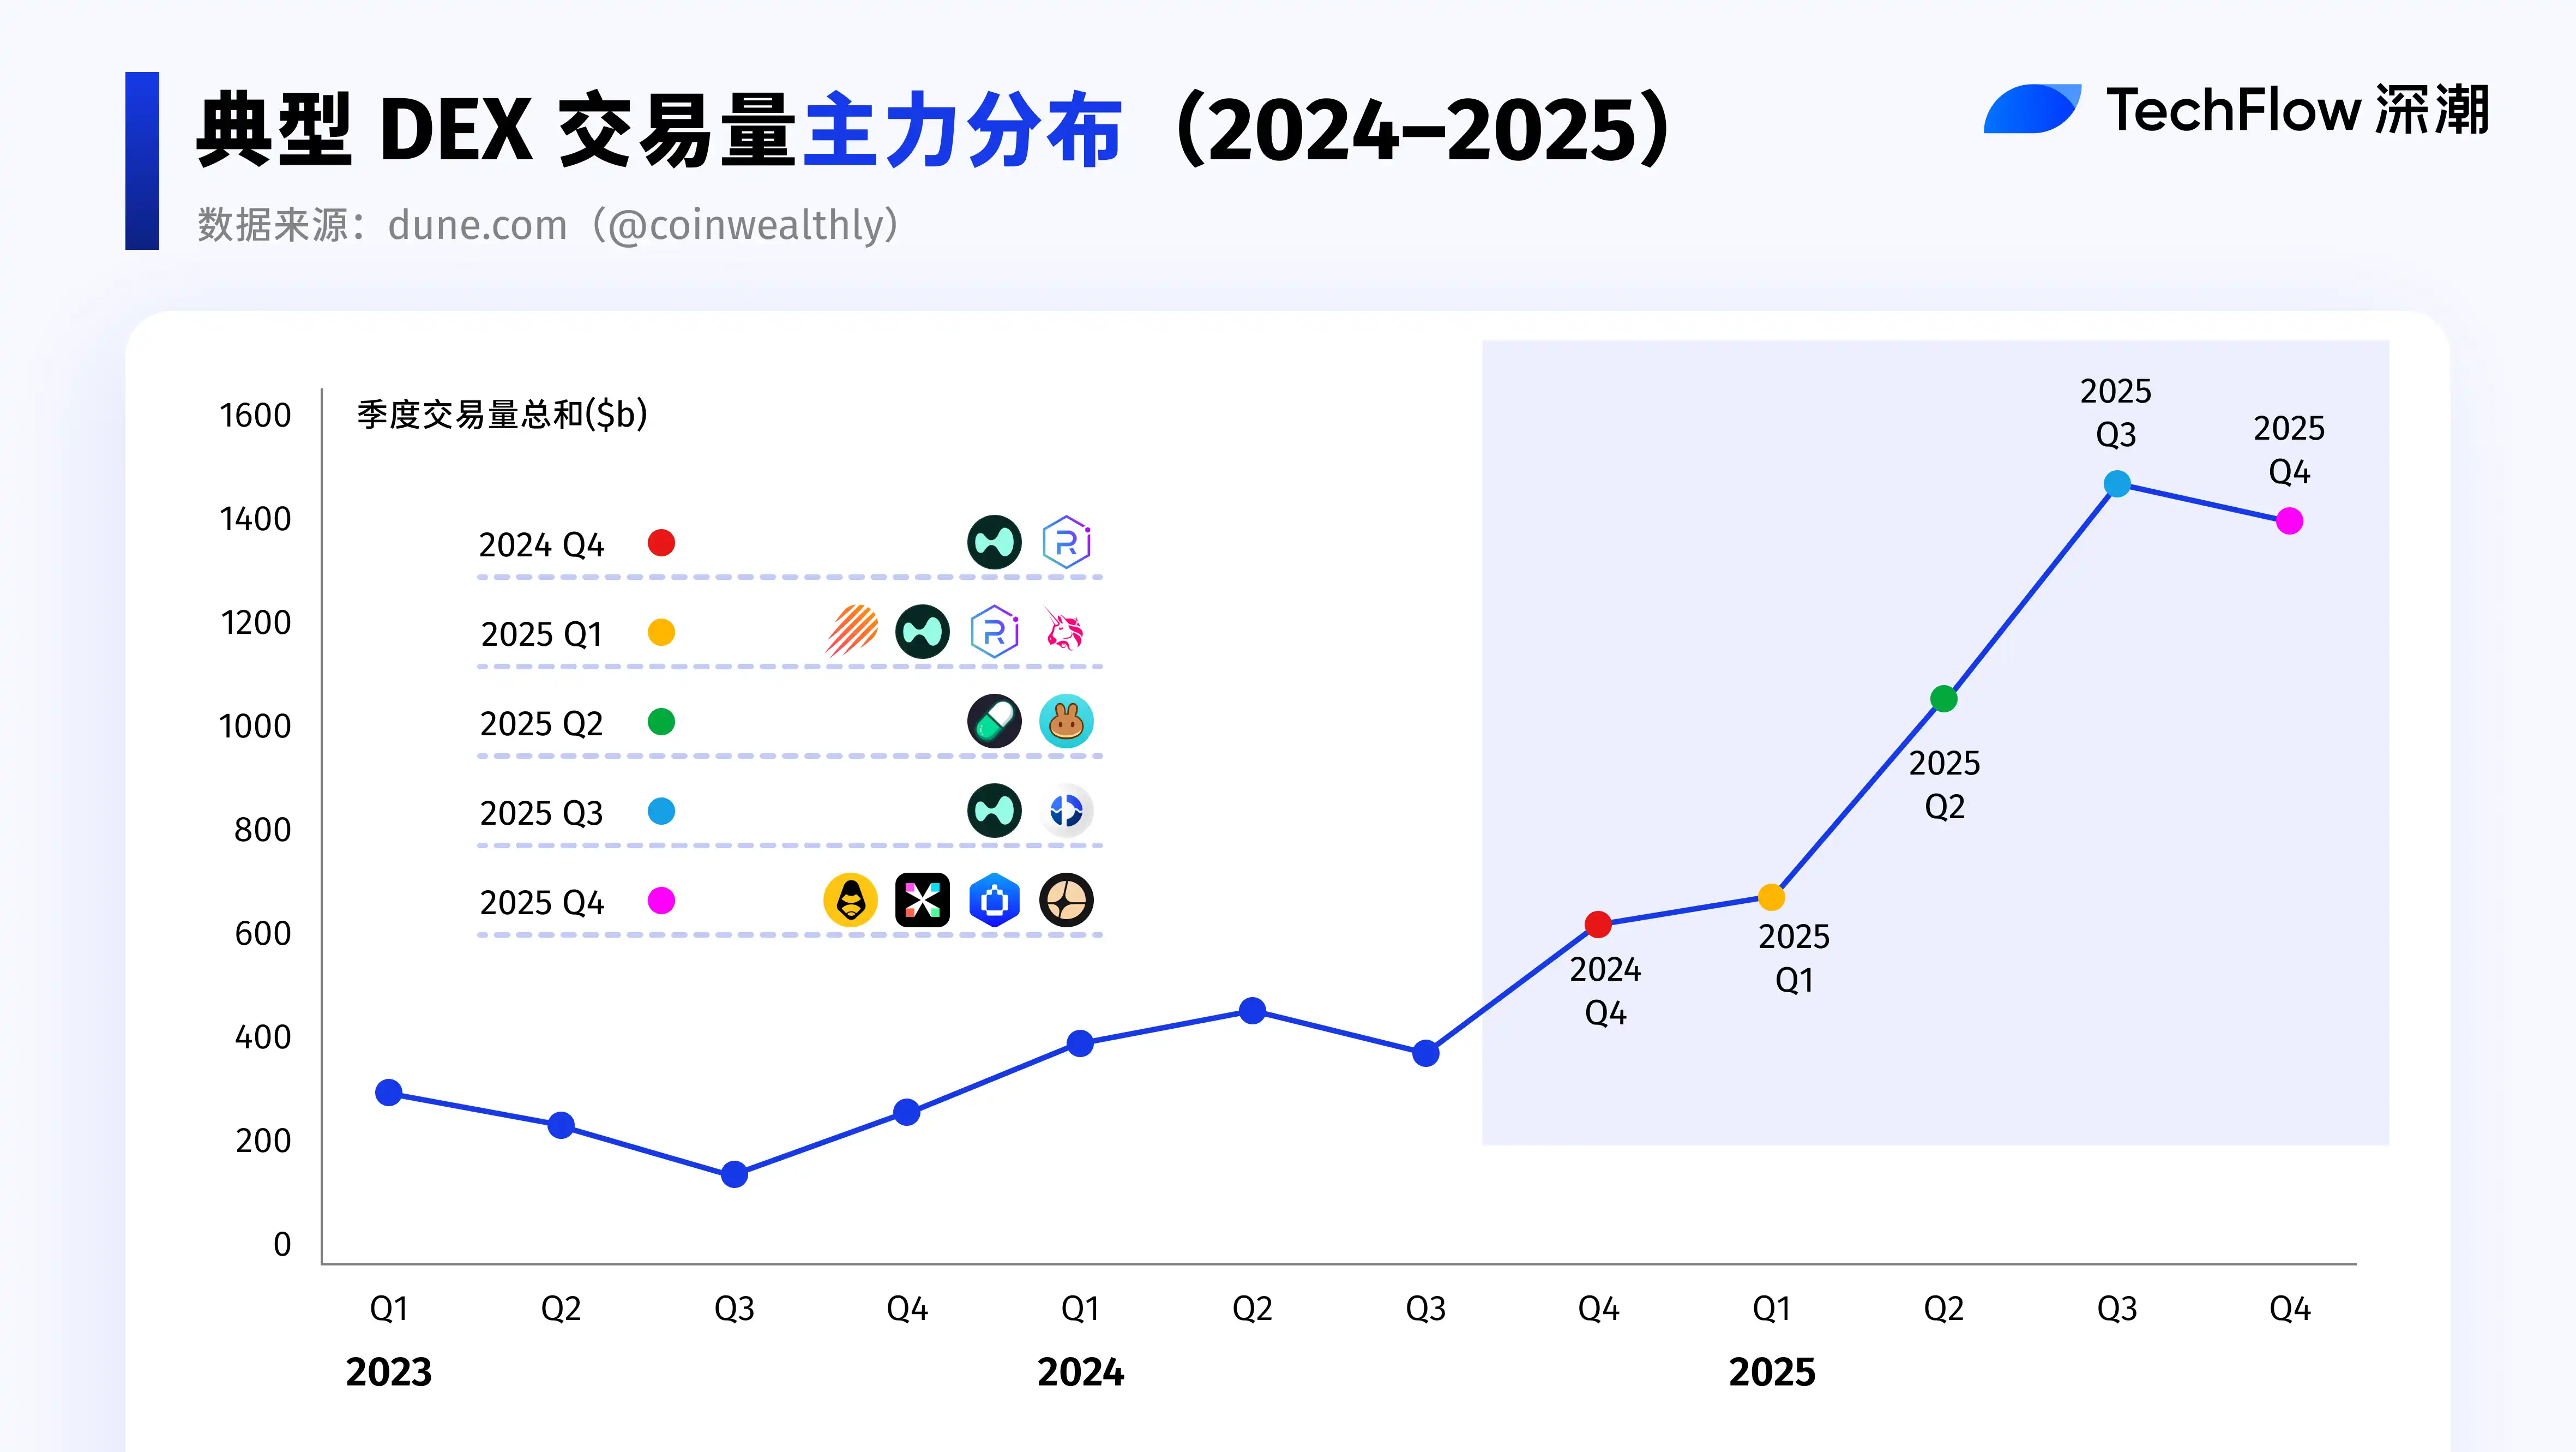
Quarterly Review: Who Led Each Quarter?
2024Q4: Trend Initiation
- Solana ecosystem DEX trading volume surpassed Ethereum's on a quarterly basis for the first time, with activity significantly increasing, becoming the core of阶段性 liquidity.
- The AI narrative, combined with new token issuance platforms, continuously created a large number of new trading pairs, significantly boosting DEX trading frequency and cumulative trading volume.
- Solana DEX: New token trading mainly occurred on Solana DEXs. Relying on the "graduation" and "migration" processes of token launch platforms like Pump.fun, Raydium absorbed a large amount of subsequent liquidity and trading for new tokens in Q4 2024, further consolidating its core role in Solana spot trading.
- Hyperliquid :Hyperliquid, leveraging a successful HYPE airdrop and product design advantages, rapidly expanded its share in the decentralized perpetual contract market, with a market share exceeding 55%.
2025Q1: Ranking Shifts and Hotspot Rotation
- The battle for the top DEX spot became a game of musical chairs, with the trading volume rankings among leading ecosystems反复交替, neck and neck.
- During periods of active celebrity Meme and AI Meme trading and密集 narratives, trading volume on Solana ecosystem DEXs expanded rapidly, temporarily gaining a trading volume advantage.
- As Meme coin trading热度 gradually cooled in February-March, Ethereum,凭借 more robust liquidity and structural capital回流, successfully regained the top spot in DEX trading volume in March.
- CEX Custodial Risks Exposed: Some users began尝试转向 non-custodial, on-chain verifiable DEXs, driving a migration of trading behavior.
2025Q2: Ecosystem Synergy Amplification and Capital Migration
- PancakeSwap: Binance's Alpha project routed related trades to PancakeSwap, directly amplifying the trading activity of BSC ecosystem DEXs. In this process, PancakeSwap became the biggest beneficiary of cross-ecosystem synergy, with quarterly trading volume surging 539.2%.
- The Ethereum Pectra upgrade was officially activated, triggering a strong market reaction. Ethereum surged nearly 44% during the Asian morning session, marking its largest single-day gain since 2021. The market narrative subsequently shifted from Solana and Meme trading to broader ecosystem allocation.
- As liquidity migration accelerated, competition between Solana and BSC showed明显的虹吸效应, with capital and trading activity rapidly rotating between different ecosystems.
2025Q3: Intensifying Competition and Product Integration
- CEX trading volume growth was relatively more significant, driving a recovery in overall market trading activity.
- Uniswap : Uniswap regained some market share and tied with PancakeSwap as leaders in the DEX market.
- Perp DEX competition明显升温. Aster, Lighter, edgeX and other challengers expanded rapidly in trading volume and user base, directly competing with the leading platform Hyperliquid , pushing the market into a white-hot competitive stage. Platforms competed for active traders through airdrops, points, zero-fee, and other incentive mechanisms, further amplifying on-chain derivatives trading demand.
- DEX Ecosystem: DEX aggregators and infrastructure continued to improve, constantly enhancing user experience, retention, and trading stickiness.
- Jupiter :Jupiter Lend attracted over $1 billion in deposits within just ten days of its launch. The previously relatively constrained lending demand within the Solana ecosystem was rapidly activated. Supported by Fluid's underlying lending architecture, the爆发 of Jupiter Lend further validated the strong appeal of the DEX + Lending model to capital.
2025Q4: Extreme Market Volatility and Sector Divergence
- The extreme market conditions triggered by the 1011 liquidation event pushed market trading volumes higher in the short term, resulting in阶段性偏高 data. The event exposed systemic risks at the CEX level, while连环贷 and leveraged liquidations impacted DEXs.
- Lighter and edgeX : As market confidence gradually recovered, the Perp DEX sector returned to its growth trajectory. Platforms like Lighter and edgeX expanded rapidly in trading volume and user base, narrowing the competitive gap with the leading platform Hyperliquid, pushing the Perp DEX market into a high-intensity competition phase.
- Aster :CZ publicly disclosed personal holdings of ASTER, followed by Aster being listed on mainstream trading platforms like Binance and Robinhood. As a leading Perp DEX in the BSC ecosystem, Aster has the capability to compete head-to-head with leading Solana-based platforms like Hyperliquid in the perpetual contract DEX arena.
- HumidiFi:In the spot DEX space, Uniswap's market share has been continuously declining since the end of Q3, with部分交易量被 upstart platforms like HumidiFi capturing, reflecting the evolution of the spot DEX competitive landscape from a single leader towards a more fragmented multi-platform scenario.
After analyzing the best performers of each quarter, let's take a further separate look at Perp DEX and Spot DEX.
Perp DEX: The Real Growth Engine of 2025
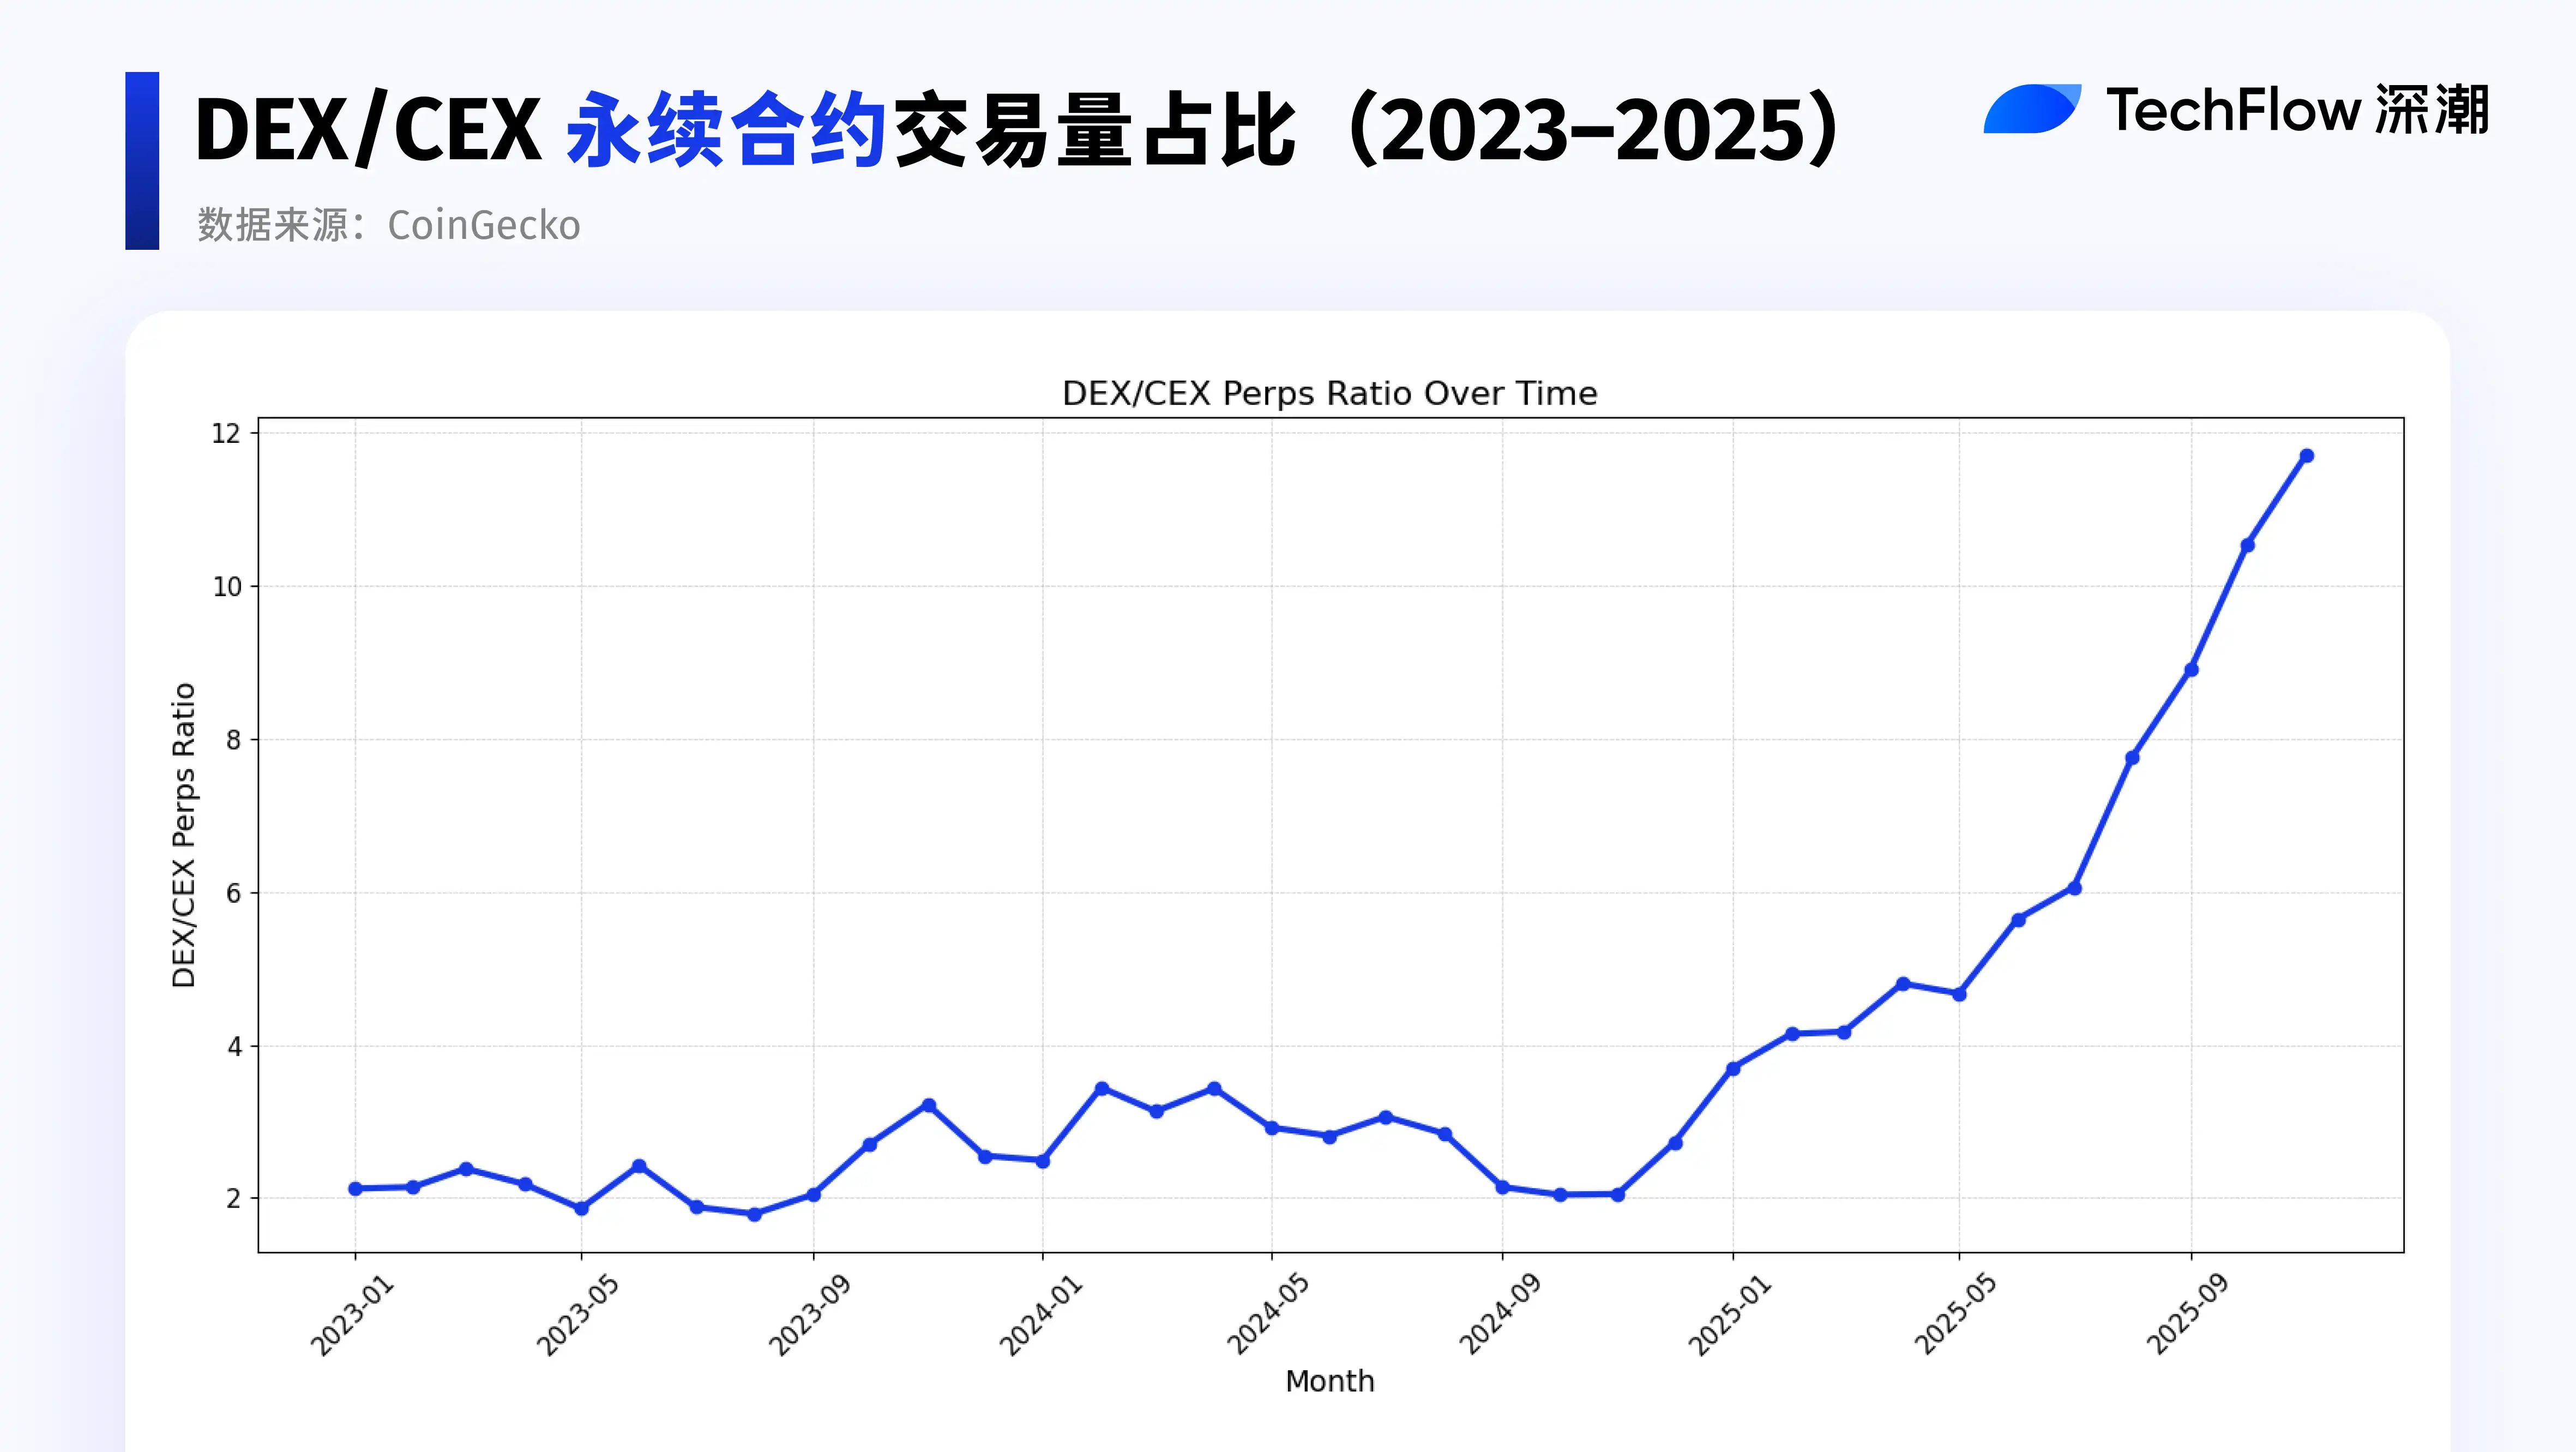
Data source: CoinGecko
Data from the past three years is特地选取 here to observe the proportion of DEX/CEX perpetual contract trading volume.
It can be seen that this indicator rose comprehensively within 2025, whereas its performance was relatively mediocre in previous periods.
2025 became the true take-off year for Perp DEX.
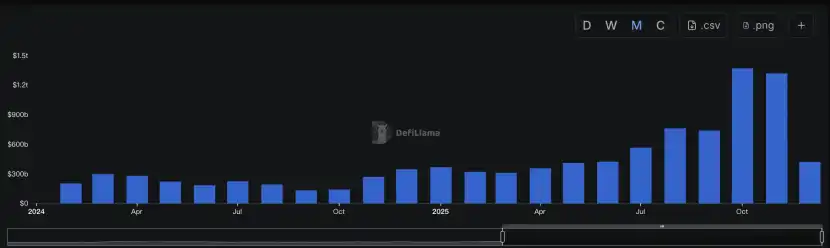
According to DeFiLlama statistics, the incremental trading volume of Perp DEXs in 2025 reached $7.348 trillion.
In contrast, the cumulative trading volume of perpetual contract DEXs from early 2021 to the end of 2024 was only $4.173 trillion.
This means that Perp DEX achieved a net trading volume growth of approximately 176% in a single year, 2025. The新增 trading scale in one year has significantly exceeded the historical total of the previous four years combined.
Meanwhile, trading volume showed明显加速上涨 starting from the third quarter of this year. With intensifying competition and the gradual maturation of various innovative products, the perpetual contract DEX sector as a whole began to attract sustained attention from market capital, with liquidity levels同步提升.
Data source: DeFiLlama
From早期体量有限、参与度分散 to being ignited by both market sentiment and capital structure, the market activity of Perp DEX is entering a whole new magnitude.
Perp Volume: Core Metric of Capital Turnover Intensity
Data source: DeFiLlama
The strength of Perp DEX lies in how fast it can make capital turn over.
From a metric perspective, Perp Volume is a key indicator for measuring perpetual contract DEXs.
It reflects the turnover intensity and usage frequency of capital.
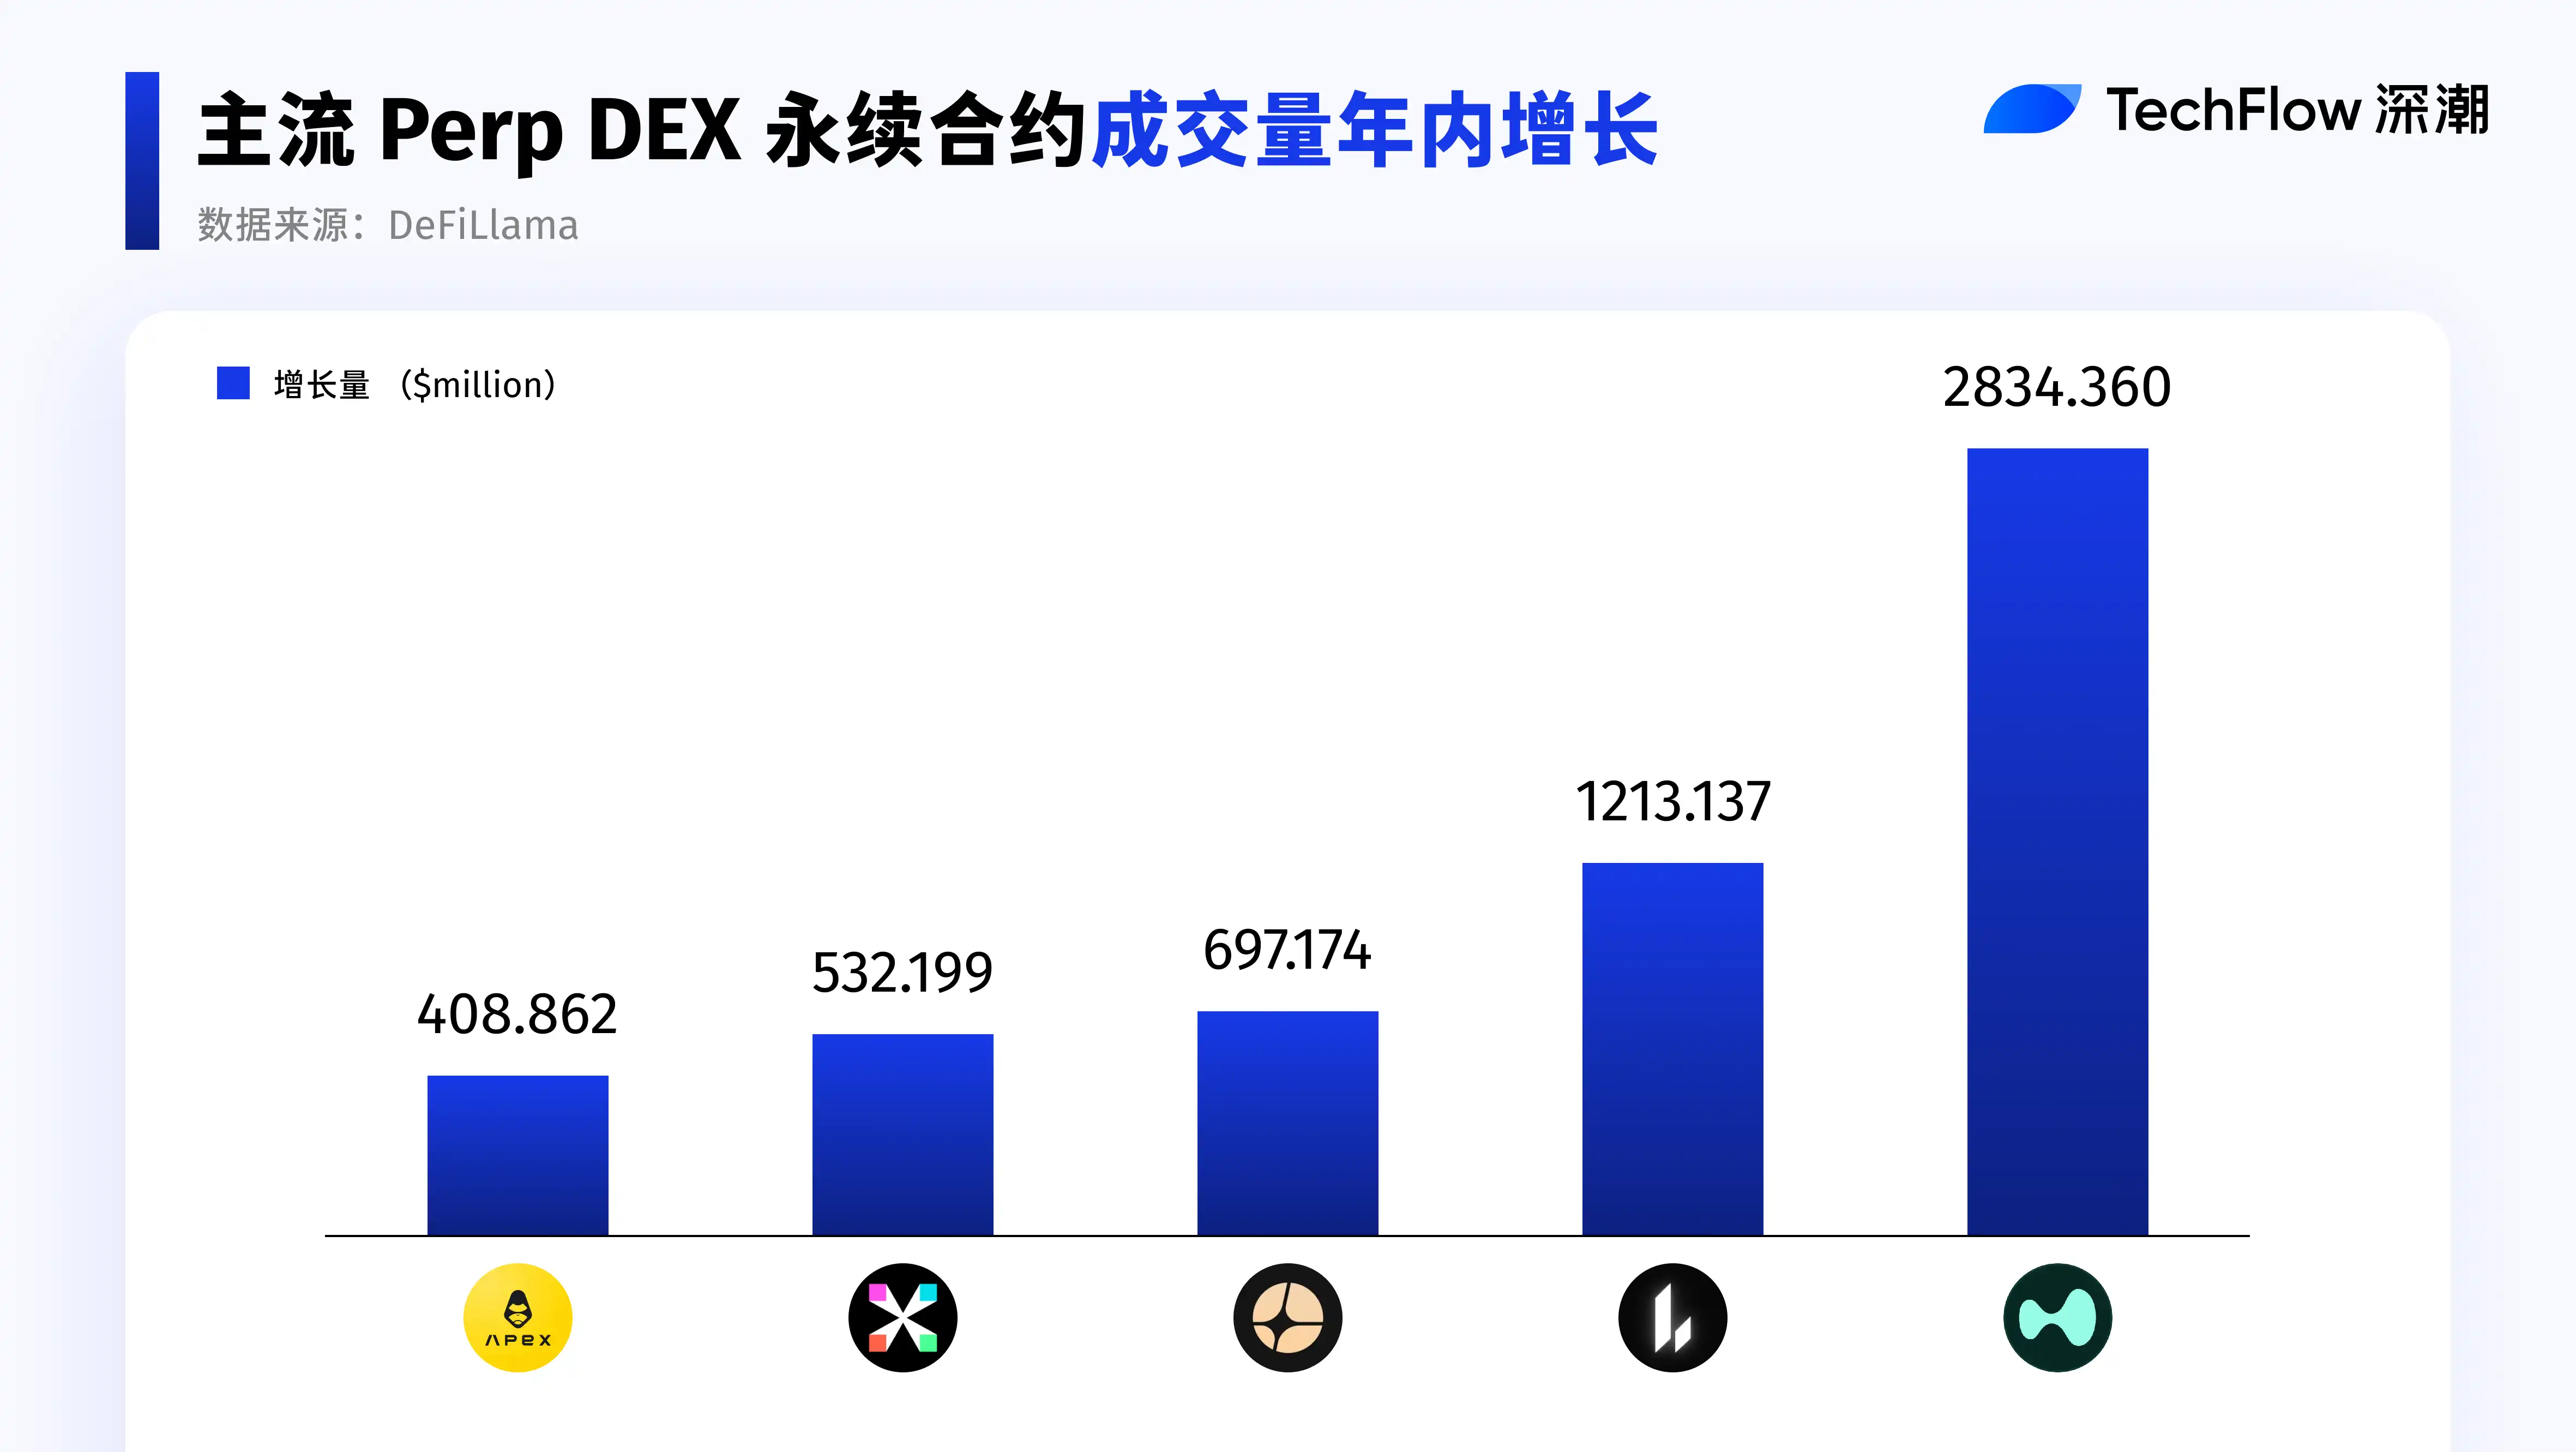
Looking at the increment in Perp Volume during the year:
- Among them, Hyperliquid and Lighter have sustained high-speed growth since 2025, with trading activity and capital turnover efficiency同步放大.
- Aster then奋起直追 after the third quarter, becoming one of the fastest-growing platforms during the year.
- In contrast, the veteran dYdX and GMX did not make it to the top of the annual增量榜单. Although their historical cumulative trading volumes are still considerable, their新增 trading volume in 2025 was both below 100M, with a noticeably slower overall growth pace.
Open Interest: Risk Exposure and Head Concentration
For Perp DEX, Open Interest (OI) - the total nominal value of outstanding contracts - is an unavoidable core metric.
Simply put: If Perp Volume is the flow, OI is the stock.
Perp Volume represents trading activity, while OI indirectly reflects whether capital is willing to leave positions on the platform.
As derivatives, the trading volume of perpetual contracts更多地反映 liquidity and matching activity; the real amount of capital staying in the market depends on OI.
From the platform's perspective, OI reflects the protocol's ability to bear risk and the scale of capital;
From the user's perspective, OI reflects trading demand and capital stickiness.
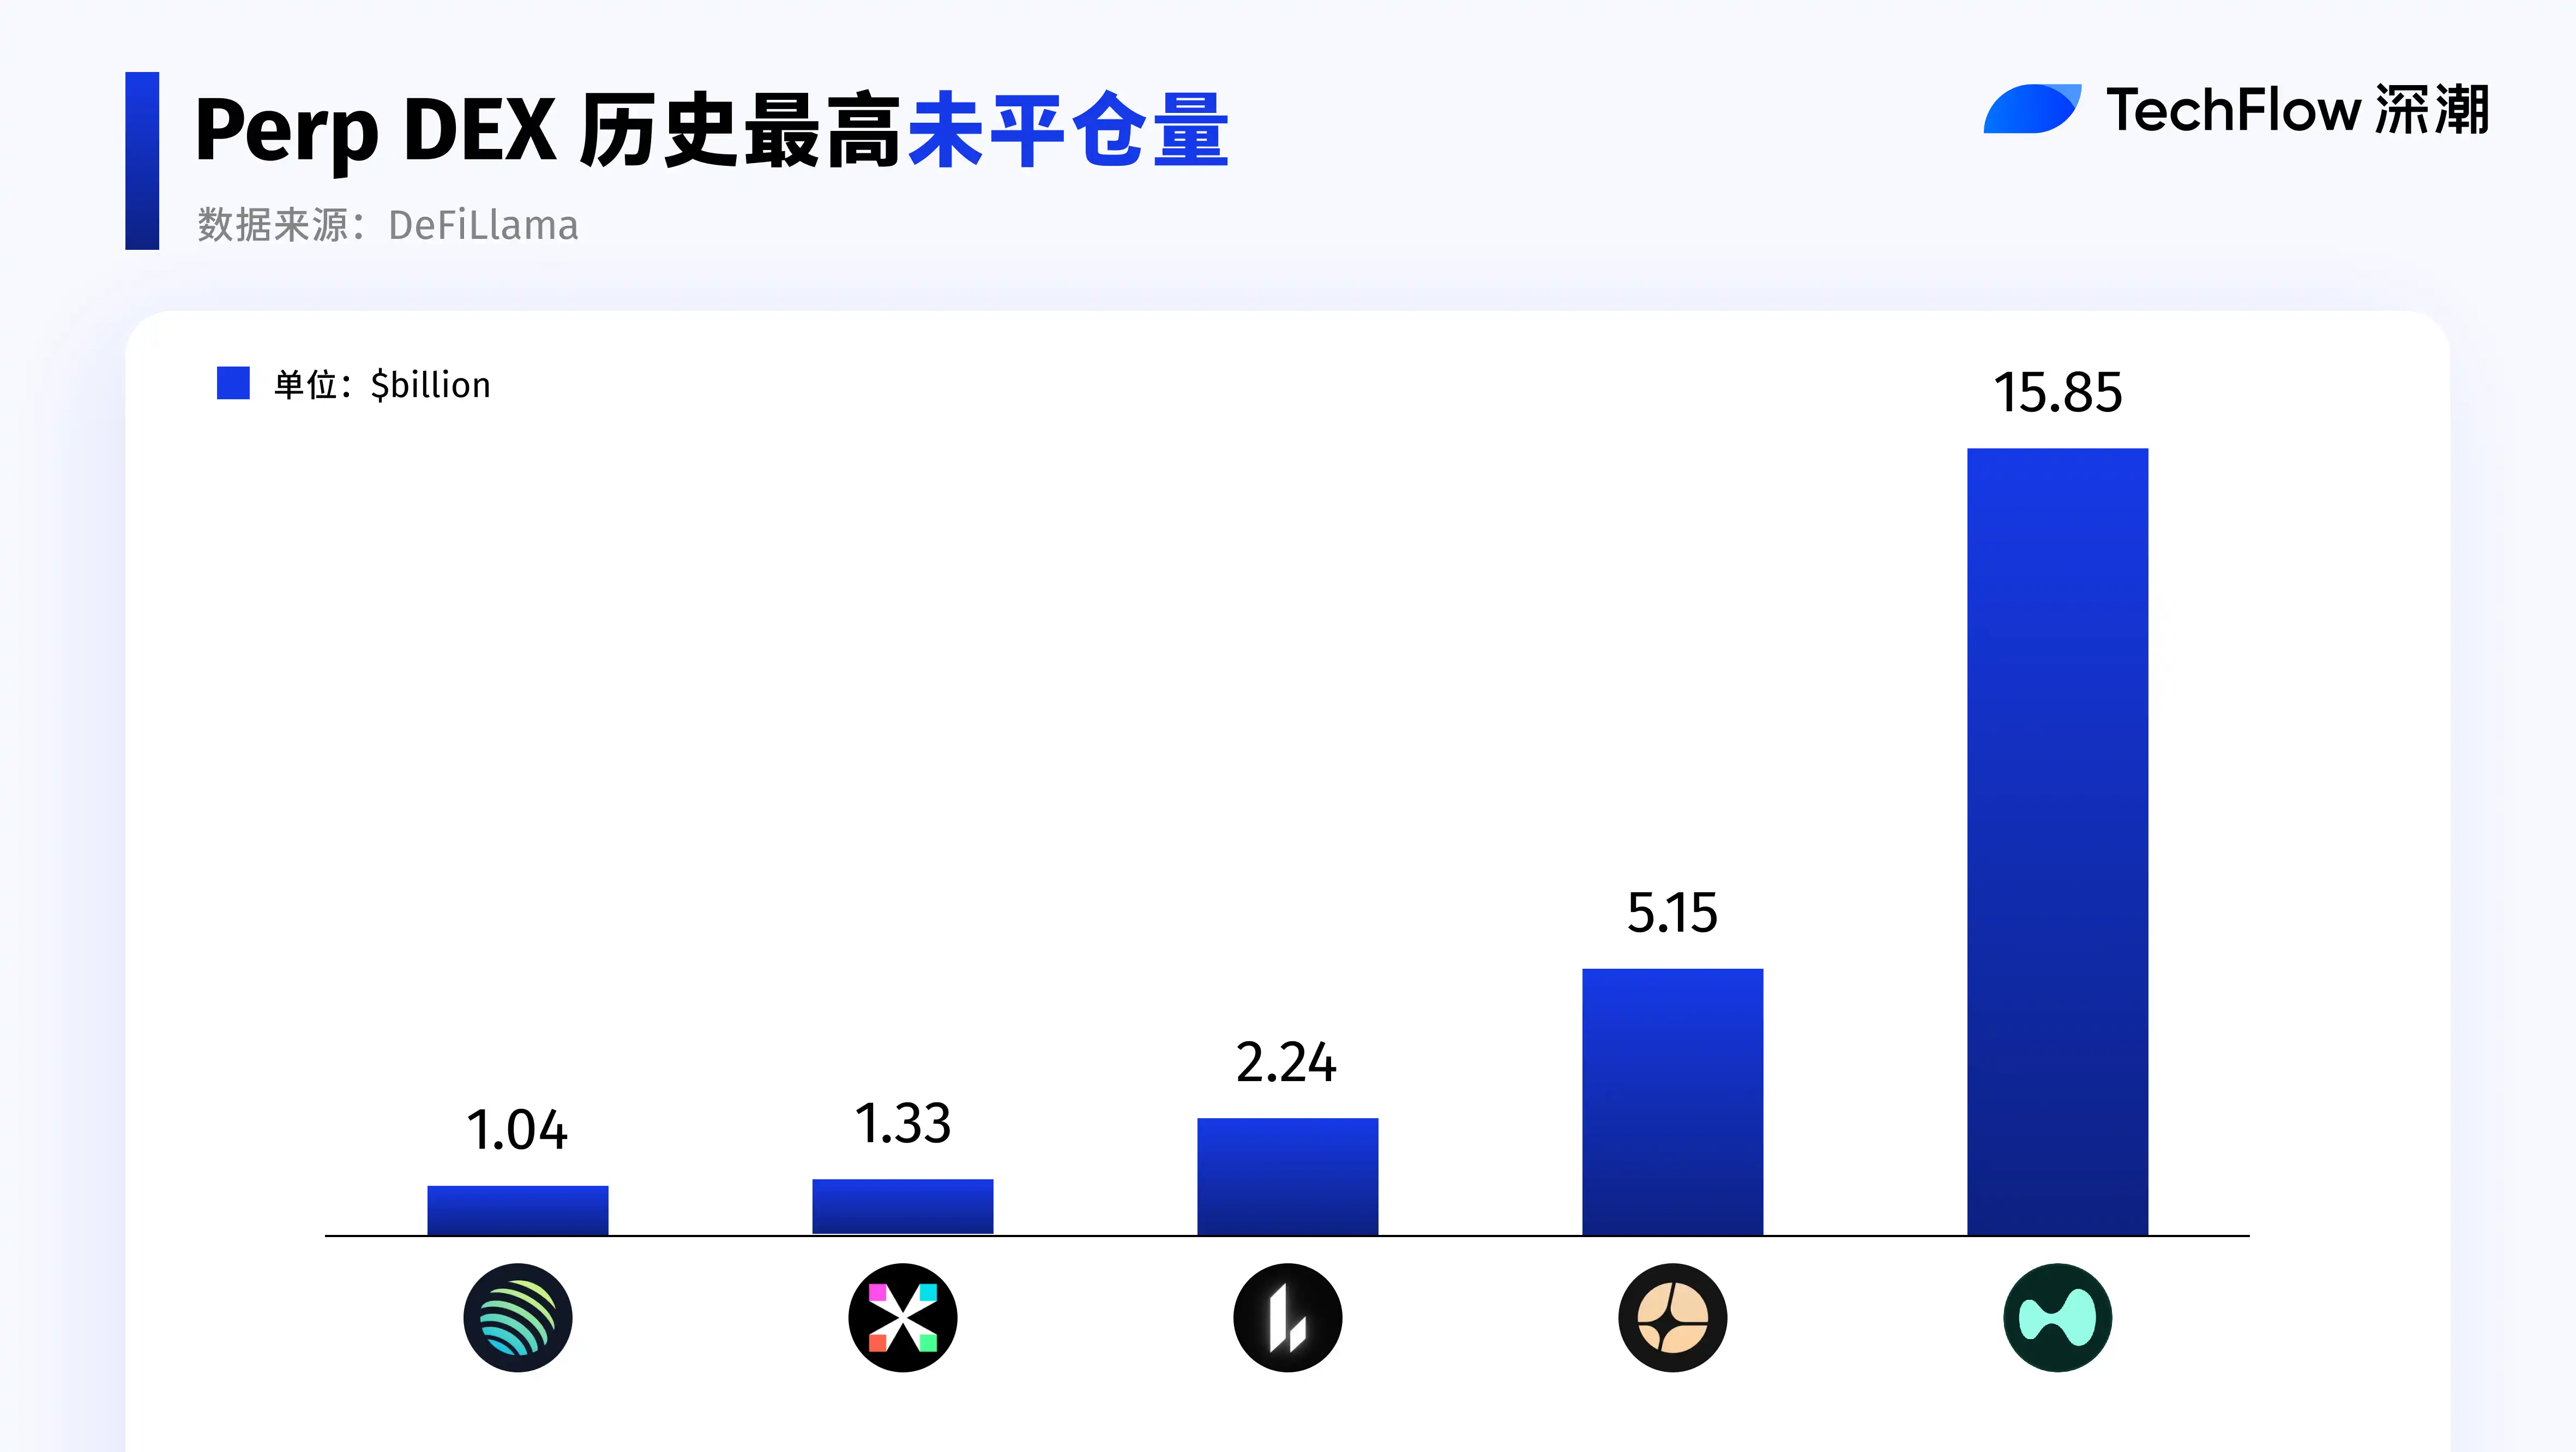
Therefore, given that Perp Volume already has sufficient liquidity and trading activity, we further screen for the top five protocols with outstanding OI performance.
Data source: DeFiLlama
OI is extremely concentrated. The top five protocols absorb the vast majority of the open interest, with a clear断层. The OI size of the sixth rank is about one-third of the fifth, directly widening the gap. Capital in Perp DEX is highly sensitive to depth, stability, and liquidation mechanisms, and positions tend to concentrate towards a few mature platforms.
Post 10·11 Impact: Differential Recovery Performance of Perp DEXs
When trading heat subsides and risks are集中释放, the differentiation of Perp DEXs is no longer reflected in transaction规模, but in capital retention and修复韧性 after the OI retreat from ATH.
Aster:
- After completing market造势 in the third quarter, it demonstrated the strongest capital retention capability.
After hitting an OI high on October 5th, even entering Q4, its retention rate relative to ATH OI remained above 72% for a long time; after the 1011 event, its ecological recovery speed was also among the领先水平, showing the most稳健 recovery performance.
Lighter:
- The recovery节奏 was also relatively fast, with current OI recovering to about 87% compared to ATH, indicating clear capital回流.
Hyperliquid:
- Although the overall size remains the largest, looking at ATH OI, the open interest once retreated over 60%; as of now, OI has not returned to its high, only recovering to about 61% of the average level before the 1011 event, showing a明显走弱 overall performance.
Perp Revenue Performance: Growth Differences Among Protocols with Different Positioning
Since protocols can attract so much capital, the key question is: Are they actually profitable?
This brings us to protocol revenue.
Therefore, below we select representative Perp DEX protocols,
Starting from revenue performance and changing trends, we observe their performance in this 2025 cycle.
Here, we selected four types of protocols with different positioning to compare their revenue performance:
- Hyperliquid: As the leading representative of specialized Perp DEXs
- Jupiter: As a representative of multi-business platforms that include Perp DEX business
- edgeX: As a representative of new specialized competitors
- GMX: As a representative of veteran Perp DEX protocols
Before analysis, let's segment the market for the protocols:
First, product focus:
- Specialized Perp Dex
- Multi-business platforms (Perp is only one business line)
Second, lifecycle stage:
- New entrants
- Mature protocols
- Veteran protocols
The core purpose of this division is to answer one question:
Under different positioning and stages, who has the strongest revenue growth momentum?
It is important to emphasize that仅仅观察 the growth scale of absolute revenue value is not sufficient to depict the real change trend in 2025.
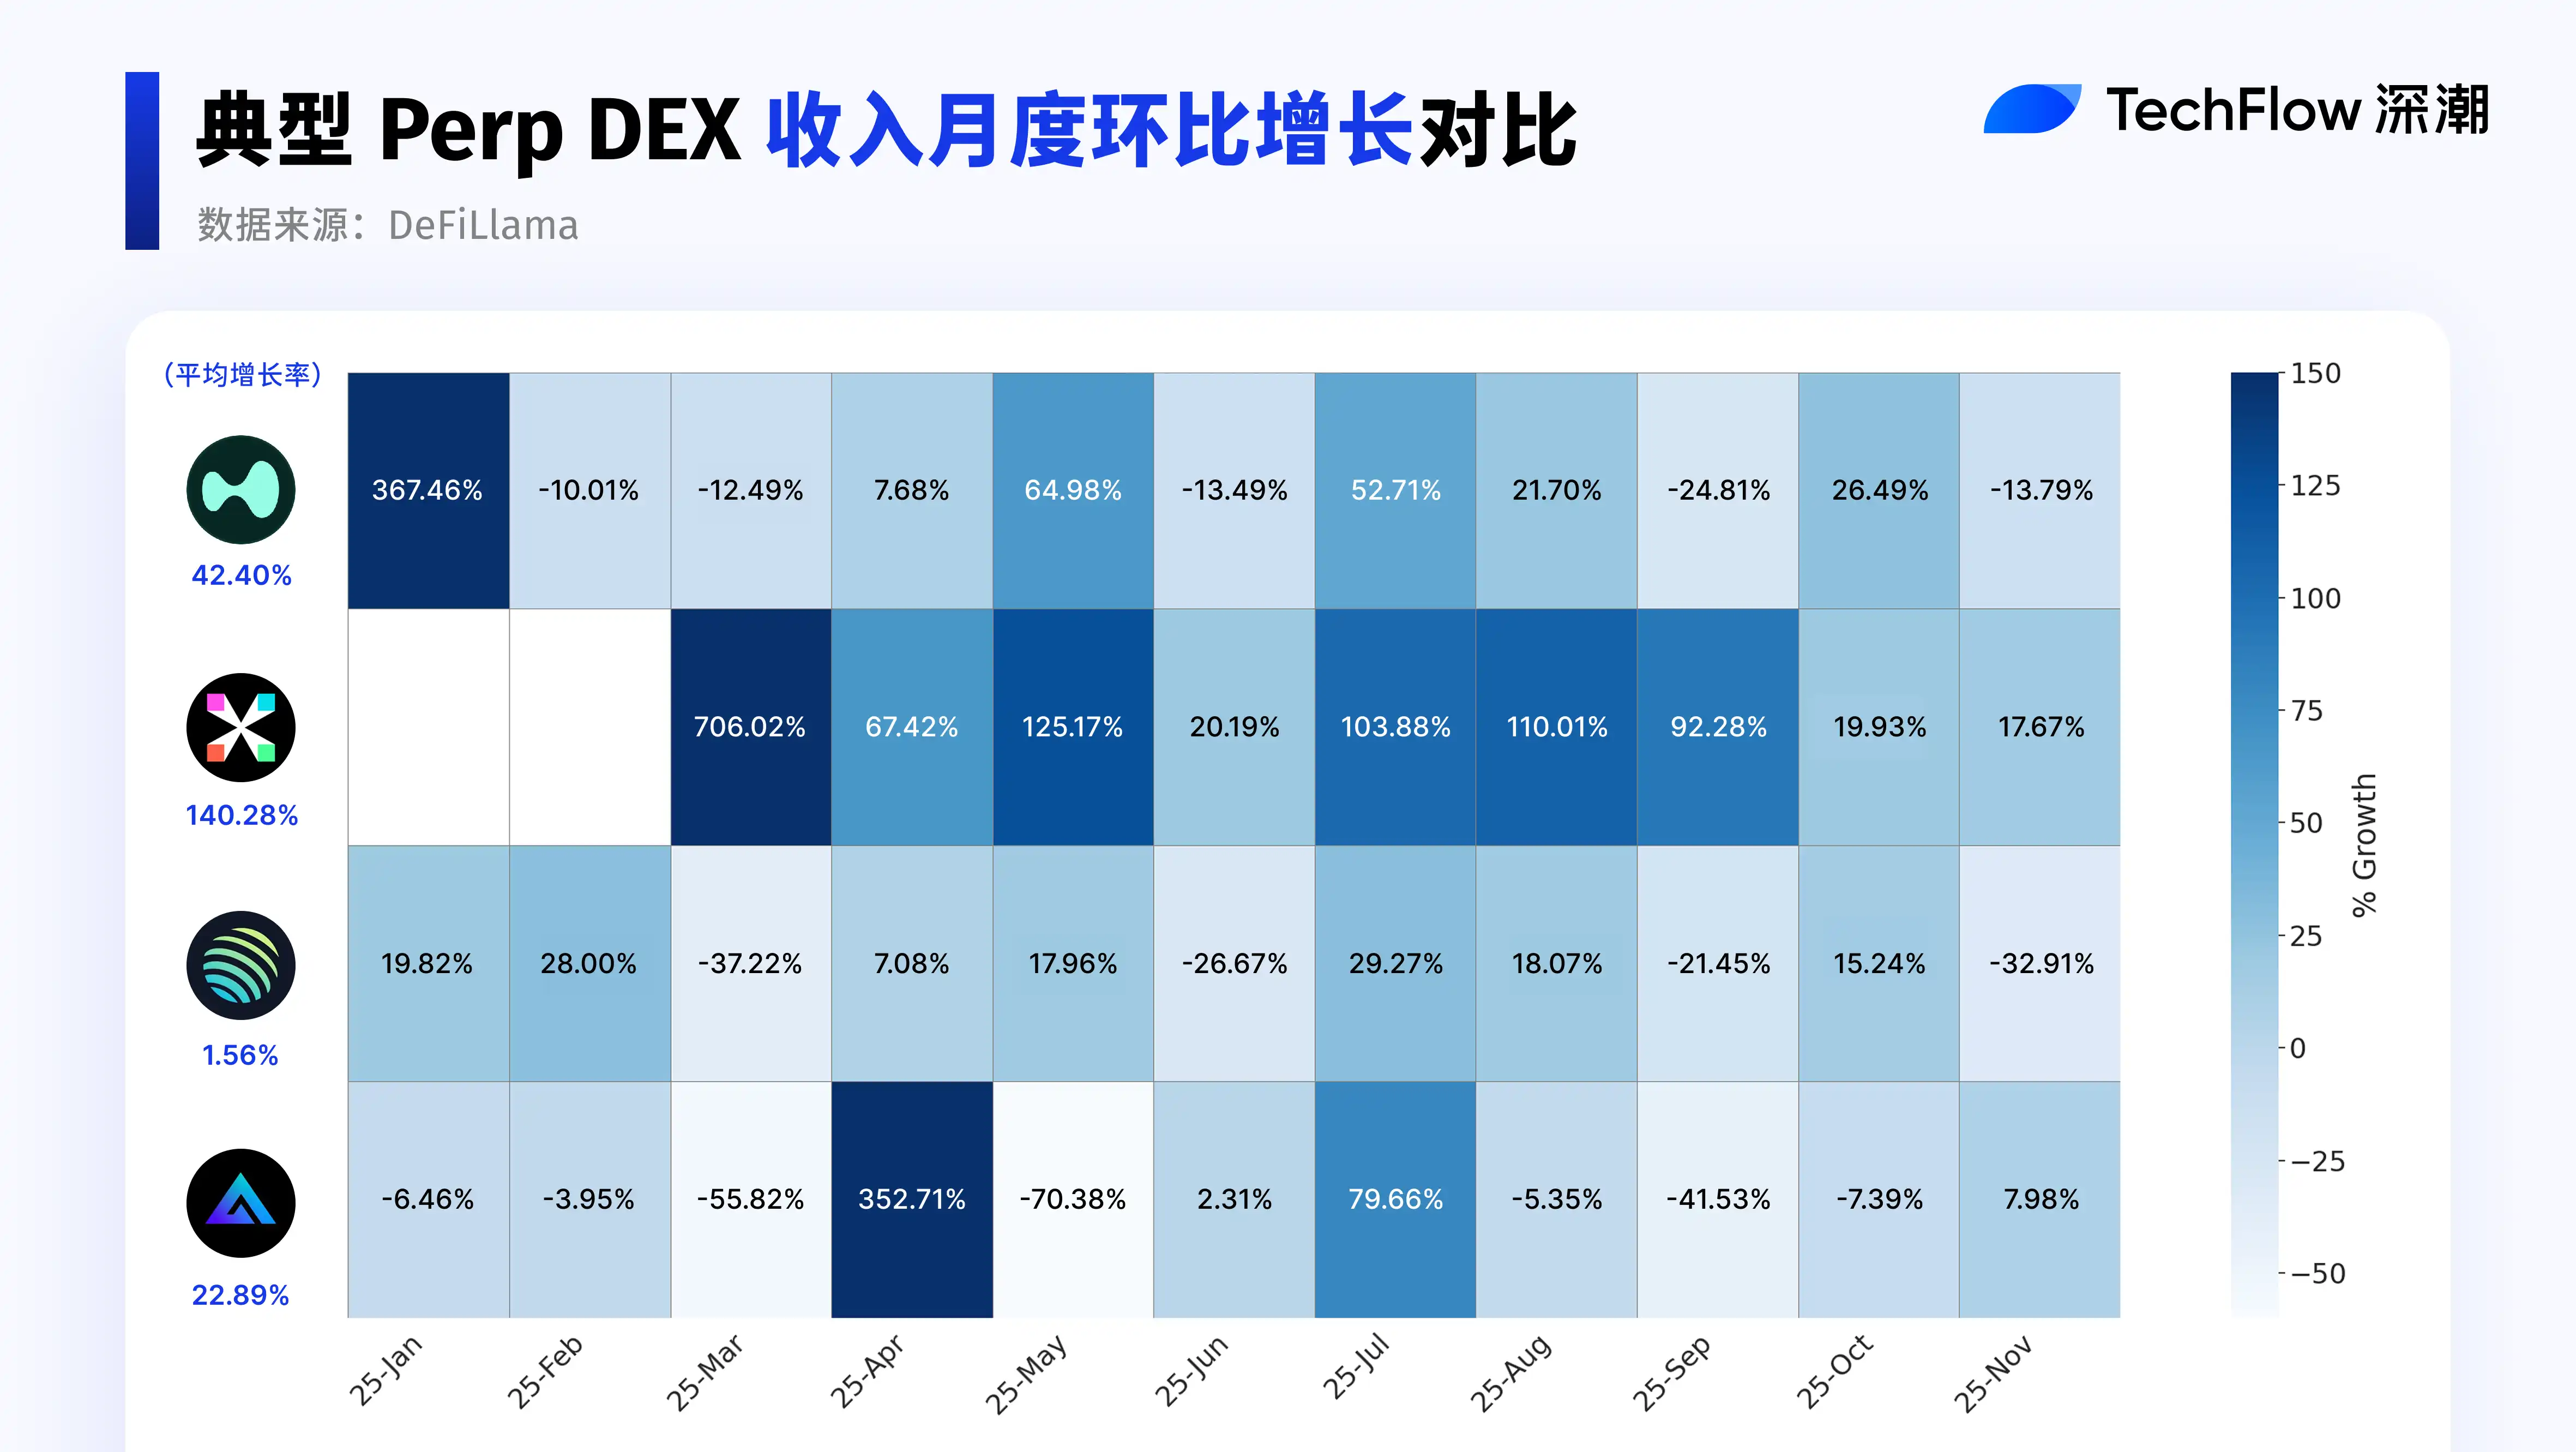
Therefore, we select December 2024 as the base period and further observe the month-over-month revenue growth situation to more clearly capture the speed and differences in protocol revenue growth.
Data source: DeFiLlama
From the heatmap, it can be clearly seen that July became a time node when the revenue performance of multiple protocols grew rapidly simultaneously.
Specifically:
- edgeX showed the most outstanding growth performance during 2025.
Although revenue growth slowed down after September, from the perspective of full-year average growth rate, edgeX仍然位居前列. As a successfully emerged startup Perp DEX, its revenue performance during the year remains impressive.
- Hyperliquid has entered the growth stage, with revenue growth showing stable expansion on a high base,整体维持在较高水平, but marginal growth rate tends to flatten.
- Since Jupiter primarily acts as a trading entry and routing layer, its transactions are often executed on underlying protocols, and fee revenue needs to be shared with the execution layer. Revenue growth明显慢于 trading scale expansion,整体更偏平稳.
- GMX's average revenue growth rate is about 22%. As a veteran protocol, growth mainly comes from the retention of some users. If it can sustain this growth rate on its existing base scale in the long term, its business model still possesses long-term viability.
Spot DEX: Liquidity Depth and Ecosystem Competition Landscape
Data source: CoinGecko
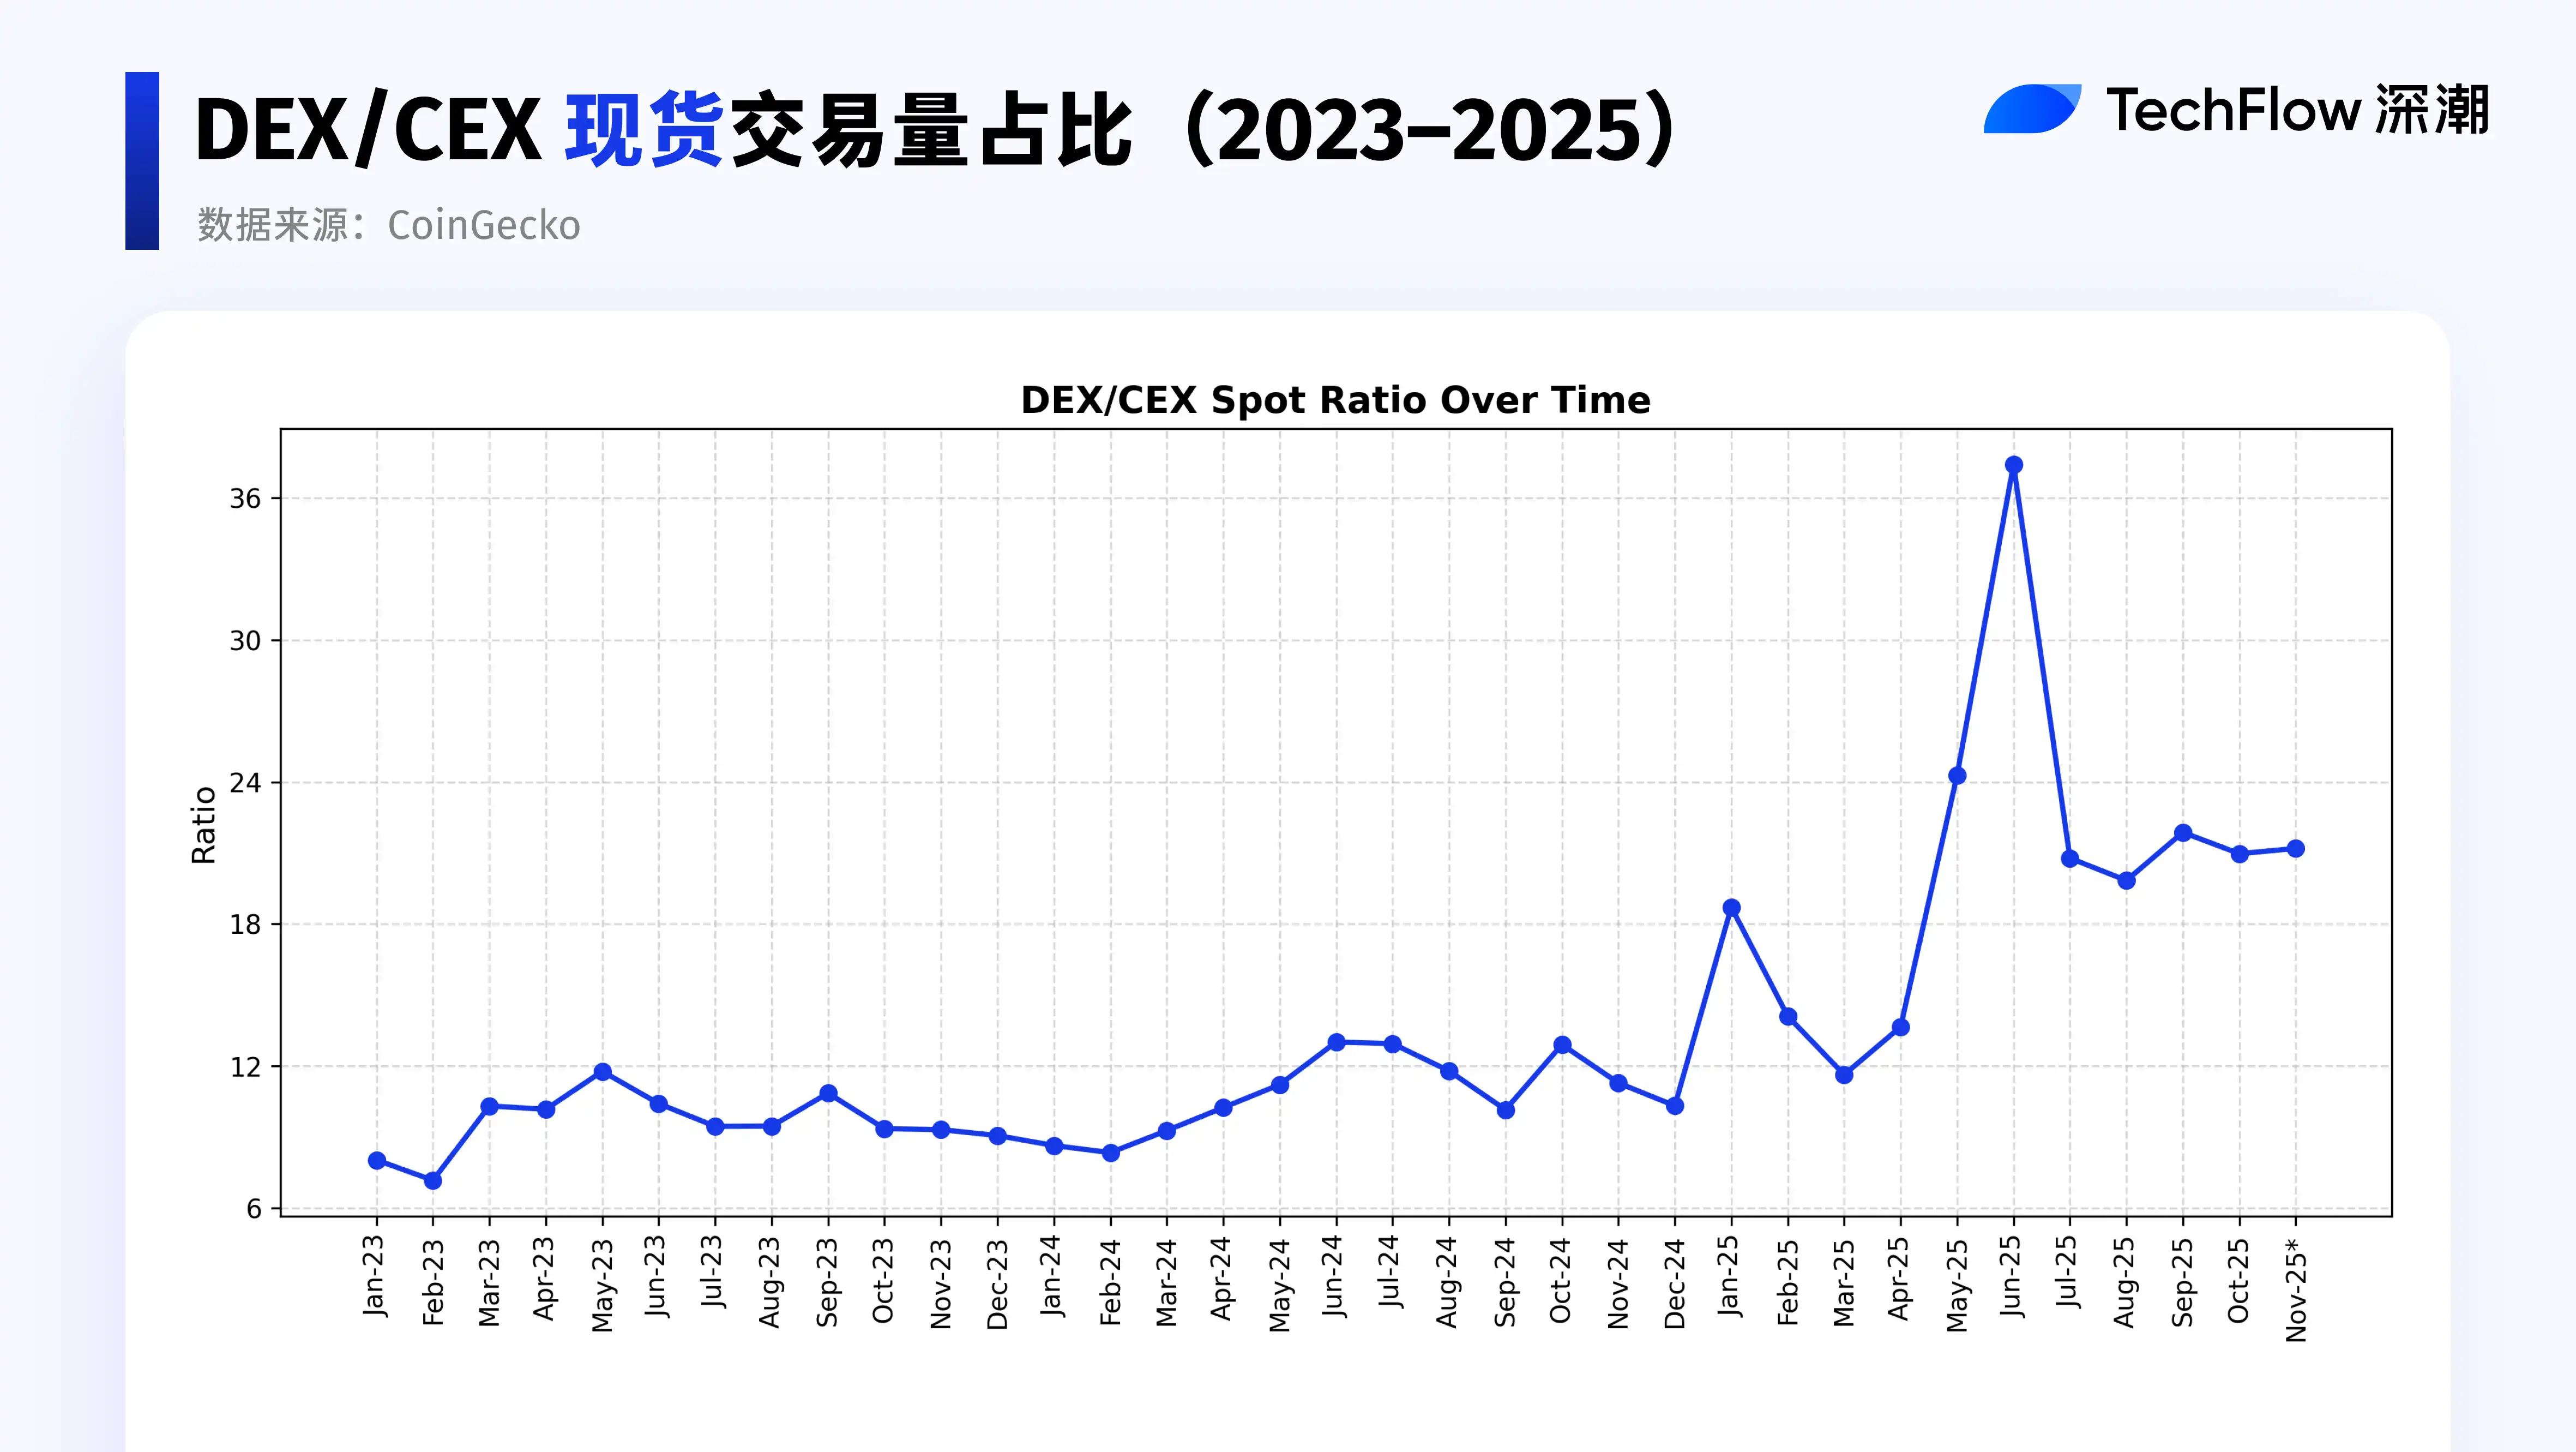
Compared to the previous two years, the DEX/CEX spot trading volume ratio also明显上行 in 2025. It reached a阶段性高点 in June and rose again in the fourth quarter.
TVL: Spot Liquidity Depth and Capital Commitment Willingness
In the Spot DEX system, TVL mainly comes from assets provided by LPs to trading pools. A higher TVL indicates that more capital is willing to bear impermanent loss and contract risks, participate in market making, and obtain fee or incentive income. TVL better reflects capital's judgment on the rules, risk structure, and long-term sustainability of Spot DEXs, making it suitable as one of the core reference dimensions for ranking spot DEXs.
Data source: Tokenterminal
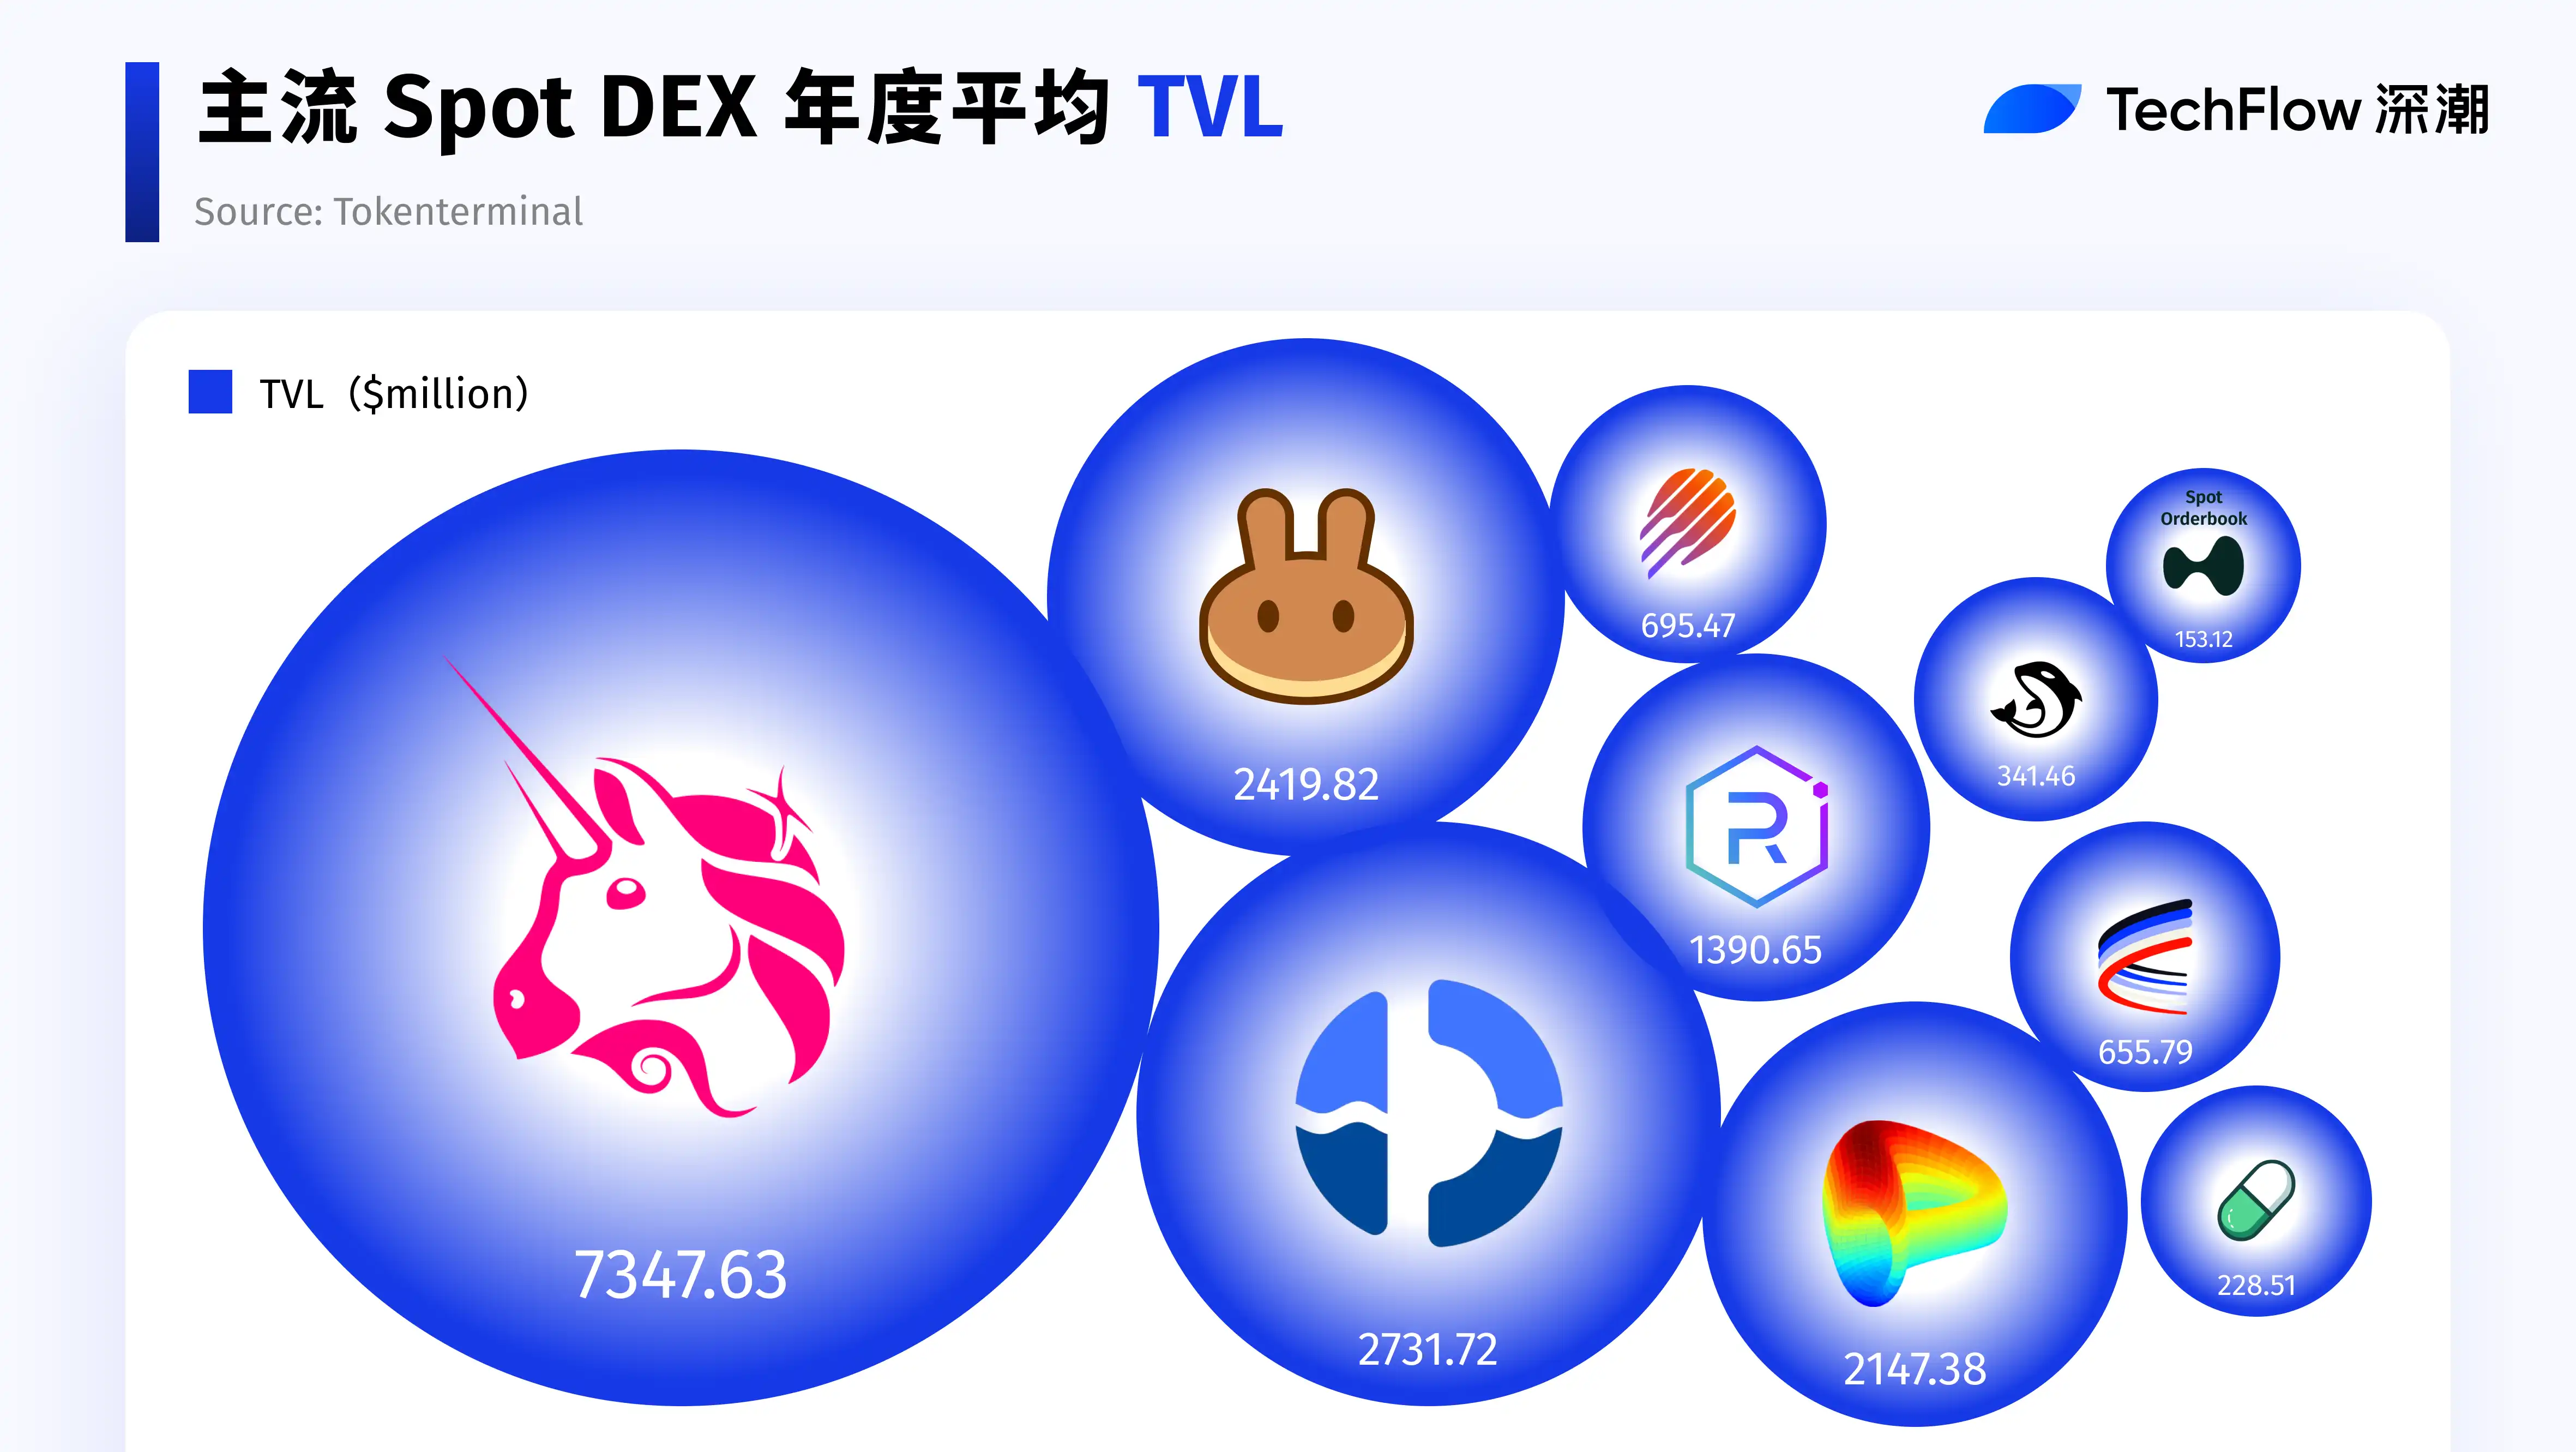
From the perspective of TVL, Uniswap still leads with approximately $7.3 billion, maintaining a significant liquidity advantage in spot DEXs and continuing to serve as the core trading hub for the Ethereum ecosystem.
Fluid and PancakeSwap form the second tier, both with TVL above $2 billion, benefiting from cross-ecosystem expansion and increased BSC trading activity respectively, showing突出 growth momentum during the year.
Curve and Raydium are in the middle range; the former focuses on stablecoin and low-volatility asset trading, with stable TVL but relatively restrained expansion pace; the latter is deeply tied to the Solana ecosystem,更多反映 the liquidity changes of a single ecosystem.
Among the top 10 protocols by average TVL in 2025, Fluid showed the most significant growth during the year, with Q3 TVL reaching about $5 billion, and PancakeSwap also showed明显扩张 in the same period.
Trading Volume: The Collective Rise of the Solana Camp
Data source: DeFiLlama
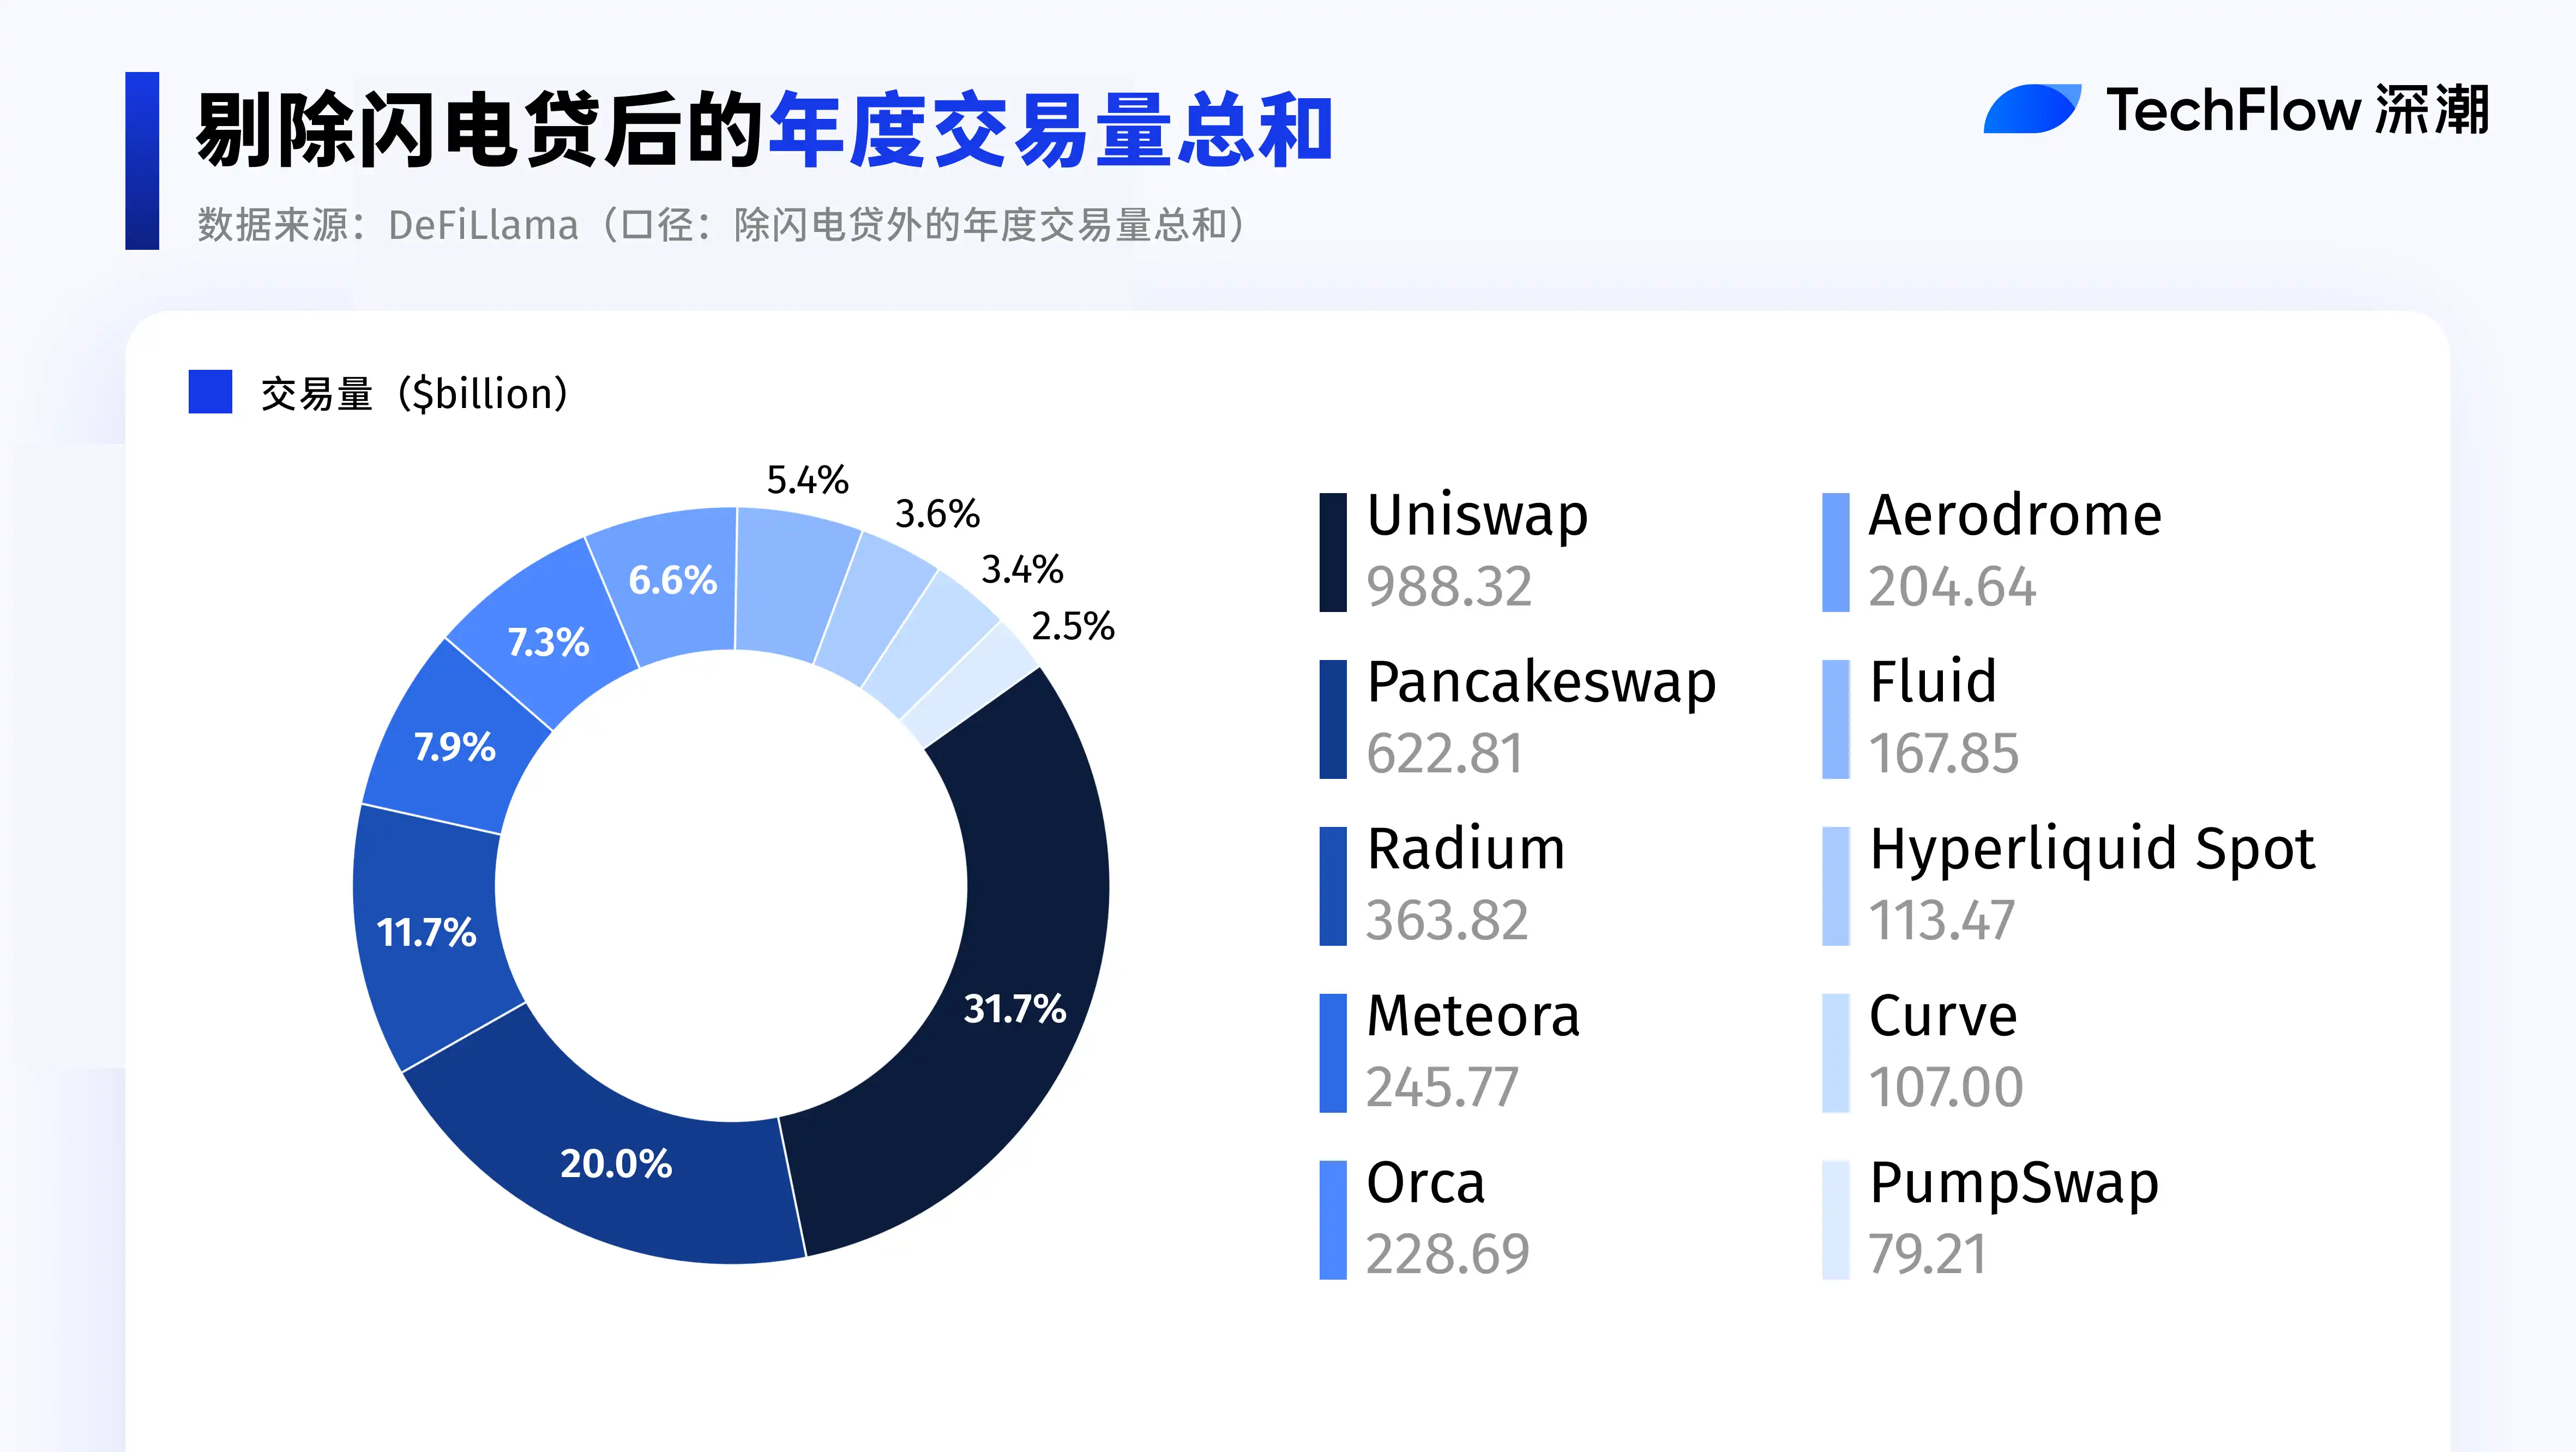
Here, the annual trading volume sum after excluding flash loans is used as the statistical caliber. Since flash loans often leverage极小、瞬时的资金敞口 to撬动较大的名义成交量,容易放大 the trading volume indicator, they are excluded from the analysis to more accurately reflect real trading demand.
From the share distribution, Uniswap and PancakeSwap still dominate absolutely, together accounting for over half, indicating that liquidity in mainstream spot DEXs remains highly concentrated in a few leading protocols.
It is worth mentioning that the combined share of Solana-based DEXs is already接近 the size of Uniswap's single protocol, indicating that the overall competitiveness of the Solana ecosystem in spot DEX trading has significantly improved; however, its internal structure still presents a multi-protocol分散格局.
Clues Behind P/F Fluctuations: 2025 Spot DEX Timeline
With such a large scale, as a key part of DeFi, are Spot DEXs actually making money? Let's look at the data.
Given the focus on annual performance, only阶段性变化 are discussed. Also, as multiple protocols陆续引入 token buybacks or burns, fee distribution, and structural adjustments in 2025, the explanatory power of FDV has somewhat declined.
Therefore, the P/F ratio based on circulating market capitalization is used here to measure how much valuation multiple the market is willing to pay for each unit of fee revenue.
P/F does not directly reflect profit levels but rather depicts the market's expectation of the potential monetization capability of Spot DEXs under the current scale of economic activity.
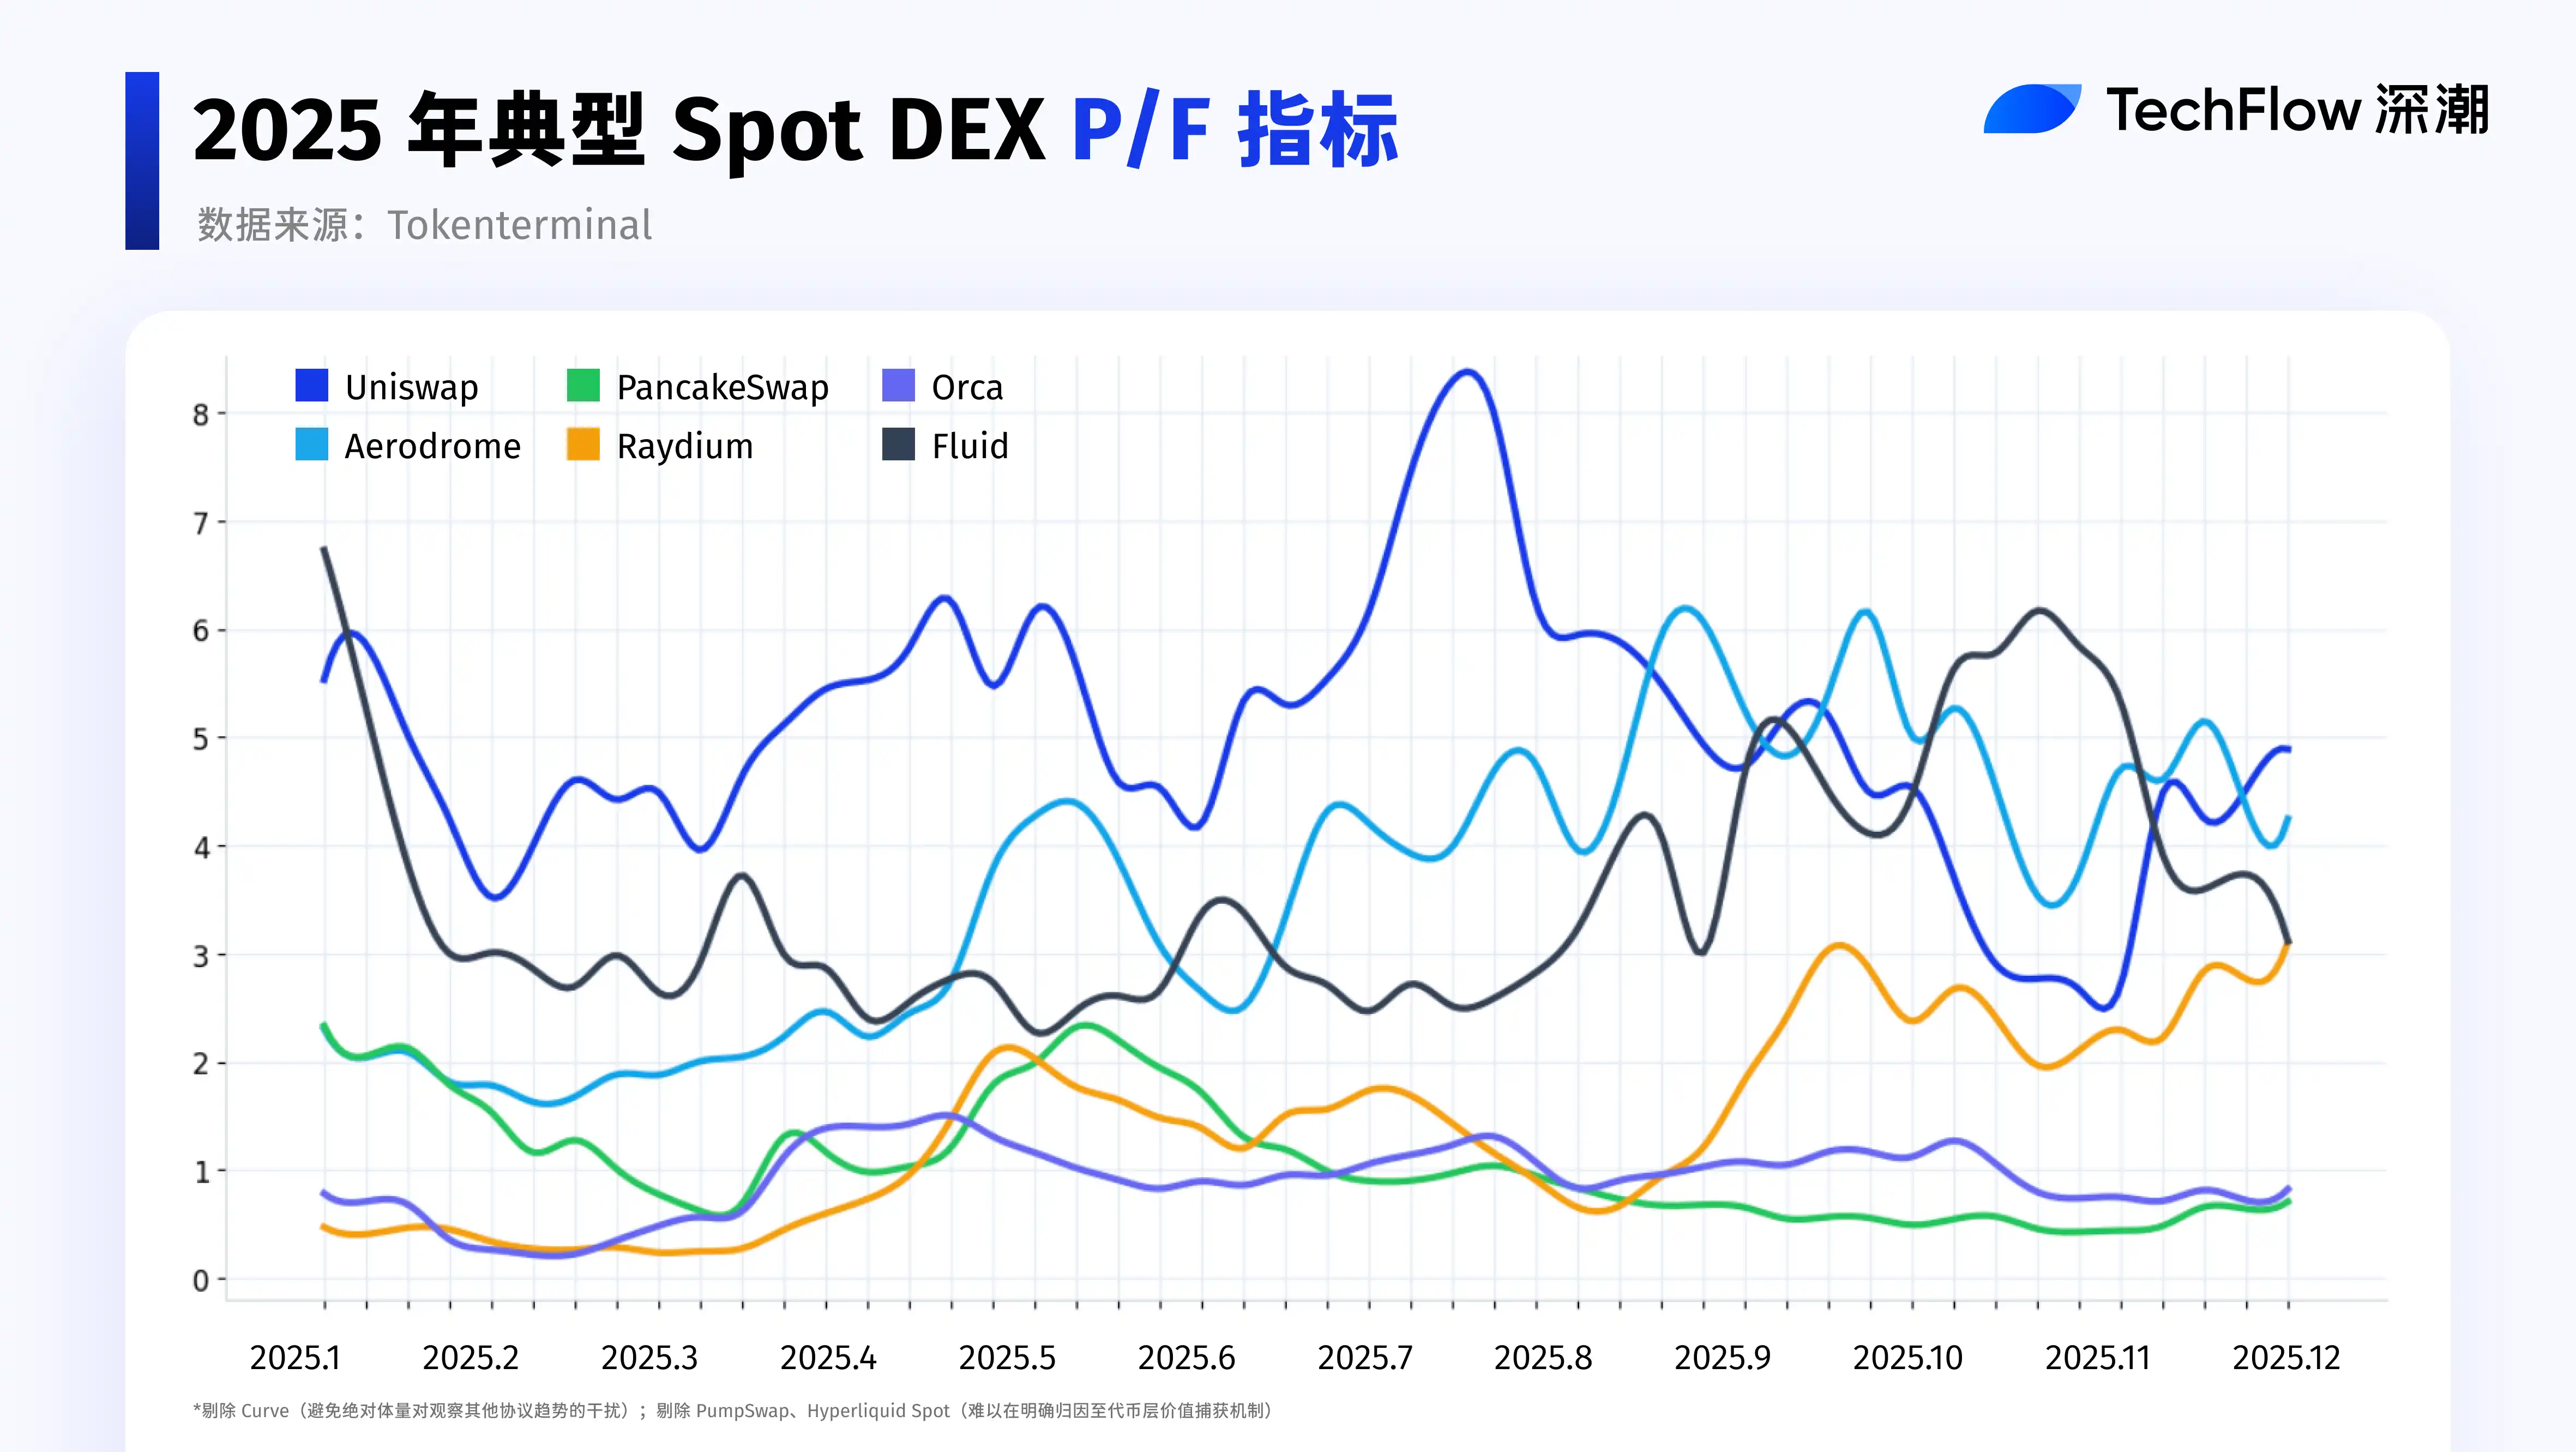
Data source: Tokenterminal
To avoid the interference of absolute size when observing trends of other protocols, Curve is temporarily not displayed in the current chart, used only for background analysis. Also, since PumpSwap and Hyperliquid Spot have difficulty in clearly attributing value capture mechanisms at the token level, they are also not included in this round.
Curve's P/F level remained in a relatively high range during the year, reaching a阶段性峰值 of about 28 in May, then持续回落 to around 7 since July. Compared to the level of about 10 at the beginning of the year, it整体略有下降.
It is important to emphasize that Curve's P/F is significantly higher than other protocols, mainly due to its long-maintained extremely low fee level. Curve's pricing mechanism itself is specifically designed for stablecoins and low-volatility assets (such as between stablecoins, stETH/ETH and other LST trades), achieving extremely low slippage and high capital efficiency through a highly optimized AMM design.
Furthermore, the new YieldBasis mechanism launched by Curve in 2025 further focuses on reducing LP's impermanent loss and protecting liquidity provider收益.
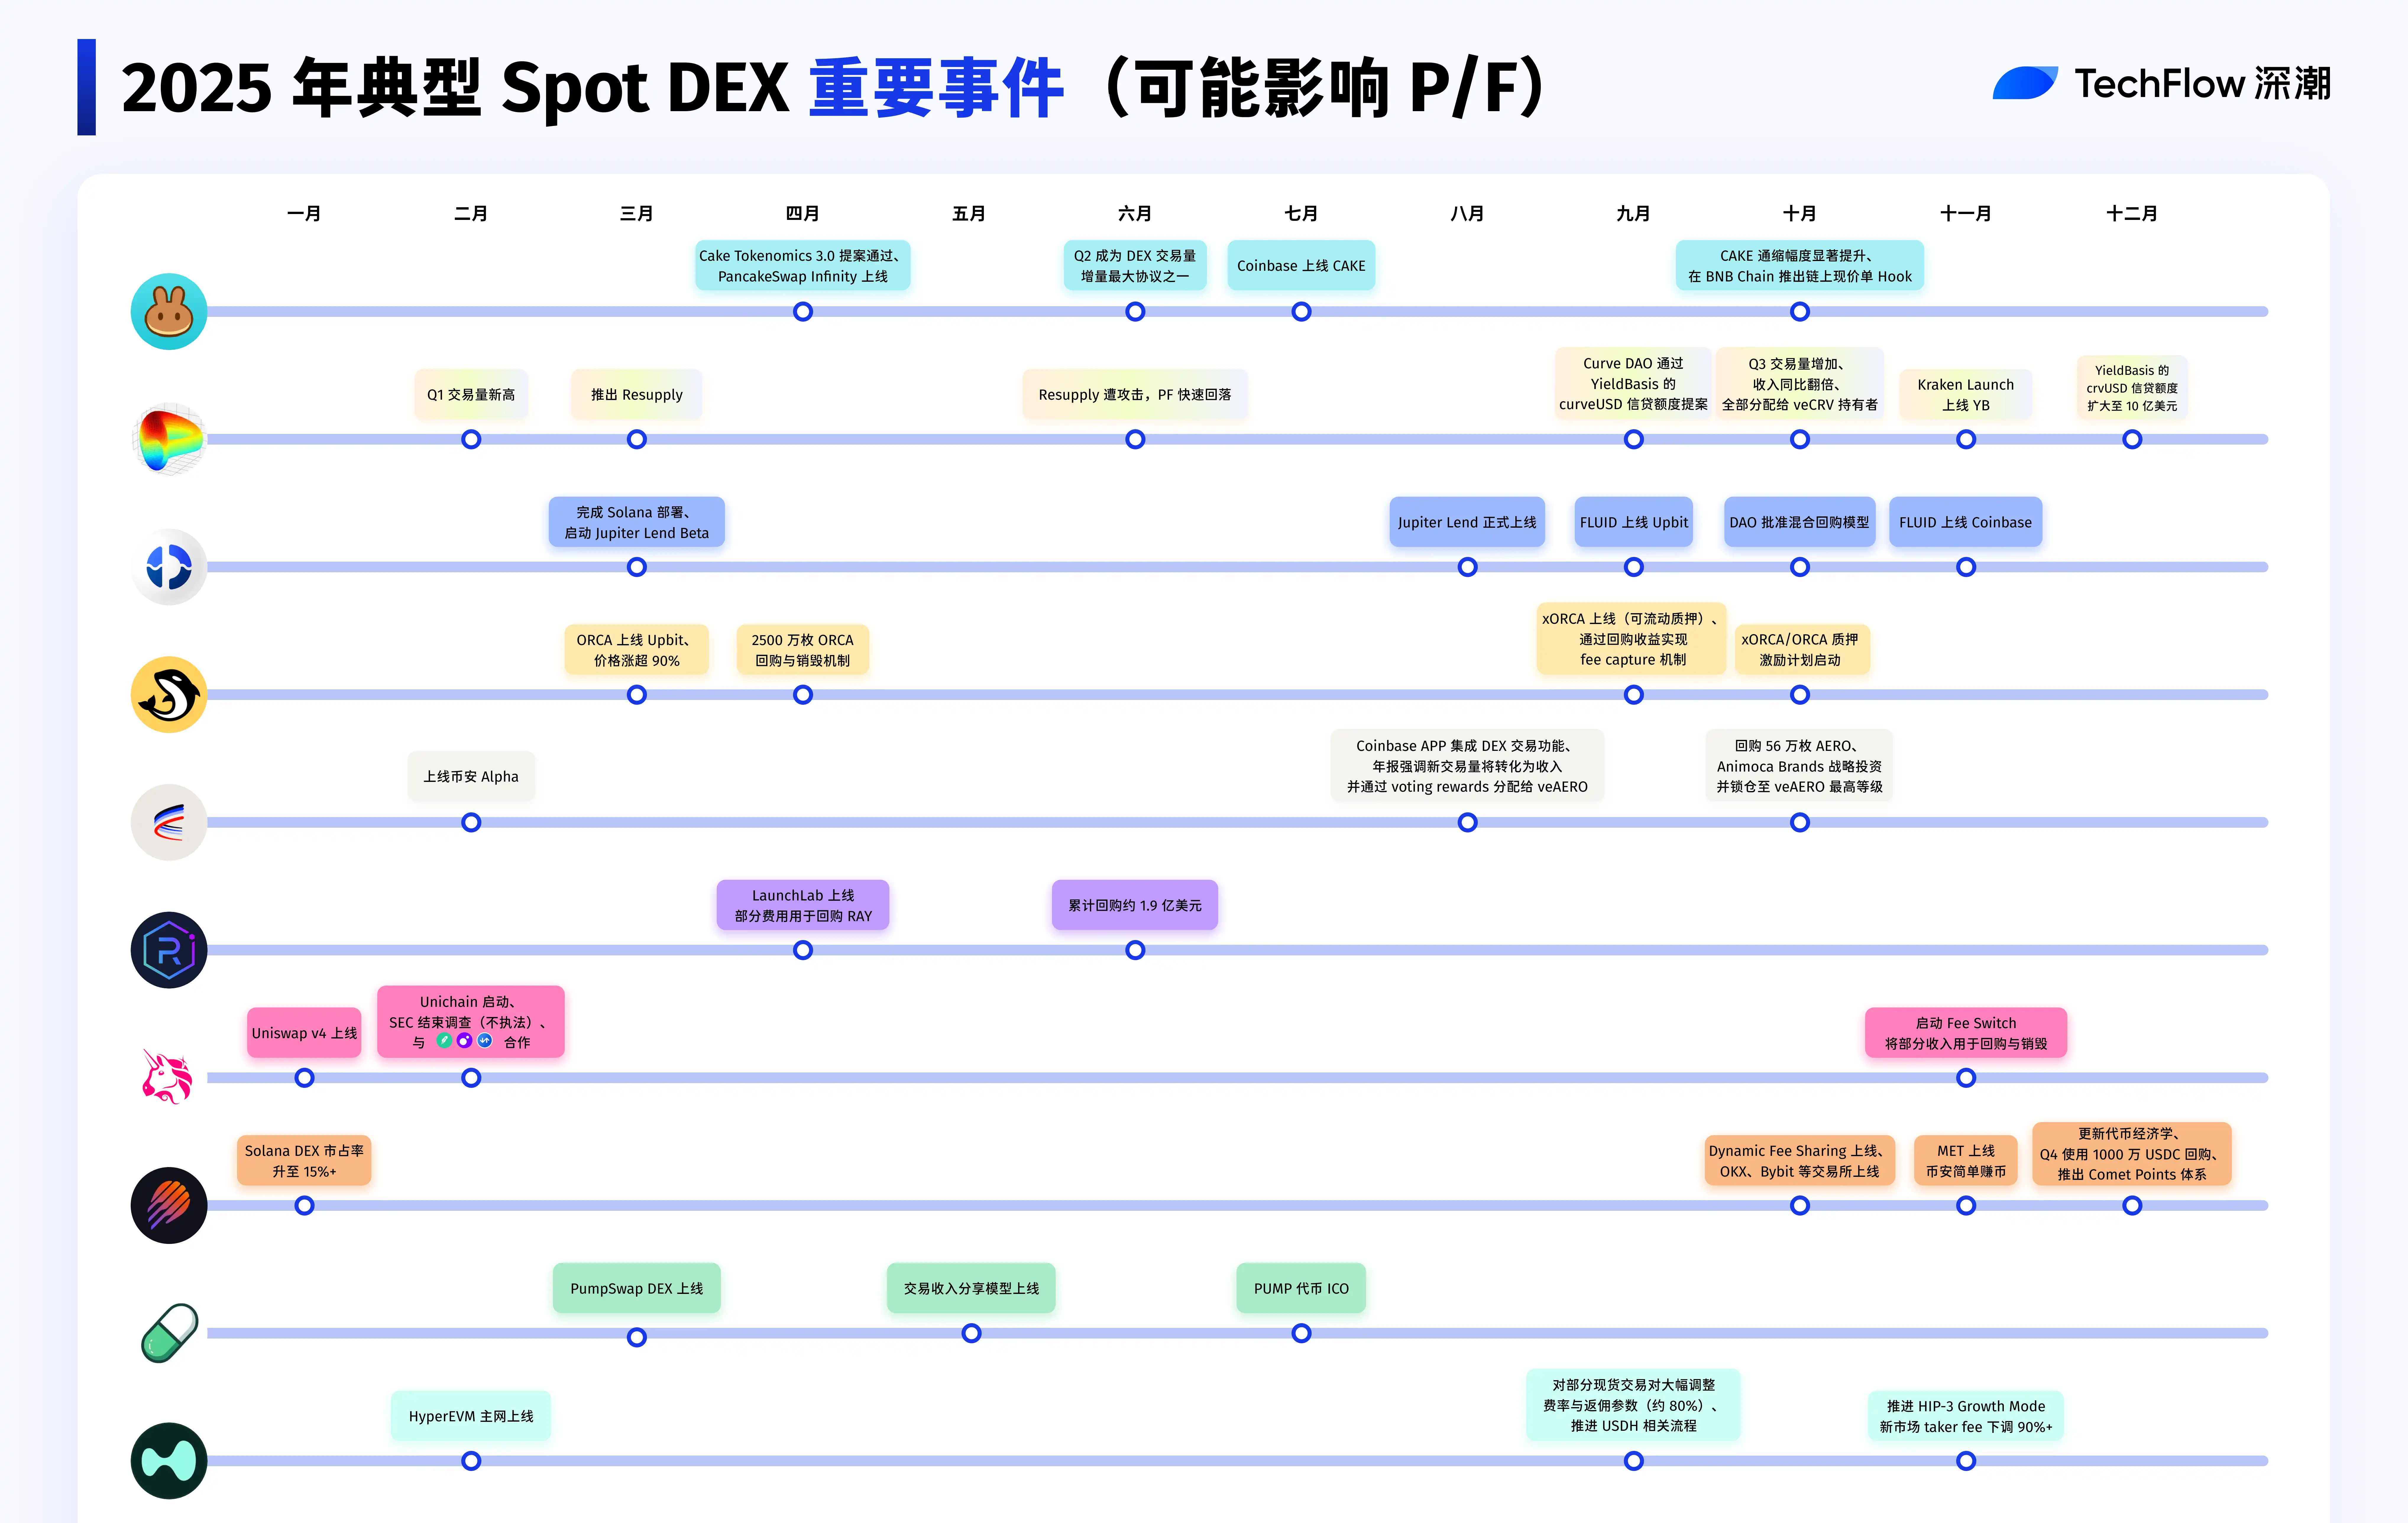
Regarding the changes in P/F for the protocols in the chart above in 2025, we have compiled important events that had some impact on the P/F changes of the top ten Spot DEXs, hoping to help you review this innovative and vibrant sector in 2025.
So, back to the initial question, is DEX really going to replace CEX?
Whether it's the leap in trading volume or the rise in the DEX/CEX ratio during the year, both point to one fact: DEX has become an undeniable main trading vehicle.
Especially in the perpetual contract领域, Perp DEX trading volume achieved historic amplification in 2025, and the capital turnover efficiency and capital承载能力 of leading platforms have brought the market into a new magnitude.
But this does not mean a simple replacement. 2025 is more like the starting point of a "two-way evolution": On one hand, DEXs are actively learning from CEXs, constantly converging in terms of matching efficiency, trading experience, risk control, and product completeness; on the other hand, CEXs are also evolving towards DEXs, placing more emphasis on asset self-custody, on-chain transparency, and verifiable settlement and清算机制.
Ultimately, the relationship between DEX and CEX may not be a zero-sum game. A more likely scenario is: Both发挥优势 at different levels and in different scenarios, jointly building the next generation of trading and清算基础设施 for crypto finance.
Not replacement, but并肩; not confrontation, but共建.
In 2025, this trend is already approaching. Is the day when the new order truly takes shape still far away?