Bitcoin Consolidates for Next Move, HYPE Restarts Bearish Trend | Guest Analysis

Odaily星球日报Опубликовано 2026-07-20Обновлено 2026-07-20

Введение

Bitcoin fluctuates around the key resistance zone of $65,700-$67,300 after rebounding from the $57,820 low. A break above this area could shift the short-term structure to a stronger bullish logic; otherwise, a daily-level correction may resume. The medium-term outlook remains bearish, with a 20% short position held. Short-term trading involves 30% capital for price differential opportunities, with prepared plans (A: shorting near resistance; B: testing long near $57,820 support) based on model signals. A previous short-term long trade yielded a 3.45% profit. HYPE continues its correction from the $72.97 high, with focus on the $62-$63.5 resistance area. The 4-hour chart analysis suggests the downtrend is not over, and new lows below $58.16 are likely. The strategy is to consider light short positions (under 30% allocation) if price rallies to the $62-$63.5 zone and shows reversal signals, with strict stop-loss discipline. General reminder: Always set initial stop-losses, move them to breakeven at +1% profit, and trail them to lock in gains. Market conditions change rapidly; this analysis is for personal trading log purposes only and not investment advice.

This week, Bitcoin continued its rebound above the low of $57,820, with the price approaching the critical resistance zone of $65,700~$67,300. The battle between bulls and bears has entered a white-hot stage—if the rebound is rejected and falls back within this zone, a daily-level correction may resume; if it breaks through effectively, the short-term structure will shift to a stronger bullish logic. HYPE extended its correction from the high of $72.97, with this week's focus on the battle outcome in the $62~$63.5 zone. The medium-term view remains bearish-dominated, while short-term operations should strictly follow model signals, dynamically switching between Plan A and B.

Summary of This Week's Core Trading Views:

  • BTC Multi-Timeframe Structure Analysis (Detailed in Part 1)
  • BTC Weekly Market Forecast & Medium/Short-term Trading Strategies (Detailed in Part 2)
  • HYPE Hourly Chart Structure Analysis (Detailed in Part 3)
  • HYPE Weekly Market Forecast & Short-term Trading Strategies (Detailed in Part 4)

Market Verification of Last Week's Trading Strategies & Core Views:

  • BTC Market Forecast Verification: Last week's article clearly stated that Bitcoin's daily chart entered a short-term consolidation pattern. The subsequent market movement confirmed our prediction.
  • BTC Short-term Trading Performance: One short-term long trade (1x leverage) on Bitcoin was completed last week, achieving a profit of approximately 3.45%. (Detailed in Part 5)
  • HYPE Market Forecast Verification: Last week's article clearly stated: If prices rebound early in the week but fail to break the previous high of $72.97, it would signal a reversal of the prior uptrend, indicating a daily-level correction starting from the high of $72.97. The current market movement is highly consistent with our judgment.

一、Bitcoin Multi-Timeframe Structure Analysis

1、Bitcoin Daily Chart Structure Analysis: (Based on post-May 6th price action)
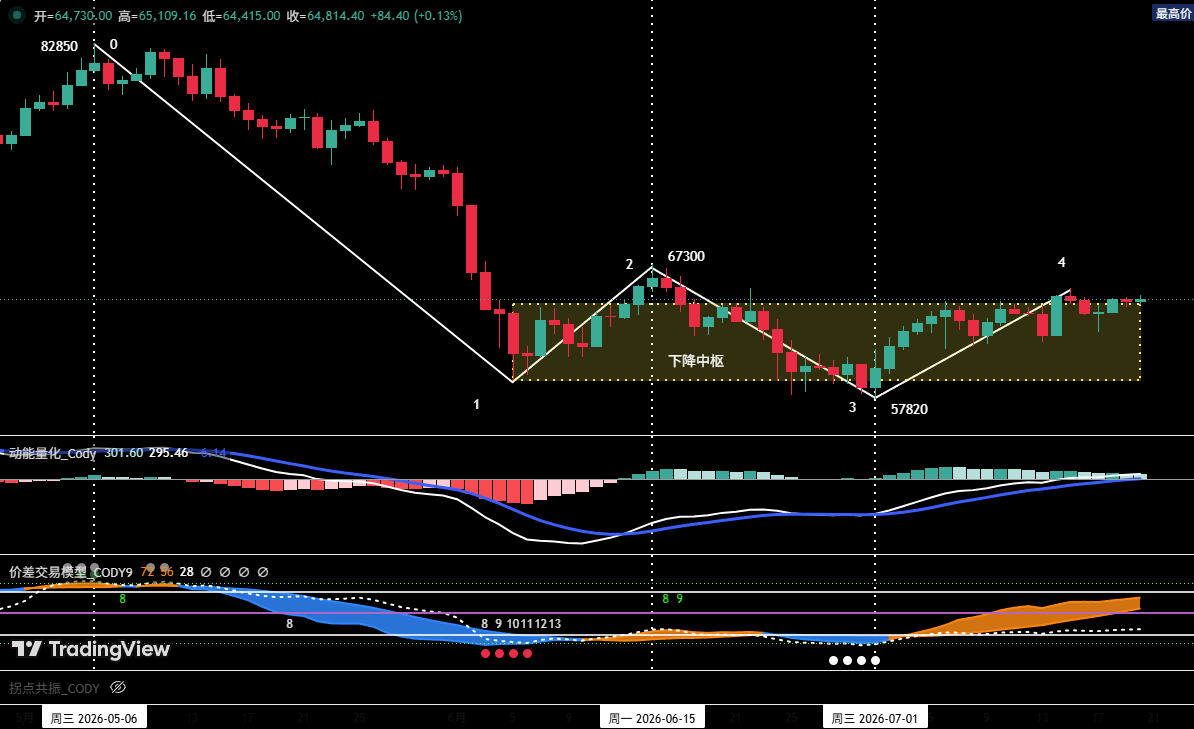
Figure 1 Bitcoin Daily Candlestick Chart

1 As shown in (Figure 1): The corrective move starting from the May 6th high of $82,850 has formed a four-segment corrective structure on the daily chart: (0-1), (1-2), (2-3), (3-4).

2 After touching the low of $57,820 on July 1st, the market is currently in the (3-4) rebound segment. The rebound high has reached $65,600, with the price approaching the key resistance around $65,700. Currently, this rebound segment may not be over, and the recent high of $65,600 is likely not the terminal point "Endpoint 4".

3 If the (3-4) rebound segment shows clear signs of exhaustion and adjustment upon encountering resistance in the $65,700~$67,300 zone, then the first daily-level segment (i.e., wave a) of the rebound starting from the July 1st low of $57,820 may have concluded.

2、In-Depth Analysis of Bitcoin Hourly Chart Structure: (Using 4-hour as analysis cycle)
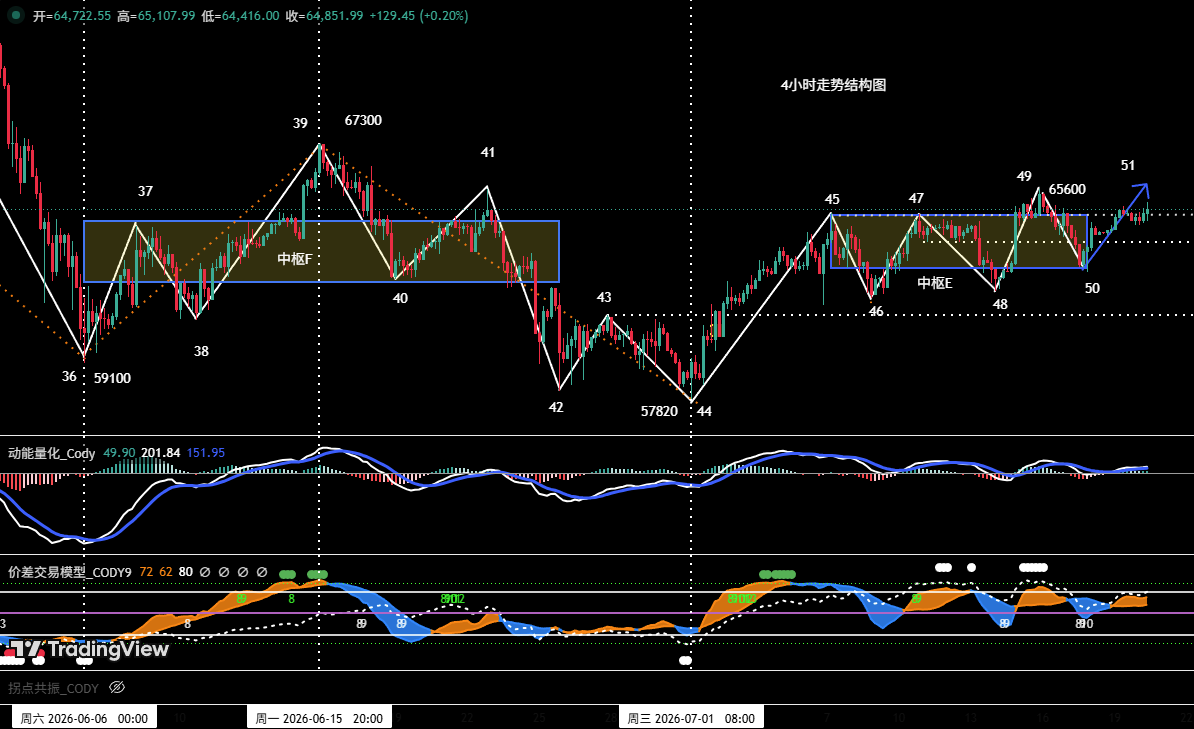
Figure 2 Bitcoin 4-Hour Candlestick Chart

1 In the 4-hour chart, the rebound from the July 1st low of $57,820 has clearly presented a seven-segment structure from (44-45) to (50-51). Among them: segments (45-46), (46-47), (47-48), (48-49), (49-50) overlap, forming a "five-segment" consolidation zone E.

2 Based on the current structure analysis, the price is currently in the (50-51) rebound segment.

  • If the price effectively breaks above the $65,700 resistance and the rebound continues, the probability of this segment upgrading into the breakout leg from the consolidation zone increases significantly. At that point, its momentum should be compared with the entry leg (44-45). If a momentum divergence forms between them when "Endpoint 51" terminates, the rebound starting from "Endpoint 44" (~$57,820) may end, with a high probability of a subsequent correction.
  • If the rebound fails to effectively break above the $65,700 resistance, the price is likely to remain in range-bound consolidation in the short term.

二、Bitcoin Weekly Market Forecast & Trading Strategies

1、BTC Weekly Market Forecast:

Core View for the Week: Focus on the test results when the price rebounds to the key resistance zone of $65,700~$67,300.

2、Core Resistance Levels:

  • First Resistance Zone: $65,700~$67,300 area (Previous significant resistance)
  • Second Resistance Zone: $69,500~$71,000 area (Previous significant resistance)

3、Core Support Levels:

  • First Support Level: Around $64,700 (Previous important support)
  • Second Support Zone: $60,950~$62,000 area (Previous important support)
  • Third Support Level: Around $57,820 (Previous important support)

4、Weekly Trading Strategies (Excluding sudden news impacts)

1 Medium-term Strategy:
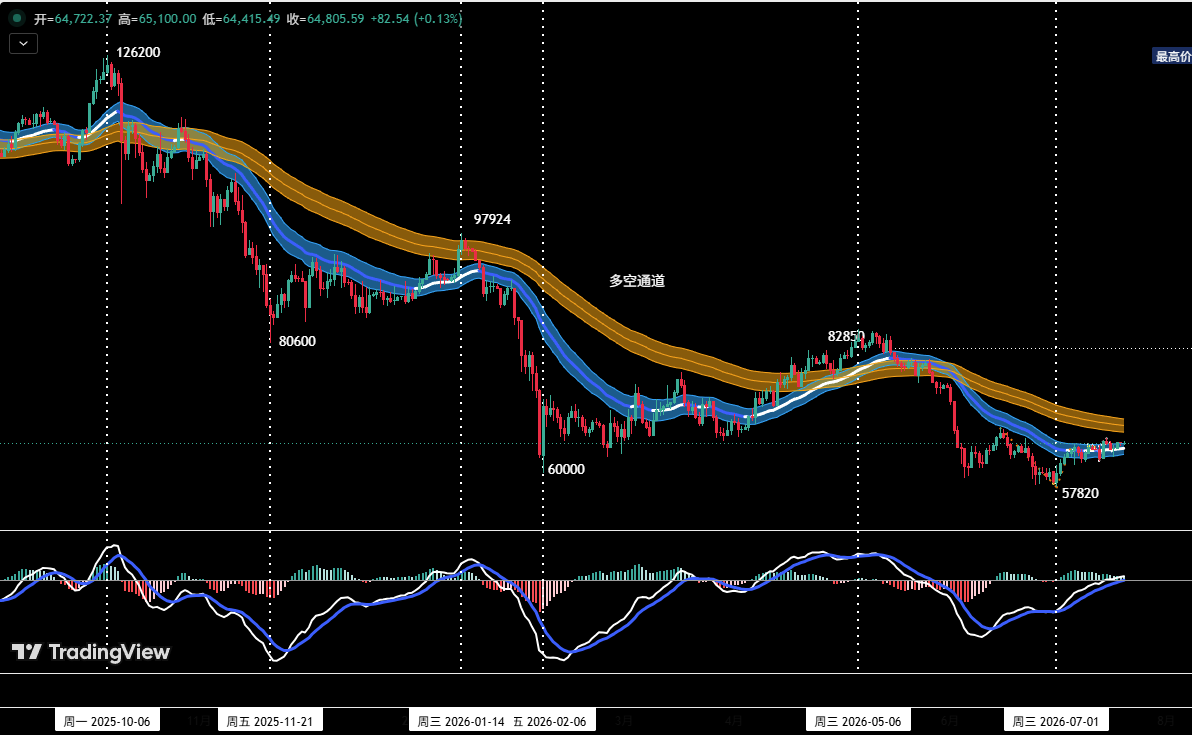
Figure 3 Bitcoin Daily Candlestick Chart: (Position Monitoring Model)

Position Monitoring Model: As shown in (Figure 3), the current price has effectively broken below the "Bull-Bear Channel," confirming a shift to a bearish-dominated market structure.

  • Current medium-term bearish positions are maintained at around 20%.
  • If the price shows signs of exhaustion upon rebounding to the $65,700~$67,300 zone, combined with top signals from the proprietary quantitative model, consider increasing medium-term bearish positions to within 50%.

2 Short-term Strategy:

Utilize 30% of capital, set stop-losses, and look for "spread" trading opportunities based on support and resistance levels. (Using 30-minute/60-minute as the operation cycle)

3 In short-term operations, to dynamically respond to complex market changes, we have prepared two specific contingency plans: A and B.

Plan A: Tentative Short at Strong Resistance Zone

  • Entry: If the price encounters resistance upon rebounding to the $65,700~$67,300 zone, combined with top signals from the quantitative model, consider establishing a short position of around 30%.
  • Risk Control: Set an initial stop-loss.
  • Exit: Gradually close the position to realize profits when the price adjusts near important support levels, combined with model signals.

Plan B: Light Long Test at Strong Support Zone

  • Entry: After the price is rejected from the $65,700~$67,300 zone and falls back, if signs of stabilization appear above the previous low of $57,820, combined with bottom signals from the quantitative model, consider establishing a long position of around 30%.
  • Risk Control: Set an initial stop-loss.
  • Exit: Gradually close the position to realize profits when the price rebounds near important resistance levels, combined with model signals.

三、HYPE Hourly Chart Structure Analysis
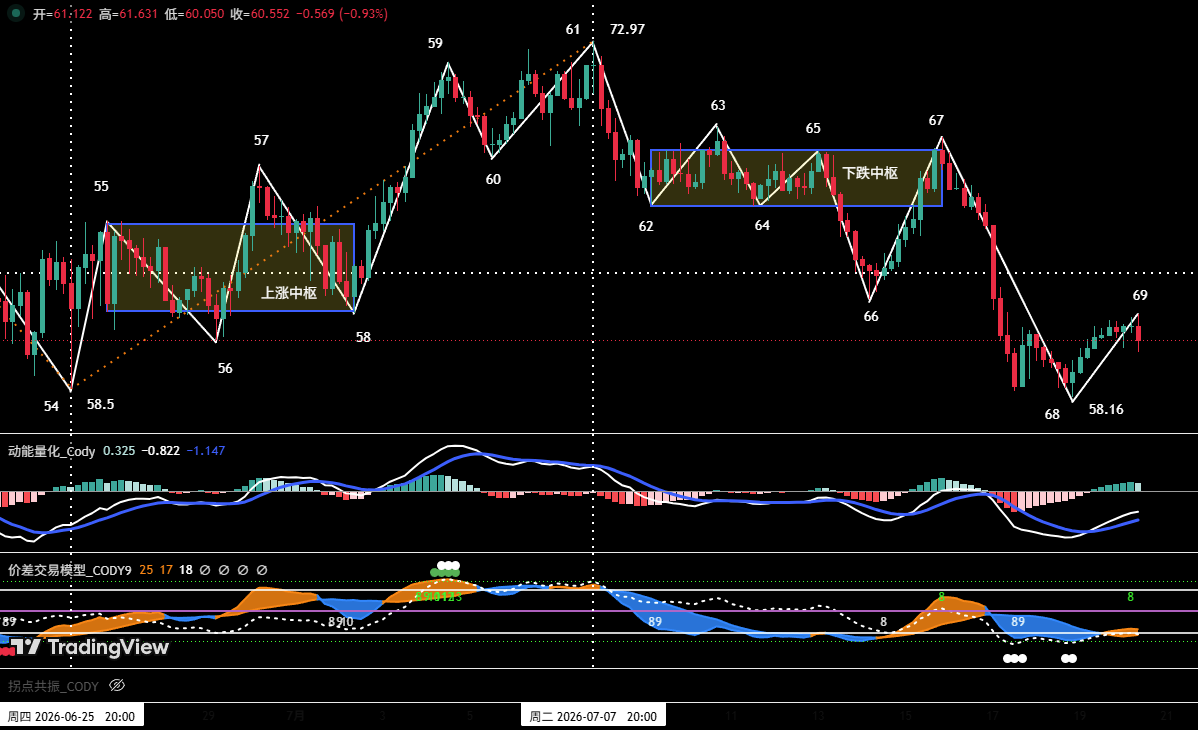
Figure 4 HYPE 4-Hour Candlestick Chart

1. As shown in (Figure 4), the correction in HYPE starting from the July 7th high of $72.97 (Endpoint 61) can be subdivided into an eight-segment corrective structure on the 4-hour chart. Segments 62-63, 63-64, 64-65, 65-66, 66-67 overlap, forming a "five-segment" bearish consolidation zone.

2. Last week's review pointed out: When the market subsequently ran the (62-63) rebound segment, if "Endpoint 63" failed to break the previous high "Endpoint 61" ($72.97), it would mean the end of the daily uptrend from "Endpoint 54 to Endpoint 61," and the market would start a daily-level correction from "Endpoint 61." The market corrected as expected last week, falling from "Endpoint 63 to Endpoint 68," with a maximum decline of approximately 16.17%.

3. Based on the 4-hour chart analysis:

Comparing the momentum of the breakout leg (67-68) with the entry leg (61-62), the downward momentum of the breakout leg is significantly stronger than the former. This suggests a lower probability that "Endpoint 68" ($58.16) is the low of this correction. The market is currently in the (68-69) rebound segment, after which prices may potentially test new lows.

四、HYPE Weekly Market Forecast & Short-term Trading Strategy: (07.20~07.26)

1、HYPE Weekly Market Forecast:

1 Core Resistance Levels:

  • First Resistance: $62~$63.5 area
  • Second Resistance: $68~$69.5 area
  • Third Resistance: Around $72.97

2 Core Support Levels:

  • First Support: Around $58.16
  • Second Support Zone: $52~$55 area

Core HYPE View for the Week: Monitor the test results when the price rebounds to the $62~$63.5 zone.

2、HYPE Weekly Short-term Trading Strategy:

If the price shows clear adjustment signals upon rebounding to near $62~$63.5 or higher resistance areas, investors may consider entering light short positions. Strict stop-loss discipline is required, with position size controlled within 30%.

五、Bitcoin Short-term Trade Review

We strictly followed the operation plan and the trading signals issued by our proprietary "Spread Trading Model" and "Momentum Quantitative Model," completing one short-term (long) trade last week, achieving a total trading profit of approximately 3.45%.

1、Short-term Trade Record: (See Table 1)

Bitcoin Short-term Trade Details Summary: (Leverage ×1)
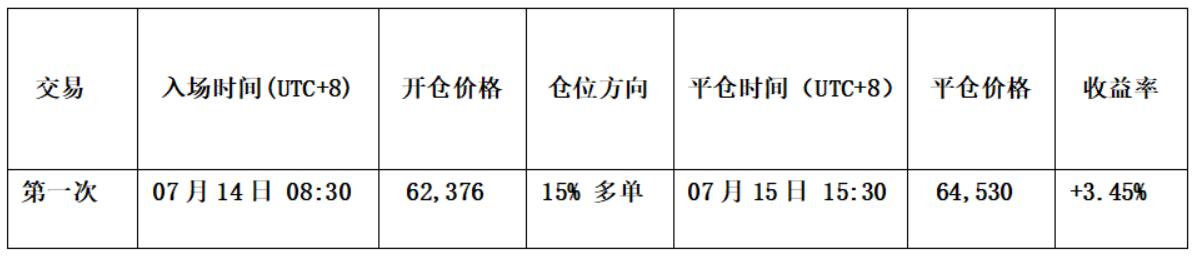
Table 1

2、Short-term Trade Review: (See Figure 5)

Entry Strategy:

a. When the price adjusted above $61,000, signs of stabilization appeared, and the candlesticks formed a "bottom reversal" pattern.

b. The "Momentum Quantitative Model" formed a bullish divergence signal.

c. After the "Spread Trading Model" triggered a strong bottom warning signal (white dot + red dot), the signal band (orange-yellow) in the chart broke above the horizon line (purple-red), issuing a bottoming rebound signal.

Therefore, we established a 15% long position at $62,376.

Exit Strategy:

a. When the price showed signs of exhaustion upon rebounding near $65,700, forming a "top reversal" candlestick pattern.

b. After the "Spread Trading Model" continuously triggered top warning signals (white dot + green dot), the signal band (blue) in the chart broke below the skyline (green), forming a top resonance signal with the "Momentum Quantitative Model."

Therefore, we closed the entire position around $64,530.

Summary: This trade successfully yielded a profit of approximately 3.45%.

3、Short-term Trade Schematic
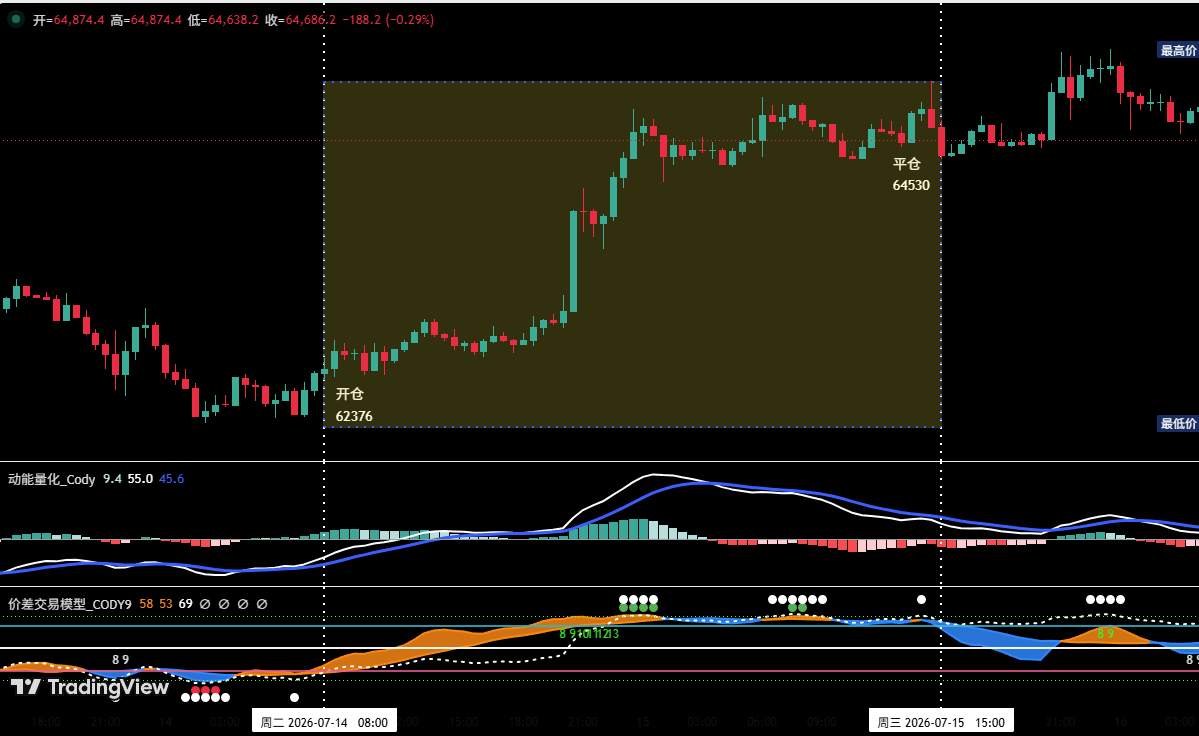
Figure 5 BTC 30-Minute Candlestick Chart: (Momentum Quantitative Model + Spread Trading Model)

六、Special Instructions:

  1. Upon Entry: Immediately set an initial stop-loss.
  2. When Profit Reaches 1%: Move the stop-loss to the entry price (breakeven point) to ensure capital safety.
  3. When Profit Reaches 2%: Move the stop-loss to the 1% profit level.
  4. Continuous Tracking: Thereafter, for every additional 1% profit, move the stop-loss up by 1% accordingly, dynamically protecting and locking in profits.

Financial markets are ever-changing. All market analysis and trading strategies require dynamic adjustment. All views, analytical models, and operational strategies mentioned in this article are derived from personal technical analysis and are solely for personal trading log purposes. They do not constitute any investment advice or basis for operation. The market carries risks; invest with caution. Do not make decisions based solely on this content.


Трендовые криптовалюты

Связанные с этим вопросы

QAccording to the technical analysis, what is the key resistance zone for Bitcoin (BTC) this week, and what are the two potential market outcomes based on a test of this zone?

AThe key resistance zone for Bitcoin this week is $65,700–$67,300. If the price faces resistance and falls back in this area, a daily-level adjustment may resume. Conversely, if it breaks through this resistance effectively, the short-term structure will shift to a stronger bullish logic.

QWhat is the core trading strategy for HYPE this week as outlined in the article?

AThe core strategy for HYPE is to monitor the test result when the price rebounds to the $62–$63.5 area. If the price shows a clear reversal signal near this resistance zone (or a higher one), investors can consider opening a light short position with strict stop-loss discipline, keeping the position size within 30%.

QDescribe the two specific operational plans (Plan A and Plan B) prepared for Bitcoin's short-term trading.

APlan A (Tentative Short at Strong Resistance): If BTC price meets resistance in the $65,700–$67,300 zone and shows topping signals from the quantitative model, open a short position of about 30% with an initial stop-loss. Close the position for profit near important support levels combined with model signals. Plan B (Light Long at Strong Support): If the price falls back after testing the $65,700–$67,300 resistance and shows signs of stabilization above the previous low of $57,820, combined with quantitative model bottom signals, open a long position of about 30% with an initial stop-loss. Close the position for profit near important resistance levels combined with model signals.

QWhat was the profit percentage and main rationale for the Bitcoin short-term long trade conducted last week, as detailed in the trade review?

ALast week's Bitcoin short-term long trade achieved a profit of approximately 3.45%. The main rationale for opening the long position at $62,376 was: price stabilization above $61,000 forming a 'bottoming' candlestick pattern, a kinetic energy bottom divergence signal from the 'Dynamic Quantitative Model', and a strong bottom warning signal (white + red dots) from the 'Spread Trading Model' where the signal band broke above the baseline, indicating a potential rebound.

QWhat is the overall medium-term market structure view for Bitcoin based on the 'Position Monitoring Model' shown in Figure 3?

AAccording to the Position Monitoring Model (Figure 3), Bitcoin's price has effectively broken below the 'Bull-Bear Channel', confirming that the market structure has shifted to a bear-dominated pattern. Therefore, the medium-term view maintains a bearish-dominant mindset. A medium-term short position of about 20% is currently held, with consideration to increase it to within 50% if the price rebounds to the $65,700–$67,300 zone and shows signs of stagnation combined with proprietary quantitative model top signals.

Похожее

Глубокий анализ FWA: Интересный эксперимент по превращению NFT в «ончейн-гачапон»

**FWA (Fake World Assets): увлекательный эксперимент по превращению NFT в «онлайн-гэча»** FWA — это новая платформа на базе Ethereum, которая функционирует как полностью онлайн-автомат по продаже «гэча» (слепых коробок). Проект позволяет владельцам NFT участвовать в качестве «поставщиков ликвидности», а пользователям — случайно получать эти активы. **Как это работает?** * **Поставщик (Depositor):** блокирует свой NFT вместе с депозитом в ETH («Backing»), создавая позицию. Этот депозит определяет вероятность выпадения его NFT (меньше депозит = выше шанс) и служит гарантией выкупа. * **Покупатель/Игрок (Purchaser):** платит единую для всех цену, рассчитанную системой (среднее гармоническое всех депозитов + сбор), и гарантированно получает случайную позицию. При выигрыше можно либо забрать NFT, либо продать его обратно поставщику, получив 85% от его депозита (в ETH или в токенах $FWA). **Ключевые особенности:** * **Динамическое распределение:** часть сборов от покупок распределяется между поставщиками, стимулируя ликвидность. * **Система обратного веса:** низкие депозиты делают пул доступным, высокие создают редкие «джеко-поты». * **Токен $FWA:** используется для стимулирования и формирует постоянный спрос, поскольку часть депозитов при продаже NFT конвертируется в покупку $FWA на рынке. **Суть проекта:** FWA предлагает новый способ монетизации и торговли NFT, объединяя механизмы ликвидности, азарт слепых коробок и игровую экономику для двух типов участников.

marsbit6 мин. назад

Глубокий анализ FWA: Интересный эксперимент по превращению NFT в «ончейн-гачапон»

marsbit6 мин. назад

Подразделение Samsung изучает инфраструктуру стейблкоинов с оператором Upbit

Компания Samsung SDS, IT-подразделение Samsung Group, изучает возможность создания инфраструктуры для стейблкоинов, систем цифровых активов и платежных моделей на основе ИИ совместно с Dunamu, оператором одной из крупнейших южнокорейских криптобирж Upbit. Это сотрудничество может помочь Samsung SDS укрепить свои позиции на рынке инфраструктуры цифровых активов. Ранее Samsung Electronics анонсировала планы по добавлению поддержки стейблкоинов в Samsung Wallet. Также в мае 2026 года Samsung Securities, SDS и Samsung Card договорились о совместной покупке 4% доли в Dunamu, что углубляет вовлеченность аффилированных компаний Samsung в цифровой сектор Южной Кореи. Инициатива в области цифровых активов развивается на фоне расширения деятельности Samsung SDS в сфере ИИ и облачных сервисов, которые способствовали росту выручки во втором квартале. Компания планирует значительно нарастить мощности своей ИИ-инфраструктуры к 2031 году, совмещая это направление с развитием услуг в области цифровых финансов.

cointelegraph9 мин. назад

Подразделение Samsung изучает инфраструктуру стейблкоинов с оператором Upbit

cointelegraph9 мин. назад

10 тысяч ученых получают год бесплатного доступа: OpenAI переносит научный конвейер в ChatGPT

OpenAI запустила программу «ChatGPT для академических исследователей», предлагая 100 000 ученым бесплатный годовой доступ к своим передовым моделям, включая флагманскую GPT-5.6 Sol Pro. Цель — интегрировать весь научно-исследовательский рабочий процесс — от изучения литературы и генерации гипотез до написания кода, анализа данных и составления рукописей — в единую среду ChatGPT, дополненную инструментами вроде Codex и ChatGPT Work, а также специализированными навыками для наук о жизни и подключением к базам данных. Программа уже пользуется спросом: еженедельно около 1,3 миллиона человек используют ChatGPT для сложных научных и математических задач. OpenAI видит в этом возможность сформировать у исследователей привычку работать в своей экосистеме, повышая будущие затраты на переход после окончания бесплатного периода. Однако у предложения есть ограничения: доступ предоставляется только на использование моделей (без API и без раскрытия весов), предназначен для преподавателей и постдоков из утвержденных учреждений и имеет лимиты использования, аналогичные ChatGPT Pro. Эта стратегия отличается от подхода Anthropic, который предлагает ученым кредиты на API, но также не раскрывает веса моделей. Таким образом, OpenAI укрепляет свои позиции, предоставляя не просто инструмент, а целую рабочую среду, оставаясь при этом закрытой в отношении фундаментальных технологий.

marsbit12 мин. назад

10 тысяч ученых получают год бесплатного доступа: OpenAI переносит научный конвейер в ChatGPT

marsbit12 мин. назад

После вывода 4,4 млрд акционером на рекордные 20 млрд: Что за маневр у Gigadevice?

За месяц акции ведущей китайской компании по производству микросхем памяти GigaDevice (兆易创新) упали с исторического максимума в 846 юаней до около 350 юаней, потеряв в стоимости более 330 млрд юаней. Причиной резкого падения стал выход на IPO аффилированной компании Changxin Technologies, что разрушило логику инвестиций в GigaDevice как в "акцию-тень". Одновременно аналитики Morgan Stanley предупредили о возможном пике цикла роста рынка памяти. Ранее, в период с мая по июнь, крупнейший акционер и председатель правления Чжу Имин продал акций на сумму около 4,4 млрд юаней по цене от 339 до 538 юаней за акцию. После обвала котировок 29 июля он объявил о планах выкупить акций на сумму не менее 1 млрд юаней и предложил компании провести обратный выкуп акций на сумму до 2 млрд юаней, а также пообещал не продавать свои акции в течение года. Хотя операции по продаже были проведены в соответствии с правилами, такая последовательность действий — масштабная продажа на пике с последующими планами выкупа после обвала — подорвала доверие рынка. Полугодовой отчет компании показал впечатляющий рост выручки на 177% и чистой прибыли на 1099%, однако около трети прибыли носит разовый характер. Компания признает высокие циклические риски в своем секторе. Эксперты отмечают долгосрочный потенциал GigaDevice на волне импортозамещения в Китае, однако инвесторам следует четко разделять инвестиции в фундаментальный бизнес компании и риски, связанные с действиями инсайдеров.

marsbit12 мин. назад

После вывода 4,4 млрд акционером на рекордные 20 млрд: Что за маневр у Gigadevice?

marsbit12 мин. назад

Хедж-фонд с акциями майнеров Bitcoin на $1,1 млрд ищет капитал после распродажи на фоне ИИ: FT

Хедж-фонд Situational Awareness, основанный бывшим исследователем OpenAI Леопольдом Ашенбреннером, обратился к инвесторам и кредиторам за дополнительным капиталом после крупных убытков, вызванных недавним обвалом на рынке акций искусственного интеллекта. По данным Financial Times, фонд, который по состоянию на начало июня управлял активами на $20 млрд, также предложил некоторым инвесторам возможность выкупа активов из своего портфеля. Несмотря на прибыль в 439% после комиссий к июню, агрессивное использование заемных средств привело к росту убытков во время июльского рыночного краха. В своем письме инвесторам Ашенбреннер, однако, заявил, что распродажа создала привлекательные инвестиционные возможности. Значительную часть портфеля фонда составляют ставки на сектор энергоснабжения и дата-центров для ИИ, включая майнеров биткоина, которые переориентируются на вычисления для искусственного интеллекта. В мартовской отчетности SEC были указаны позиции на сумму около $1,11 млрд в акциях семи майнинговых компаний, таких как IREN, Core Scientific, Riot Platforms и CleanSpark. Ашенбреннер, ранее публиковавший эссе о перспективах искусственного общего интеллекта, запустил свой фонд в 2024 году.

cointelegraph23 мин. назад

Хедж-фонд с акциями майнеров Bitcoin на $1,1 млрд ищет капитал после распродажи на фоне ИИ: FT

cointelegraph23 мин. назад

Торговля

Спот

Популярные статьи

Как купить HYPE

Добро пожаловать на HTX.com! Мы сделали приобретение Hyperliquid (HYPE) простым и удобным. Следуйте нашему пошаговому руководству и отправляйтесь в свое крипто-путешествие.Шаг 1: Создайте аккаунт на HTXИспользуйте свой адрес электронной почты или номер телефона, чтобы зарегистрироваться и бесплатно создать аккаунт на HTX. Пройдите удобную регистрацию и откройте для себя весь функционал.Создать аккаунтШаг 2: Перейдите в Купить криптовалюту и выберите свой способ оплатыКредитная/Дебетовая Карта: Используйте свою карту Visa или Mastercard для мгновенной покупки Hyperliquid (HYPE).Баланс: Используйте средства с баланса вашего аккаунта HTX для простой торговли.Третьи Лица: Мы добавили популярные способы оплаты, такие как Google Pay и Apple Pay, для повышения удобства.P2P: Торгуйте напрямую с другими пользователями на HTX.Внебиржевая Торговля (OTC): Мы предлагаем индивидуальные услуги и конкурентоспособные обменные курсы для трейдеров.Шаг 3: Хранение Hyperliquid (HYPE)После приобретения вами Hyperliquid (HYPE) храните их в своем аккаунте на HTX. В качестве альтернативы вы можете отправить их куда-либо с помощью перевода в блокчейне или использовать для торговли с другими криптовалютами.Шаг 4: Торговля Hyperliquid (HYPE)С легкостью торгуйте Hyperliquid (HYPE) на спотовом рынке HTX. Просто зайдите в свой аккаунт, выберите торговую пару, совершайте сделки и следите за ними в режиме реального времени. Мы предлагаем удобный интерфейс как для начинающих, так и для опытных трейдеров.

680 просмотров всегоОпубликовано 2024.12.11Обновлено 2026.06.02

Как купить HYPE

Обсуждения

Добро пожаловать в Сообщество HTX. Здесь вы сможете быть в курсе последних новостей о развитии платформы и получить доступ к профессиональной аналитической информации о рынке. Мнения пользователей о цене на HYPE (HYPE) представлены ниже.

活动图片