Bitcoin Volatility Unchanged Amid Dominant Downtrend; HYPE Faces Repeated Tests at Critical Trendline | Guest Analysis

Odaily星球日报Dipublikasikan tanggal 2026-07-13Terakhir diperbarui pada 2026-07-13

Abstrak

This weekly market analysis updates the outlook for Bitcoin (BTC) and HYPE based on recent price action, largely confirming prior predictions. **Bitcoin (BTC) Analysis:** The report maintains that BTC is in a downtrend but currently within a corrective rebound phase that began from the July 1st low of $57,820. This rebound has reached a key resistance near $64,700. The daily chart shows a developing "descending central zone," suggesting a shift into a consolidation/range-bound phase. The 4-hour chart indicates the rebound may be completing, with proprietary models showing potential short-term topping signals near the current levels. **BTC Trading Strategy (July 13-19):** * **Key Levels:** Resistance is at $64,700, $65,700-$67,300, and $69,500-$71,000. Support lies at $60,950-$62,000, $57,820, and $55,000. * **Mid-term:** The overall structure is bearish. Hold ~20% short positions. Consider increasing shorts to 50% if price rallies to the $65,700-$67,300 zone and shows weakness. * **Short-term:** Use 30% capital for tactical trades. Three scenarios are outlined: 1. **A (Buying Dip):** Consider buying if price drops to $60,950-$62,000 support and shows signs of stabilization. 2. **B (Selling Rally):** Consider shorting if price rallies to the $65,700-$67,300 resistance zone with confirming signals. 3. **C (Buying Higher Low):** Consider buying if, after a breakout above $65,700, a pullback finds support above $57,820. **HYPE Analysis:** HYPE performed as...

In last week's report, based on Bitcoin's daily chart structure, we clearly stated the core judgment that "the oversold rebound phase has begun, and the rebound height will determine the subsequent market direction". We also issued a warning for HYPE, indicating a "significantly high probability of adjustment near the Endpoint 61 (72.97 USD)". This week's market trajectory further validated the effectiveness of our analytical framework: Bitcoin completed the multi-stage rebound as expected and touched a key resistance level, while HYPE met resistance and fell back around 72.97 USD as anticipated, with a maximum drop of 9.39%.

Building upon this, this week's report will provide a detailed breakdown of the potential price paths and specific trading strategies for BTC and HYPE, combining the latest 4-hour and daily chart structures with signals from our proprietary quantitative models.

Summary of This Week's Core Trading Views:

• BTC Multi-timeframe Structure Analysis (Details in Part 1)

• BTC Price Forecast and Mid/Short-term Trading Strategies This Week (Details in Part 2)

• HYPE Hourly Structure Analysis (Details in Part 3)

• HYPE Price Forecast and Short-term Trading Strategies This Week (Details in Part 4)

Market Validation of Last Week's Trading Strategies and Core Views:

• Validation of BTC Forecast: Last week's article clearly stated that Bitcoin had entered a daily-level oversold rebound phase, emphasizing that the height of this rebound would determine the market's subsequent direction. The current market trajectory is developing in line with our prediction.

• Validation of HYPE Forecast: Last week's article indicated a significant probability of HYPE undergoing adjustment near "Endpoint 61" (72.97 USD). Currently, market movements are highly consistent with our judgment.

Part 1: Bitcoin's Structure Analysis from Last Week

1. Bitcoin Daily Chart Structure Analysis: (Based on price action post-May 6th)

Bitcoin Daily Candlestick Chart
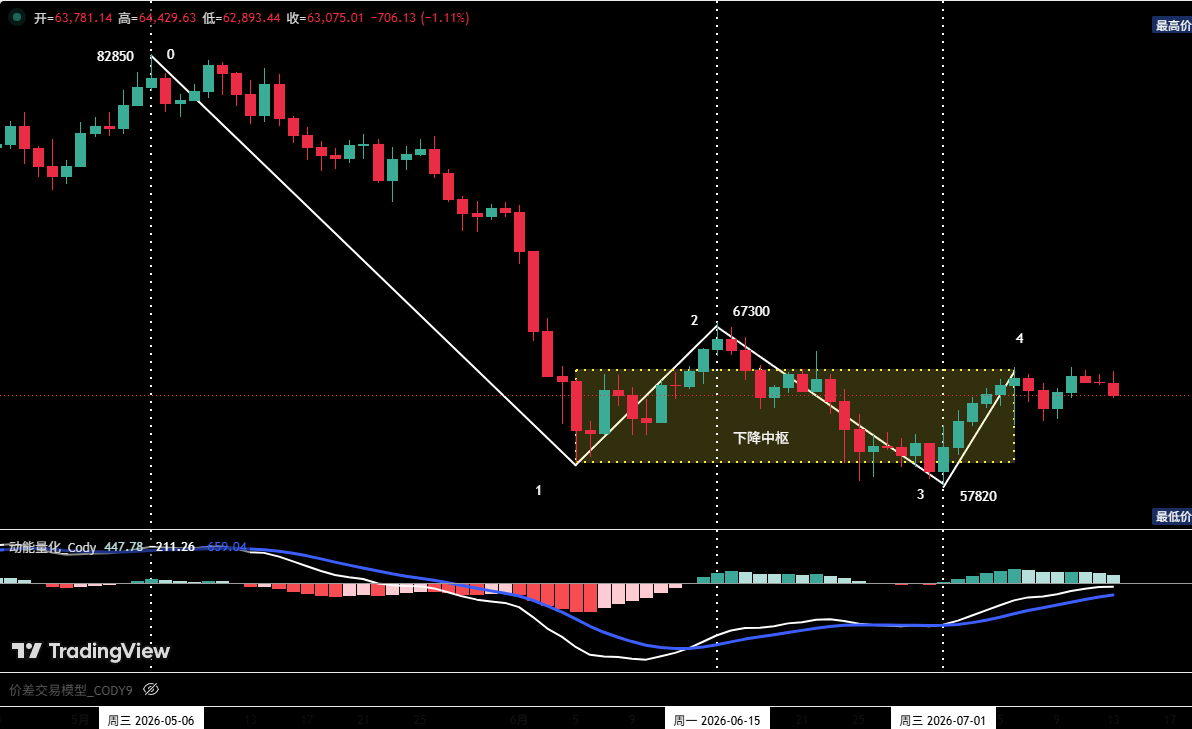
Figure 1

1. As shown in (Figure 1): The corrective move initiated from the May 6th high of $82,850 has presented a four-segment adjustment structure on the daily chart: segments (0-1), (1-2), (2-3), and (3-4).

2. Since touching the low of $57,820 on July 1st, the market is currently developing the rebound segment (3-4), and the price has already broken through the $64,500 resistance level. Last week's commentary explicitly stated: If this rebound first breaks the $64,500 resistance, and then (preferably) breaks the $65,700 resistance, the probability significantly increases for a subsequent stabilization and rebound above the low of $57,820 once the (3-4) rebound segment concludes and corrects.

3. On the daily timeframe, the price overlap across segments (1-2), (2-3), and (3-4) has preliminarily formed a "descending consolidation zone" (as shown in the chart). Based on the above analysis, the market is highly likely to enter a "zone extension" phase next, meaning this "zone" will be composed of five or even more overlapping segments. This signals a short-term market entry into a volatile, range-bound consolidation pattern.

2. In-depth Bitcoin Hourly Structure Analysis: (Using 4-hour as the analysis cycle)

Bitcoin_4-hour Candlestick Chart
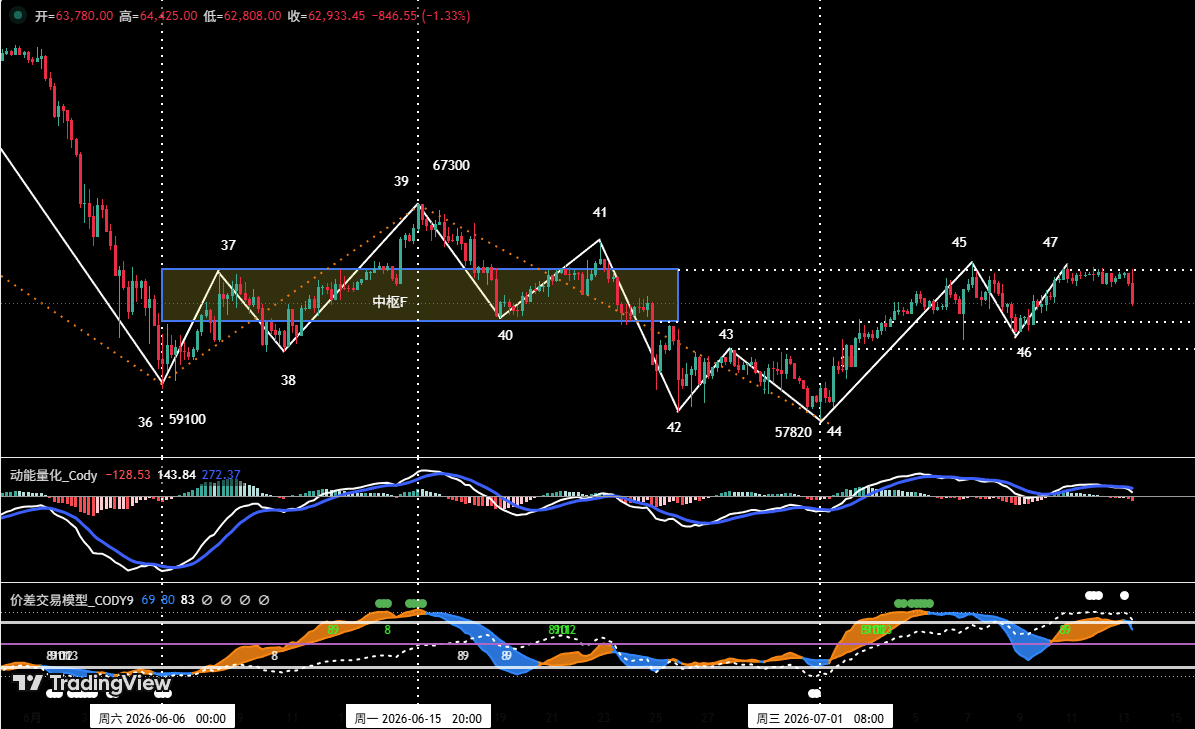
Figure 2

1. On the 4-hour chart, the rebound starting from the July 1st low of $57,820 clearly shows a three-segment structure: (44-45), (45-46), and (46-47).

2. Based on the current structure analysis, the price is in the midst of developing the (46-47) rebound segment. As the local high "Endpoint 47" was being formed, our proprietary "Momentum Quantitative Model" showed a clear bearish divergence signal, and the "Price Difference Trading Model" touched a top warning signal (white dot). Therefore, the probability of a technical correction at the hourly level here is extremely high. If the price corrects as expected, watch for support effectiveness near "Endpoint 46". If signs of stabilization appear around this level, a subsequent rebound will likely occur, with the primary upside target initially being $65,700; if rebound momentum is strong, the next important target is $67,300.

Part 2: Bitcoin Price Forecast and Trading Strategies for This Week (07.13~07.19)

1. BTC Price Forecast for This Week:

This Week's Core View: Focus closely on the price's performance around the key resistance level of $64,700. If a correction occurs as expected, closely observe the effectiveness of support when it falls back near $61,500. Stabilization signals at this level will determine whether the subsequent rebound can continue.

2. Core Resistance Levels:

• First Resistance Zone: $64,700 area (upper bound of previous consolidation zone)

• Second Resistance Zone: $65,700~$67,300 area (previous significant resistance area)

• Third Resistance Zone: $69,500~$71,000 area (previous significant resistance area)

3. Core Support Levels:

• First Support Zone: $60,950~$62,000 area (previous important support area)

• Second Support Level: Near $57,820 (previous important support level)

• Third Support Level: Near $55,000 (previous important support level)

4. Trading Strategies for This Week (Excluding the Impact of Sudden News):

1. Mid-term Strategy: Bitcoin_Daily Candlestick Chart: (Position Monitoring Model)
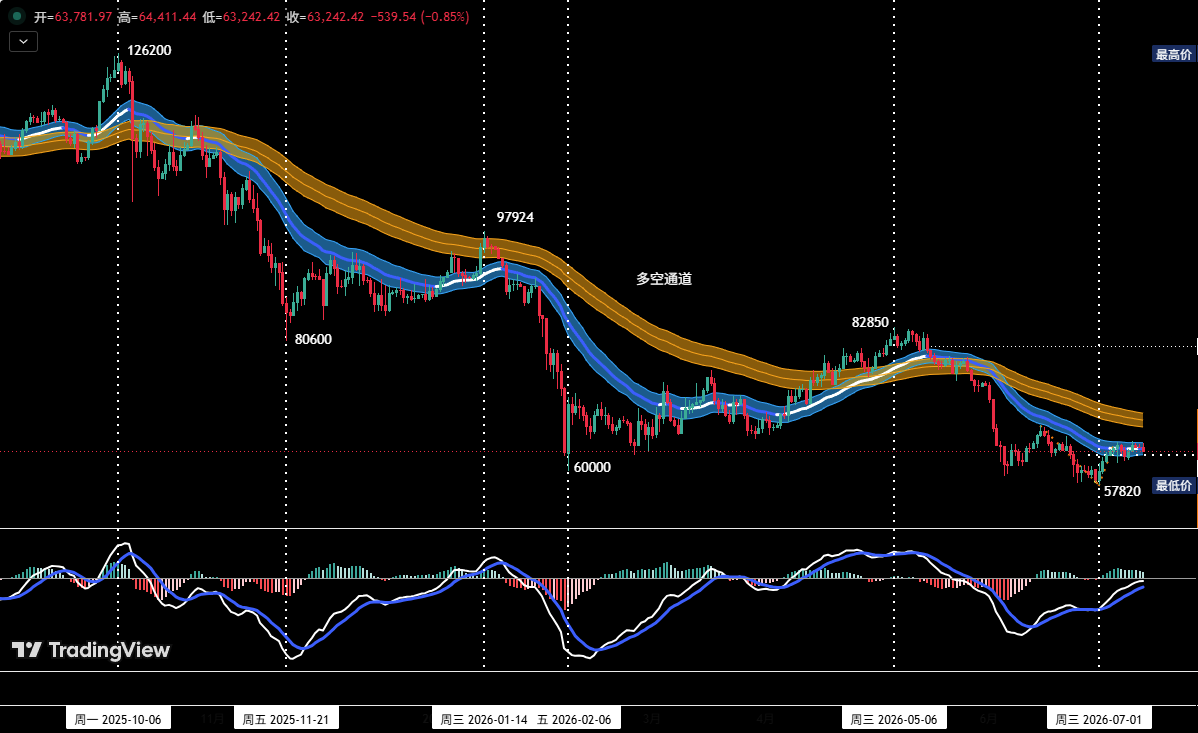
Figure 3

Position Monitoring Model: As shown in (Figure 3), the current price has effectively broken below the "Bull-Bear Channel", confirming a shift to a bear-dominated market structure.

• Current mid-term short positions should be maintained at around 20% for now.

• If the price rebounds to the $65,700~$67,300 area and shows signs of stagnation, combined with top signals from our proprietary quantitative models, consider increasing mid-term short positions to within 50%.

2. Short-term Strategy: Use 30% of capital, set stop-loss points, and look for "price difference" opportunities based on support and resistance levels. (Use 30-minute/60-minute charts as the operation cycle).

3. For short-term operations, to dynamically respond to the market's complex evolution, we have pre-determined three specific contingency plans: A/B/C.

• Plan A: Tentatively go long if support in the $60,950~$62,000 area holds. • Entry: If the price corrects from near $64,700 and, upon falling to the $60,950~$62,000 area, shows signs of stabilization combined with bottom signals from quantitative models, aggressive investors can establish a long position of about 15%. • Risk Control: Set an initial stop-loss. • Exit: Gradually close the position for profit when the price reaches important resistance levels combined with model signals.

• Plan B: Tentatively go short near strong resistance zones. • Entry: If the price rebounds and meets resistance in the $65,700~$67,300 area, combined with top signals from quantitative models, establish a short position of about 30%. • Risk Control: Set an initial stop-loss. • Exit: Gradually close the position for profit when the price adjusts to important support levels combined with model signals.

• Plan C: Lightly test long near strong support zones. • Entry: After the price breaks above $65,700 and then corrects, if signs of stabilization appear above the previous low of $57,820, combined with bottom signals from quantitative models, establish a long position of about 30%. • Risk Control: Set an initial stop-loss. • Exit: Gradually close the position for profit when the price rebounds to important resistance levels combined with model signals.

Part 3: HYPE Hourly Structure Analysis

HYPE_4-hour Candlestick Chart
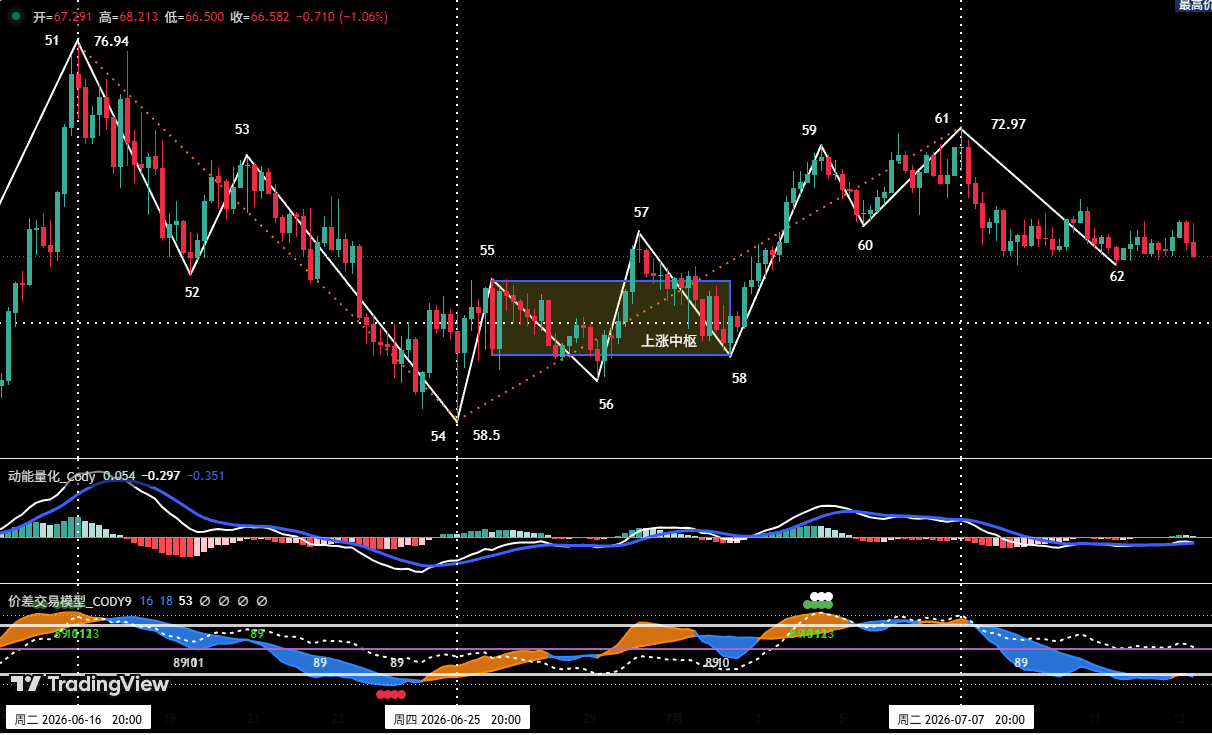
Figure 4

1. As shown in (Figure 4), from the June 25th low of $58.5 (Endpoint 54) to the July 7th high of $72.97 (Endpoint 61), HYPE's move on the 4-hour cycle can be subdivided into a seven-segment upward structure. Among them, segments 55-56, 56-57, and 57-58 overlap to form an "ascending consolidation zone".

2. Last week's commentary pointed out: Since a complete seven-segment upward structure has run from "Endpoint 54 to Endpoint 61", and top warning signals were triggered at "Endpoint 59" and "Endpoint 61" respectively, be alert to short-term adjustment risks. Last week, the market met resistance and began adjusting around $72.97 as expected. During the development of the (61-62) correction segment, the maximum decline was approximately 9.39%.

3. Based on the 4-hour chart analysis, the price is currently developing the (61-62) correction segment. The current "Endpoint 62" has already broken below the previous low "Endpoint 60" ($68.16), which preliminarily damages the structure that has been rising since "Endpoint 54".

Part 4: HYPE Price Forecast and Short-term Trading Strategies This Week

1. HYPE Price Forecast for This Week:

1. Core Resistance Levels:

• First Resistance Level: $68~$69.5 area

• Second Resistance Level: Near $72.97

• Third Resistance Level: Near $76.94

2. Core Support Levels:

• First Support Level: Near $65.5

• Second Support Zone: $60.5~$61.5 area

This Week's Core View on HYPE: Focus on where the current correction "Endpoint 62" concludes, and whether the subsequent rebound height can break through the $72.97 resistance.

2. HYPE Short-term Trading Strategies for This Week: This Week's Short-term Operations: Strategy One: If, after the (61-62) correction segment ends, the price rebounds and breaks the $72.97 resistance—since it would be approaching the strong resistance area of the historical high at $76.94—it is recommended to remain观望 (unallocated/cash).

Strategy Two: Conversely, if after the (61-62) correction segment ends, the price rebound fails to reach $72.97, it is recommended to establish short positions on rallies. Operationally, strict stop-losses must be set, with position size controlled within 30%.

Part 5: Special Reminders:

  1. Upon Entry: Immediately set an initial stop-loss.
  2. When Profit Reaches 1%: Move the stop-loss to the entry cost (breakeven point) to ensure capital safety.
  3. When Profit Reaches 2%: Move the stop-loss to the 1% profit level.
  4. Continuous Tracking: Thereafter, for every additional 1% profit, move the stop-loss up by 1%, dynamically protecting and locking in profits.

Financial markets change rapidly, and all market analysis and trading strategies require dynamic adjustment. All views, analytical models, and operational strategies involved in this article are derived from personal technical analysis, intended solely for personal trading log purposes, and do not constitute any investment advice or operational basis. The market carries risks, investing requires caution. Please do not make decisions based on this content.


Kripto yang Sedang Tren

Pertanyaan Terkait

QAccording to the article, what is the key price level (in USD) where Bitcoin's rebound met resistance and triggered a technical adjustment?

AThe key resistance level where Bitcoin's rebound met resistance was around 64,700 USD. At this point, the self-built 'momentum quantitative model' showed a clear top divergence signal and the 'price difference trading model' triggered a top warning signal, indicating a high probability of a technical adjustment.

QWhat are the three core operational plans (A, B, C) for Bitcoin's short-term trading strategy outlined in the article?

AThe three short-term Bitcoin trading plans are: Plan A: Test buying (go long) if price finds support in the 60,950-62,000 USD zone. Plan B: Test selling (go short) if price encounters resistance in the 65,700-67,300 USD zone. Plan C: Lightly test buying (go long) if price retreats but finds support above the previous low of 57,820 USD after breaking above 65,700 USD.

QFor HYPE, what was the specific price point (referred to as 'endpoint 61') where it encountered resistance and began a correction last week?

AFor HYPE, the specific price point where it encountered resistance and began a correction was at 72.97 USD, which is referred to as 'endpoint 61' in the analysis.

QWhat is the article's overall medium-term (mid-line) stance on Bitcoin's market structure based on the 'Position Monitoring Model'?

AThe article's medium-term stance on Bitcoin, based on the 'Position Monitoring Model', is bearish. The model shows that the price has effectively broken below the 'Bull-Bear Channel', confirming a market structure shift to one dominated by a downtrend. It recommends maintaining a medium-term short position of around 20%.

QWhat is the critical condition for considering to establish a short position in HYPE according to the weekly strategy?

AThe critical condition for considering a short position in HYPE is if, after the (61-62) correction segment ends, the price rebounds but fails to reach the 72.97 USD resistance level. In this scenario, the strategy suggests establishing a short position on rallies, with strict stop-loss and position control within 30%.

Bacaan Terkait

Setelah Tiga Kuartal Berturut-Turut Turun, Bisakah Pasar Kripto Menyambut Jendela Stabilitas di Kuartal Ketiga?

Pasar kripto mengalami kuartal terburuk sejak 2022, dengan kapitalisasi pasar turun 12.6% menjadi $2.1 triliun, didorong oleh keluarnya modal dan penurunan volume perdagangan. Bitcoin dan Ethereum masing-masing jatuh 14.2% dan 25.4% di kuartal kedua. Aliran keluar bersih dari ETF Bitcoin AS mencapai $4.67 miliar, menandakan tekanan jual yang berkelanjutan. Faktor utama meliputi terputusnya hubungan dengan saham AS, kebijakan moneter Federal Reserve yang ketat, dan pelepasan aset oleh perusahaan seperti Strategy. Proses legislasi UU CLARITY yang akan memberikan kejelasan regulasi terhambat, meningkatkan premi risiko di sektor ini. Namun, ada tanda-tanda potensi stabilisasi. Aliran keluar ETF yang besar secara historis sering terjadi di akhir fase penurunan, dan para pemegang Bitcoin jangka panjang mulai menambah kepemilikan lagi. Sementara sebagian besar sektor menyusut, pasar prediksi dan aset koleksi yang ditokenisasi mencatat pertumbuhan signifikan. Pandangan untuk kuartal ketiga sangat bergantung pada pertemuan Fed akhir Juli. Sinyal kebijakan yang lunak dapat mendukung pemulihan Bitcoin, sementara sikap yang hawkish dapat memicu konsolidasi lebih lanjut. Meskipun tantangan regulasi tetap ada, indikator teknis seperti harga Bitcoin yang mendekati rata-rata bergerak 200-mingguannya menunjukkan dasar jangka panjang belum rusak. Logika pasar telah bergeser dari mengandalkan narasi ke faktor fundamental seperti kebijakan dan ekspektasi suku bunga.

marsbit20j yang lalu

Setelah Tiga Kuartal Berturut-Turut Turun, Bisakah Pasar Kripto Menyambut Jendela Stabilitas di Kuartal Ketiga?

marsbit20j yang lalu

The SpaceX Trade, Terbuka: SPCXON Mulai Diperdagangkan di WEEX

SpaceX meluncurkan IPO terbesar dalam sejarah pada Juni 2026, namun akses bagi banyak pedagang terhambat oleh batasan regional dan prosedur broker. WEEX kini menghadirkan SPCXON/USDT di pasar spotnya, sebuah instrumen tokenisasi yang memungkinkan paparan terhadap pergerakan harga SpaceX melalui akun kripto yang diselesaikan dengan USDT, tanpa memerlukan broker AS atau pembiayaan bank. SPCXON adalah produk tokenisasi yang mencerminkan ekonomi kepemilikan SpaceX bagi pedagang yang memenuhi syarat di luar AS, dengan dividen diinvestasikan kembali. Aset ini diperdagangkan di WEEX sebagai pasangan spot dengan USDT, tersedia selama jam pasar, memberikan akses mudah bagi trader kripto. Kasus investasi untuk SpaceX didasarkan pada pertumbuhan pendapatan Starlink dan pencapaian Starship, meskipun valuasinya yang tinggi (sekitar 90-110 kali pendapatan) telah memperhitungkan eksekusi sempurna selama bertahun-tahun. Faktor seperti jumlah saham publik yang terbatas dan masa buka kunci (unlock) insider pertama menjadi pertimbangan penting. Penting untuk diingat bahwa SPCXON memberikan paparan, bukan kepemilikan langsung atas saham atau hak suara. Harganya dapat diperdagangkan pada premium atau diskon terhadap nilai aset bersih. WEEX menawarkan akses ke berbagai aset TradFi yang ditokenisasi seperti ini dalam satu akun terpadu, bersama dengan pasar futures dan kampanye perdagangan dengan pool hadiah.

TheNewsCrypto20j yang lalu

The SpaceX Trade, Terbuka: SPCXON Mulai Diperdagangkan di WEEX

TheNewsCrypto20j yang lalu

Momen Perdagangan BIT: BTC Masih Tertekan oleh EMA 200 Mingguan, Setelah Ditolak Mungkin Kembali Turun, Saham Penyimpanan dan Semikonduktor yang Melonjak Malam Kemudian Mulai Anjlok di Pasar Malam

**PASAR KRIPTO & SAHAM: BTC Hadapi Resistensi, Saham Semikonduktor Turun di Perdagangan Malam** Pasar kripto melanjutkan pemulihan, dengan harga Bitcoin bertahan di sekitar $66,000 setelah rebound lebih dari 15% dari titik terendah Juli. Namun, BTC menghadapi **tembok resistensi kuat di dekat $68,000**, yang bertepatan dengan biaya rata-rata investor selama lima bulan terakhir dan titik gagalnya rebound pertengahan Juni. Secara teknis, perhatian tertuju pada **200 EMA mingguan (~$68,328) sebagai level kunci**. Jika BTC ditolak di level ini, potensi penurunan menuju support $63,000 terbuka. Analis menyoroti volume rendah dan penurunan open interest futures di CME, menandakan rebound ini lebih dipicu likuiditas rendah musim panas daripada awal bull run penuh. Di pasar saham AS, **indeks futures utama turang** setelah sesi kemarin yang kuat. Sektor semikonduktor dan penyimpanan (storage), yang melonjak pada hari Selasa (contoh: Micron +12%), **mengalami koreksi di perdagangan malam (night trading)**. ETF semikonduktor turun 2,22% dan saham Micron turun 2,29%. Meski begitu, ada sorotan positif seperti **Super Micro Computer (SMCI)** yang naik lebih dari 15% setelah melaporkan pandangan pendapatan yang kuat dan pesanan baru yang sangat besar, mengonfirmasi permintaan server AI tetap solid. Kekhawatiran makro muncul dari **kenaikan harga minyak mentah (di atas $91)** akibat ketegangan geopolitik dan **lonjakan imbal hasil (yield) obligasi pemerintah AS**, dengan imbal hasil 10-tahun mencapai sekitar 4,64%. Faktor-faktor ini dapat menambah tekanan inflasi dan membatasi ruang gerak pasar saham. Saham terkait kripto seperti Coinbase dan Robinhood naik kuat didorong oleh perkembangan regulasi yang lebih jelas di AS. Di Asia, **Korea Selatan** dan **Jepang** menunjukkan kinerja beragam. Indeks KOSPI Korea naik didukung pemulihan saham semikonduktor, sementara pasar Jepang melemah dengan **Yen terus melemah ke level terendah sejak 1986**, meningkatkan kekhawatiran akan intervensi bank sentral. **Yang Perlu Diperhatikan Selanjutnya:** * **22 Juli:** Acara AI AMD, rilis laporan keuangan dari Google (Alphabet), Tesla, IBM. * **23 Juli:** Keputusan suku bunga Bank Sentral Eropa (ECB), data klaim pengangguran AS, laporan keuangan Intel. * Perkembangan lebih lanjut dari **harga minyak, imbal hasil obligasi, dan dinamika Yen Jepang** akan menjadi penentu sentimen pasar risiko secara keseluruhan.

marsbit20j yang lalu

Momen Perdagangan BIT: BTC Masih Tertekan oleh EMA 200 Mingguan, Setelah Ditolak Mungkin Kembali Turun, Saham Penyimpanan dan Semikonduktor yang Melonjak Malam Kemudian Mulai Anjlok di Pasar Malam

marsbit20j yang lalu

Mantan Ketua CFTC dan Presiden Circle, Tarbert: Satu Pihak Menasihati Anda untuk Berpikir Jangka Panjang, di Sisi Lain Menguangkan $30 Juta Sendiri

Penulis: Zen, PANews Heath Tarbert, mantan Ketua CFTC dan Presiden Circle, baru-baru ini menyerukan kepada investor untuk mengadopsi pandangan jangka panjang terhadap saham Circle, meskipun harganya telah turun 70% dari puncaknya. Namun, ia sendiri secara konsisten menjual saham CRCL sejak perusahaan go public, menguangkan sekitar $30 juta tanpa pernah membeli saham tambahan di pasar terbuka. Tarbert, yang bergabung dengan Circle pada Juli 2023 dan menjadi Presiden pada awal 2025, dikenal sebagai pendukung kuat narasi "jangka panjang" perusahaan. Namun, sehari sebelum IPO Circle, ia menetapkan rencana perdagangan 10b5-1 untuk menjual hingga 353.290 saham dalam setahun. Dalam 13 bulan setelah IPO, ia menjual lebih dari 360.000 saham, termasuk penjualan tunggal senilai $11,5 juta pada Maret 2026. Ia bahkan menetapkan rencana 10b5-1 kedua untuk menjual hingga 160.000 saham lagi pada akhir tahun 2026. Langkah Tarbert ini menuai kecaman karena dianggap tidak konsisten dengan pesan "jangka panjang" yang ia sampaikan kepada publik. Perjalanan kariernya sering dikaitkan dengan "revolving door" antara regulator dan dunia keuangan. Setelah mengundurkan diri sebagai Ketua CFTC pada Maret 2021, ia bergabung dengan Citadel Securities hanya 27 hari kemudian sebagai Kepala Penasihat Hukum, tepat saat perusahaan itu menghadapi pengawasan ketat terkait peristiwa GameStop. Di Citadel, ia juga mendukung undang-undang yang memperluas wewenang CFTC atas pasar crypto, sementara Citadel diketahui berencana berekspansi ke aset kripto. Tarbert kemudian pindah ke Circle pada 2023, membantu perusahaan mengatasi tantangan regulasi dan akhirnya go public melalui IPO langsung. Meskipun sangat berharga bagi perusahaan, tindakannya menjual saham dalam jumlah besar sambil mendorong investor untuk bertahan menimbulkan pertanyaan tentang komitmennya yang sebenarnya terhadap masa depan jangka panjang Circle.

marsbit21j yang lalu

Mantan Ketua CFTC dan Presiden Circle, Tarbert: Satu Pihak Menasihati Anda untuk Berpikir Jangka Panjang, di Sisi Lain Menguangkan $30 Juta Sendiri

marsbit21j yang lalu

Gate Research Institute: Produk Keuangan Kripto Menggulirkan Gelombang "Wall Street-ization", Kompetisi atau Integrasi?

**Ringkasan: Gelombang "Wall Street-ization" Produk Keuangan Kripto: Kompetisi atau Integrasi?** Artikel ini membahas fenomena konvergensi antara keuangan tradisional (TradFi) dan keuangan kripto (Crypto). Meskipun Bitcoin awalnya dirancang sebagai sistem peer-to-peer yang terdesentralisasi dan bebas dari perantara seperti bank, pasar kripto kini semakin diintegrasikan ke dalam infrastruktur keuangan tradisional. **Tren "Wall Street-ization":** Dimulai dengan disetujuinya ETF spot Bitcoin pada 2024, aset kripto kini dikemas menjadi produk seperti ETF (oleh BlackRock, Fidelity, dll.), futures, dan sekuritisasi aset riil (RWA) seperti obligasi pemerintah yang ditokenisasi. Ini memberikan akses yang mudah dan teregulasi bagi investor institusional, tetapi juga berarti kekuasaan atas penerbitan, penentuan harga, kustodian, dan distribusi aset kripto semakin bergeser ke lembaga keuangan besar. **Dua Jalur Konvergensi (1+1>2):** Artikel ini menyoroti dua arah integrasi: 1. **Dari CEX ke TradFi:** Dilambangkan oleh **Gate.io**, yang berkembang dari bursa kripto menjadi platform multi-aset. Gate kini menawarkan perdagangan saham nyata (AS, Hong Kong, Korea) menggunakan USDT, menyediakan akses tanpa batas waktu ke pasar tradisional. 2. **Dari TradFi ke Crypto:** Dilambangkan oleh **Robinhood**, platform broker tradisional yang memperluas layanannya ke aset kripto (termasuk melalui akuisisi Bitstamp) dan mengembangkan produk seperti token saham di blockchain. **Tujuan Bersama: Akun Keuangan "Super" Terpadu:** Kedua jalur ini bertujuan menciptakan **akun keuangan generasi berikutnya yang terpadu**. Pengguna di masa depan mungkin dapat memperdagangkan Bitcoin, saham Apple, ETF, emas, dan obligasi pemerintah yang ditokenisasi dalam satu antarmuka yang sama, menggunakan stablecoin sebagai lapisan dana. **RWA dan Obligasi Pemerintah di On-Chain sebagai Lapisan Tengah:** Tokenisasi aset dunia nyata, terutama obligasi pemerintah AS, menyediakan aset berpenghasilan rendah risiko di ekosistem on-chain. Pasar ini tumbuh pesat (naik 40% pada paruh pertama 2026) meskipun pasar kripto turun, menunjukkan permintaan nyata. **Kesimpulan:** "Wall Street-ization" bukanlah pengambilalihan sepihak, melainkan **transformasi timbal balik**. TradFi dan Crypto saling melengkapi: Crypto mendapatkan akses ke likuiditas, kepatuhan, dan jaringan distribusi yang luas, sementara TradFi mengadopsi efisiensi, kecepatan, dan pasar 24/7 dari Crypto. Hasil akhirnya adalah pembentukan **pasar modal terpadu yang lebih efisien dan global**, di mana batas antara aset tradisional dan kripto semakin kabur.

marsbit21j yang lalu

Gate Research Institute: Produk Keuangan Kripto Menggulirkan Gelombang "Wall Street-ization", Kompetisi atau Integrasi?

marsbit21j yang lalu

Trading

Spot

Artikel Populer

Cara Membeli HYPE

Selamat datang di HTX.com! Kami telah membuat pembelian Hyperliquid (HYPE) menjadi mudah dan nyaman. Ikuti panduan langkah demi langkah kami untuk memulai perjalanan kripto Anda.Langkah 1: Buat Akun HTX AndaGunakan alamat email atau nomor ponsel Anda untuk mendaftar akun gratis di HTX. Rasakan perjalanan pendaftaran yang mudah dan buka semua fitur.Dapatkan Akun SayaLangkah 2: Buka Beli Kripto, lalu Pilih Metode Pembayaran AndaKartu Kredit/Debit: Gunakan Visa atau Mastercard Anda untuk membeli Hyperliquid (HYPE) secara instan.Saldo: Gunakan dana dari saldo akun HTX Anda untuk melakukan trading dengan lancar.Pihak Ketiga: Kami telah menambahkan metode pembayaran populer seperti Google Pay dan Apple Pay untuk meningkatkan kenyamanan.P2P: Lakukan trading langsung dengan pengguna lain di HTX.Over-the-Counter (OTC): Kami menawarkan layanan yang dibuat khusus dan kurs yang kompetitif bagi para trader.Langkah 3: Simpan Hyperliquid (HYPE) AndaSetelah melakukan pembelian, simpan Hyperliquid (HYPE) di akun HTX Anda. Selain itu, Anda dapat mengirimkannya ke tempat lain melalui transfer blockchain atau menggunakannya untuk memperdagangkan mata uang kripto lainnya.Langkah 4: Lakukan trading Hyperliquid (HYPE)Lakukan trading Hyperliquid (HYPE) dengan mudah di pasar spot HTX. Cukup akses akun Anda, pilih pasangan perdagangan, jalankan trading, lalu pantau secara real-time. Kami menawarkan pengalaman yang ramah pengguna baik untuk pemula maupun trader berpengalaman.

421 Total TayanganDipublikasikan pada 2024.12.11Diperbarui pada 2026.06.02

Cara Membeli HYPE

Diskusi

Selamat datang di Komunitas HTX. Di sini, Anda bisa terus mendapatkan informasi terbaru tentang perkembangan platform terkini dan mendapatkan akses ke wawasan pasar profesional. Pendapat pengguna mengenai harga HYPE (HYPE) disajikan di bawah ini.

活动图片