Акт CLARITY может стать одним из важнейших факторов, влияющих на ценовую динамику XRP в 2026 году.
Новая точка зрения, которой поделился член сообщества XRP на платформе X, утверждает, что принятие законопроекта может сделать больше, чем просто вызвать краткосрочный скачок. Согласно расчетам, если XRP станет частью регулируемых расчетных и ликвидностных потоков, даже при небольшом уровне внедрения его минимальная цена может составить $50, а при более глубокой интеграции модель приводит к целям по цене вплоть до $1400.
Почему минимальная цена для XRP может составить $50
Ожидаемое принятие Акта CLARITY теперь учтено в нескольких интересных сценариях цены для XRP.
Вся ценовая модель построена на уравнении обмена (MV=PQ), которое в данном контексте связывает требуемую рыночную стоимость XRP с объемом транзакций, которые он должен обрабатывать, скоростью оборота токенов и доступным объемом эмиссии для обслуживания этих потоков.
Первый случай предполагает, что XRP начнет обрабатывать небольшую долю кросс-граничных расчетов по наличным после принятия Акта CLARITY. Модель исходит из ежегодного объема в $15 трлн, 6 млрд XRP в качестве продуктивной денежной базы и скорости оборота (velocity) 50 раз. Это дает цену как минимум $50. Та же модель также применяет расчет глубины ликвидности по формуле квадратного корня для транзакционных пакетов ("тикетов") в $100 млн, что дает диапазон поддержки для XRP примерно от $40 до $80.

Второй сценарий предполагает цену XRP около $280. Он исходит из того, что XRP обслуживает расчеты по операциям РЕПО и обеспечивает маржу для AppChain, с годовым потоком в $100 трлн, 6 млрд XRP в качестве денежной базы и скоростью оборота от 50 до 60 раз. По модели MV=PQ оценка составляет около $303, в то время как модель глубины ликвидности определяет уровень поддержки между $125 и $170.
"Структурный базовый сценарий" повышает оценку примерно до $415 за счет учета сжатия предложения. В этом случае маржа по деривативам блокирует 20% продуктивной ликвидности, сокращая доступные XRP с 6 млрд примерно до 4,8 млрд. Тот же поток в $100 трлн распределяется по меньшему количеству доступных токенов, что толкает требуемую цену выше.
Сценарий "Полной интеграции" дает самый широкий диапазон — от $700 до $1400. Он предполагает использование XRP во всех пяти расчетных позициях, включая поставку против платежа (DVP) и сделки с финансированием под ценные бумаги. Согласно этому сценарию, годовой поток превышает $200 трлн, а доступное количество XRP сокращается примерно до 4,2 млрд.
Акт CLARITY ближе, чем когда-либо
Прогресс в принятии Акта CLARITY занял больше времени, чем первоначально ожидали многие заинтересованные стороны. Акт CLARITY был формально принят Палатой представителей 17 июля 2025 года, но версия для Сената оказалась более сложной.
Однако сроки принятия закона теперь близки. Акт CLARITY уже прошел комитет Сената по банковским делам, и следующим шагом может стать голосование на пленарном заседании Сената летом. Администрация Белого дома нацелилась на 4 июля как на целевую дату принятия, и инвесторы в криптовалюты наблюдают за тем, как окончательное одобрение законопроекта может повлиять на цены криптовалют, особенно XRP, после того как он будет подписан и станет законом.
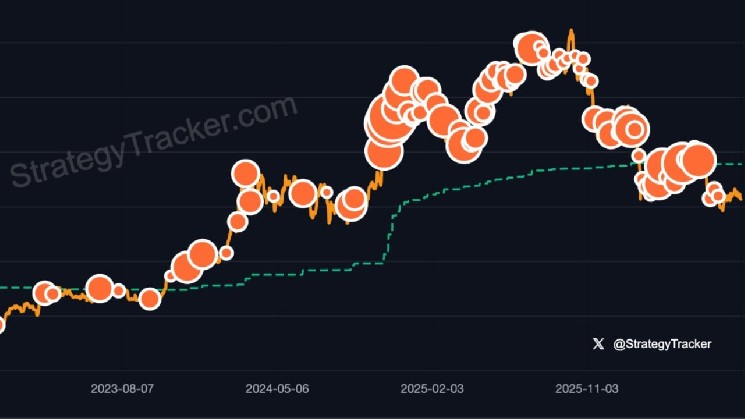
Изображение: Unsplash, график: TradingView