Ether (ETH) колеблется около $3 000 в течение последних трех недель, что является периодом консолидации после его мгновенного падения до $2 620 21 ноября. Трейдеры Ether теперь задаются вопросом о вероятности дальнейшей коррекции, если поддержка на уровне $2 800 будет потеряна.
Ключевые моменты:
Ether снова опустился ниже $3 000 из-за отсутствия спроса на фьючерсы и агрессивных продаж долгосрочных держателей.
Снижение комиссий и активности в сети Ethereum указывает на меньший спрос в ончейне.
Слабые технические настройки предупреждали о падении до $2 300, если следующая поддержка будет потеряна.
Цена ETH застряла между двумя линиями тренда
Недавнее восстановление Ether было отклонено сопротивлением от 50-дневной экспоненциальной скользящей средней (EMA), которая в настоящее время находится на уровне $3 260, как показано на дневном графике ниже.
По теме: Тренд цены Ether прогнозирует трехзначный рост, поскольку приток средств в ETH ETF возобновляется
Однако при этом движении ETH/USD нашла поддержку в зоне спроса $2 800-$2 600. В настоящее время 200-недельная EMA находится в этой зоне.
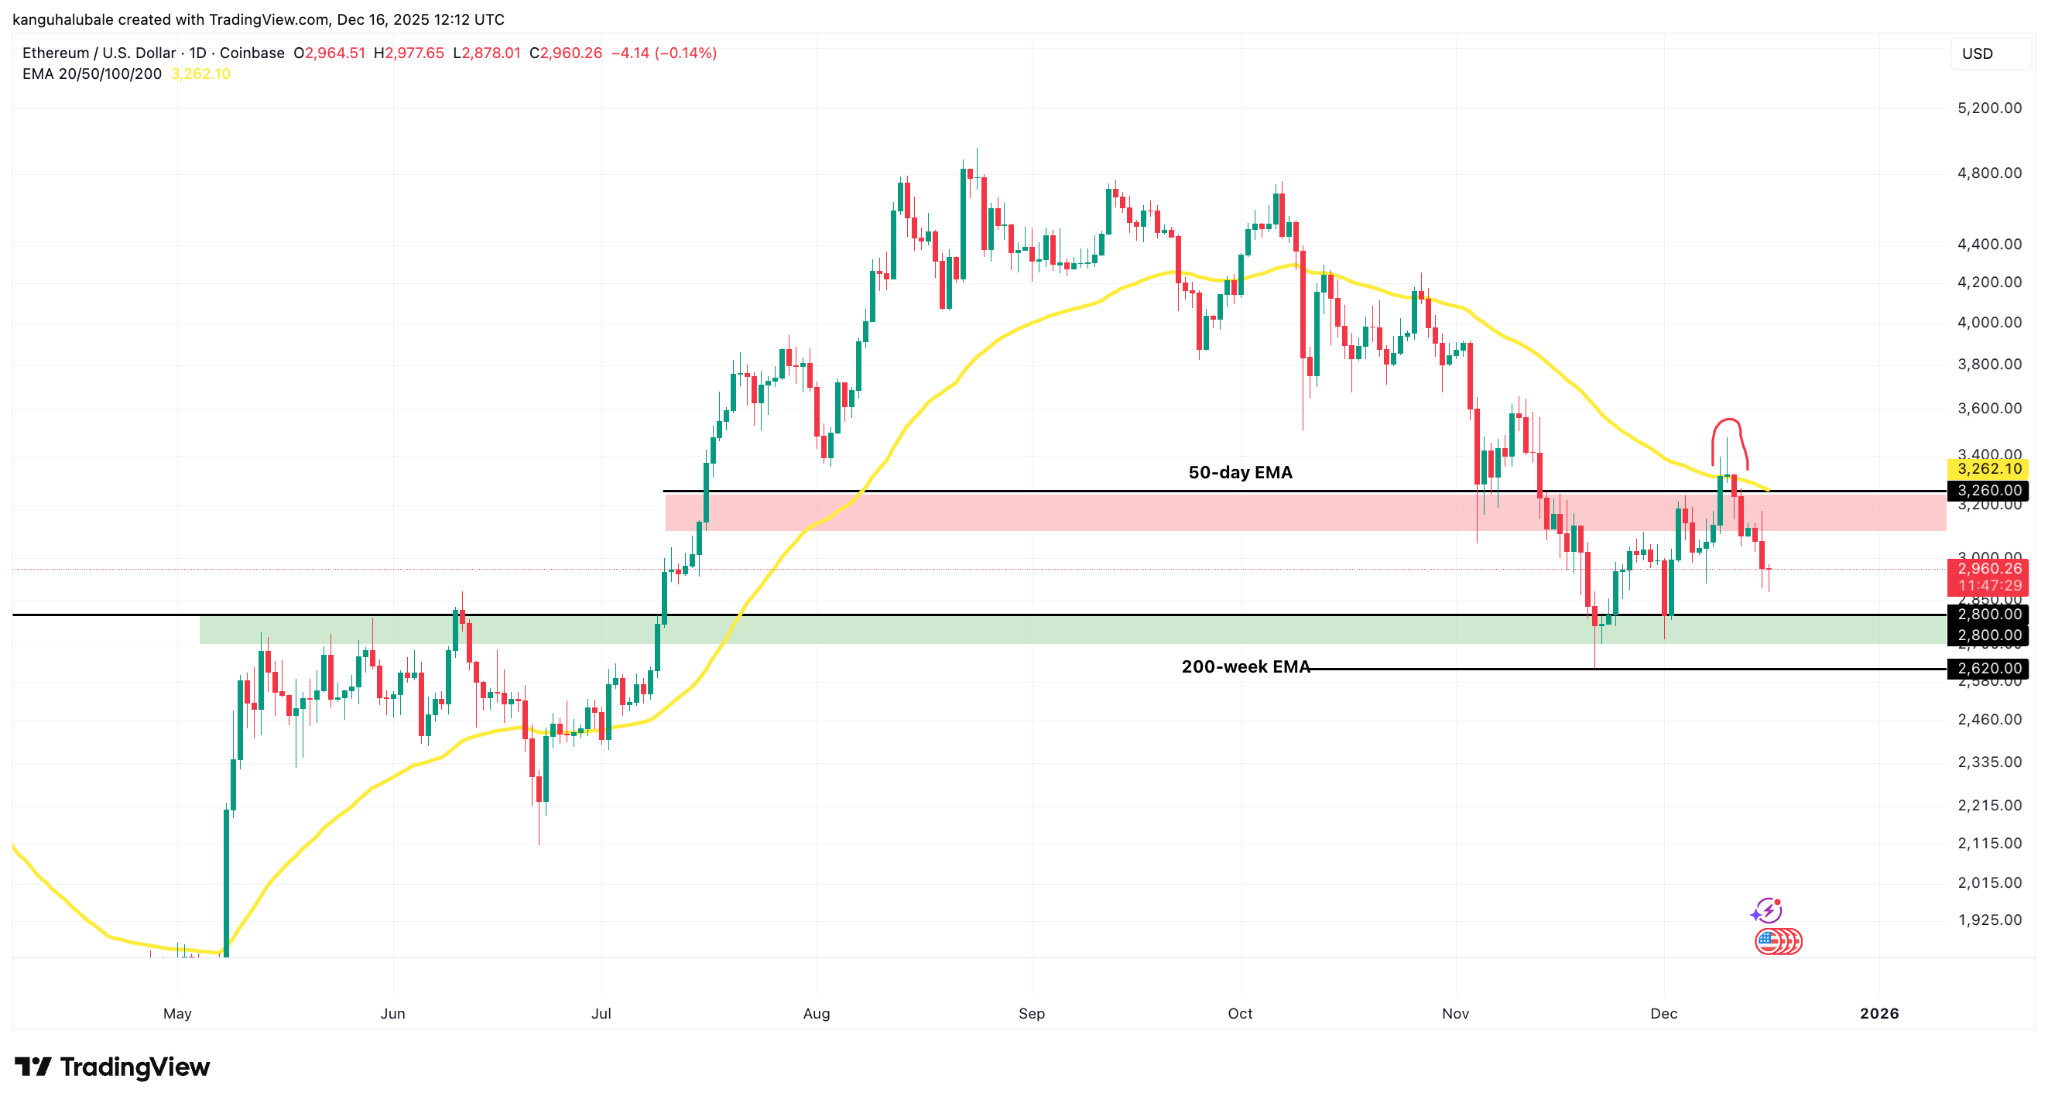
ETH должен подняться выше сопротивления на уровне $3 000 и превзойти 50-дневную EMA, чтобы выйти из консолидации для устойчивого восстановления до $4 000.
Тепловая карта распределения себестоимости Glassnode показала сопротивление между $3 100 и $3 250, где инвесторы приобрели примерно 5,9 миллиона ETH.

С другой стороны, ключевая область поддержки находится вокруг $2 800, где ранее было куплено 5,8 миллиона ETH.
Цене Ether не хватает бычьего импульса
Фьючерсы на Ether в настоящее время торгуются с премией в 3% по отношению к медвежьим спотовым рынкам ETH, что отражает снижение спроса со стороны покупателей, использующих кредитное плечо.
В условиях медвежьего рынка премии по фьючерсам обычно остаются ниже 5%, что сигнализирует о слабом спросе на длинные позиции с плечом и меньшем оптимизме среди трейдеров.
Что еще более тревожно, даже восстановление на прошлой неделе до $3 750 не восстановило устойчивые бычьи настроения среди трейдеров.

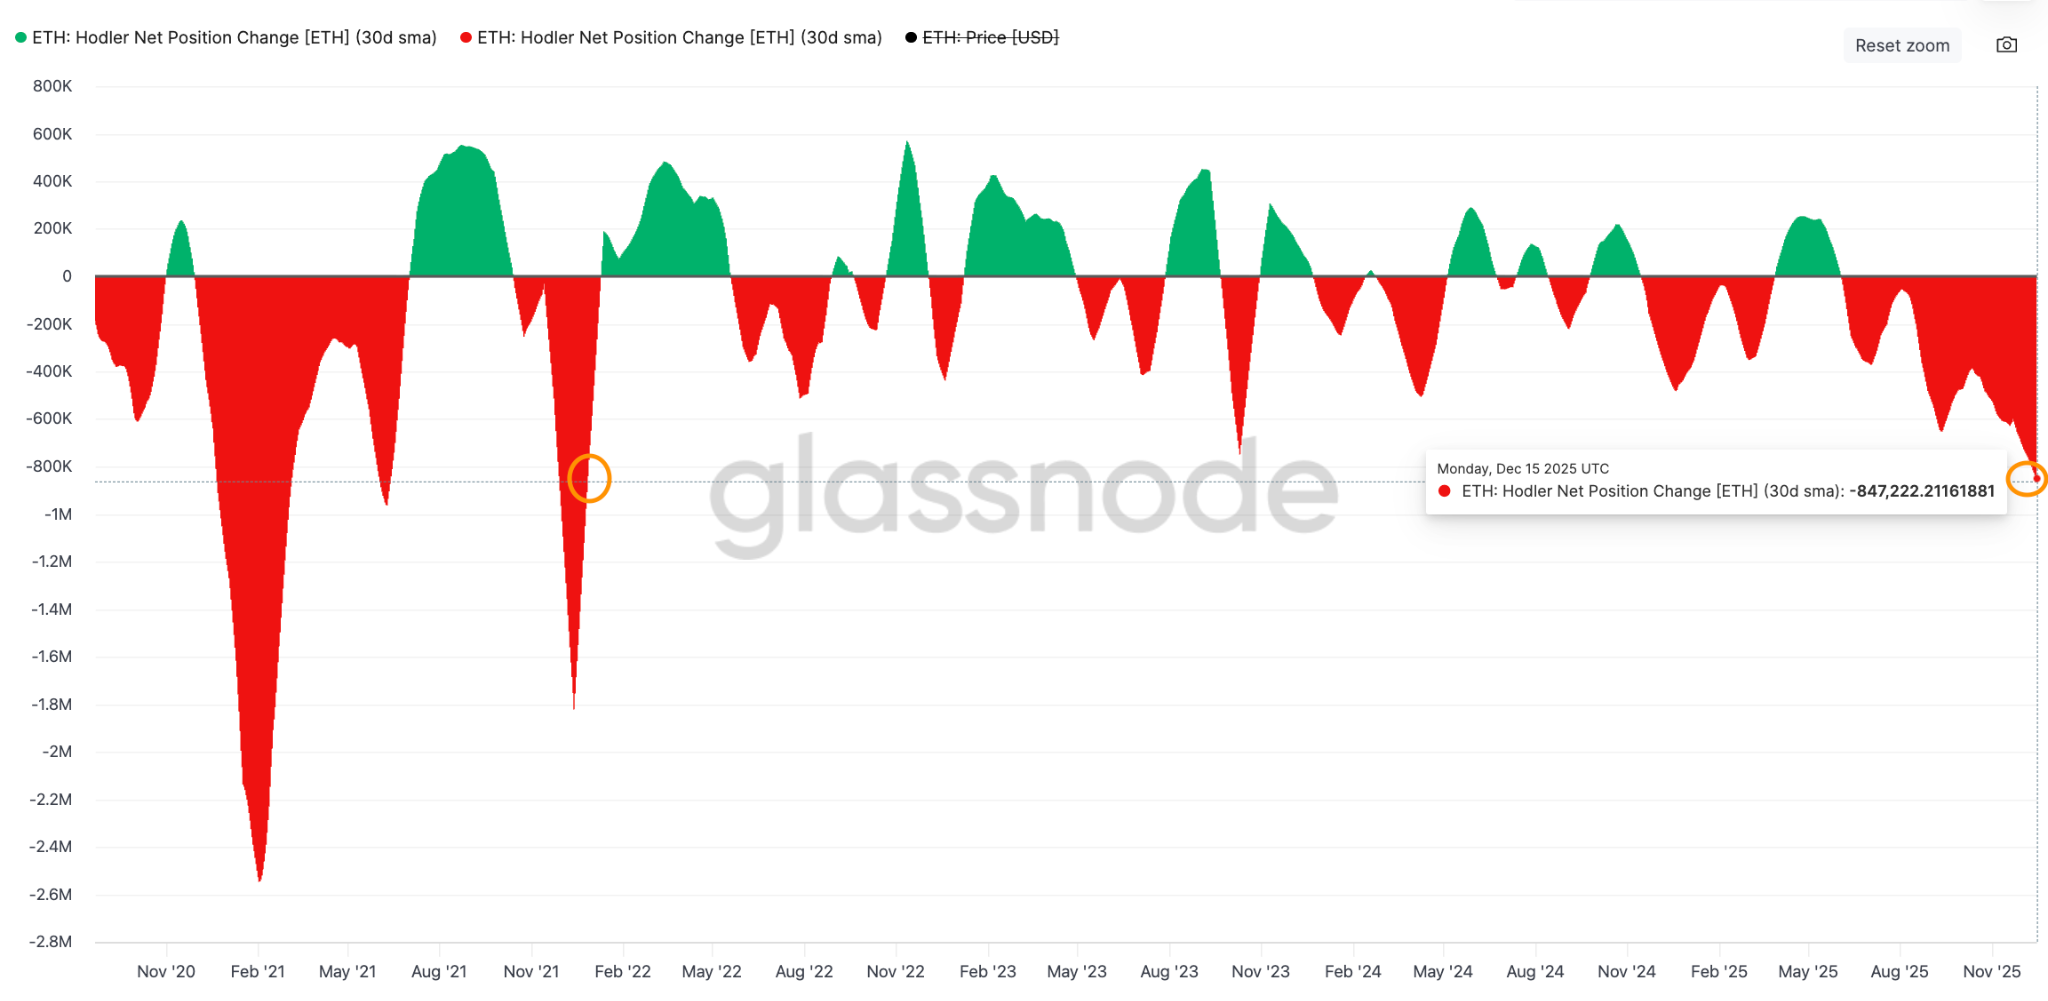
Медвежий тренд на фьючерсах Ether совпал со снижением предложения долгосрочных держателей, которое уменьшилось на 847 222 монет за последние 30 дней, что является самым большим падением с января 2021 года. Это добавляет давление со стороны продавцов, которое не позволяет ETH оставаться выше $3 000.
Неспособность Ether остаться выше $3 000 также можно объяснить снижением комиссий в сети Ethereum, хотя эта проблема затронула весь рынок криптовалют.
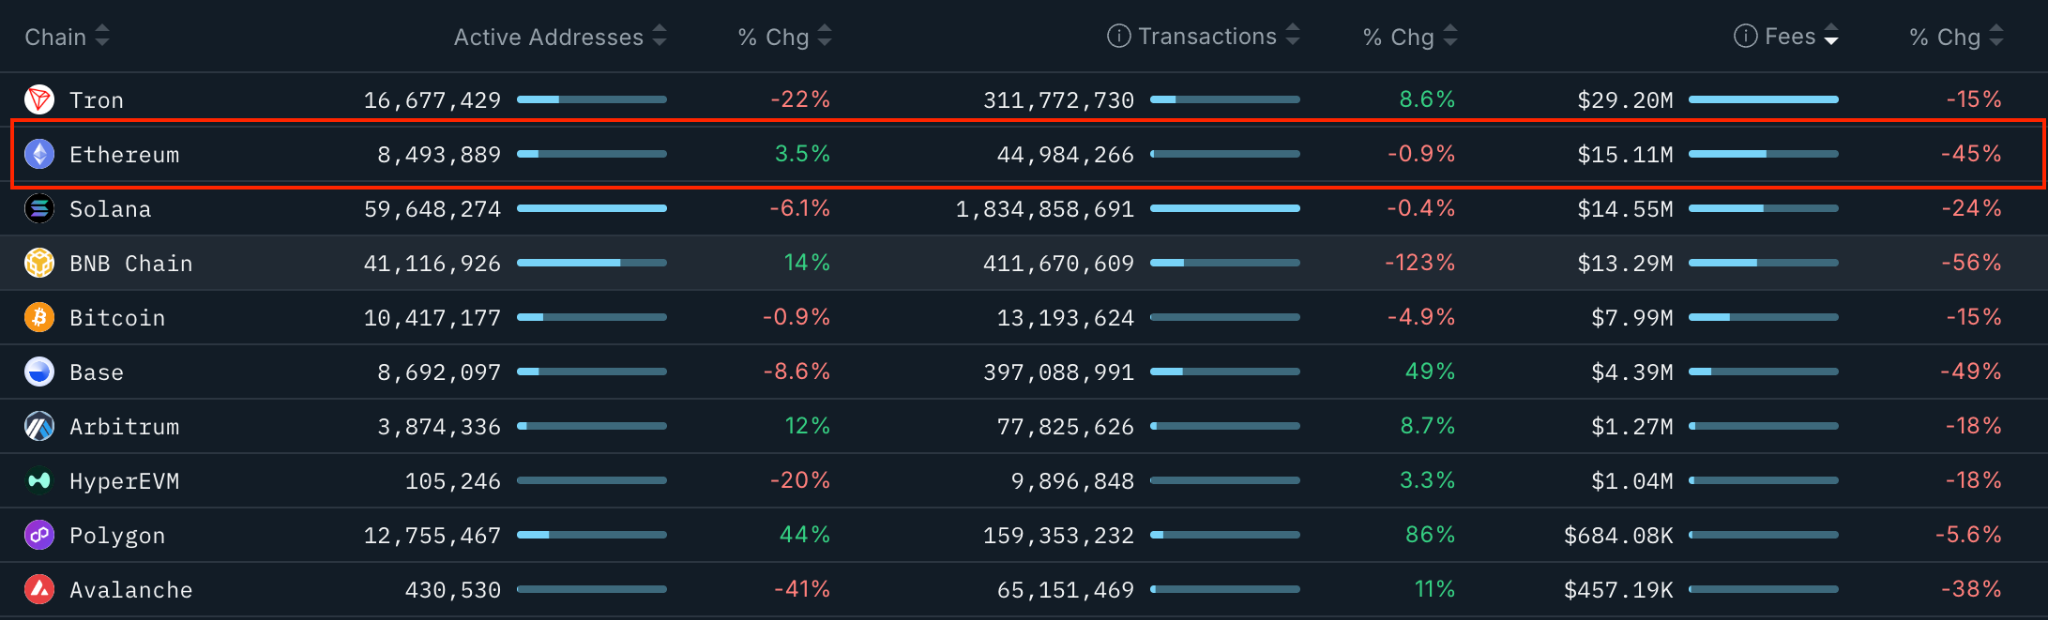
Комиссии в цепи Ethereum за последние 30 дней составили $15,1 миллиона, что на 45% меньше, чем в предыдущем месяце. Для сравнения, комиссии в BNB Chain упали на 56%, а в Tron — на 15%.
Хотя количество активных адресов на базовом уровне Ethereum увеличилось на 3,5% за тот же период, за последние семь дней оно уменьшилось на 14%. Количество транзакций за семидневный период снизилось на 11%.
Медведи Ethereum нацеливаются на цену ETH в $2 300
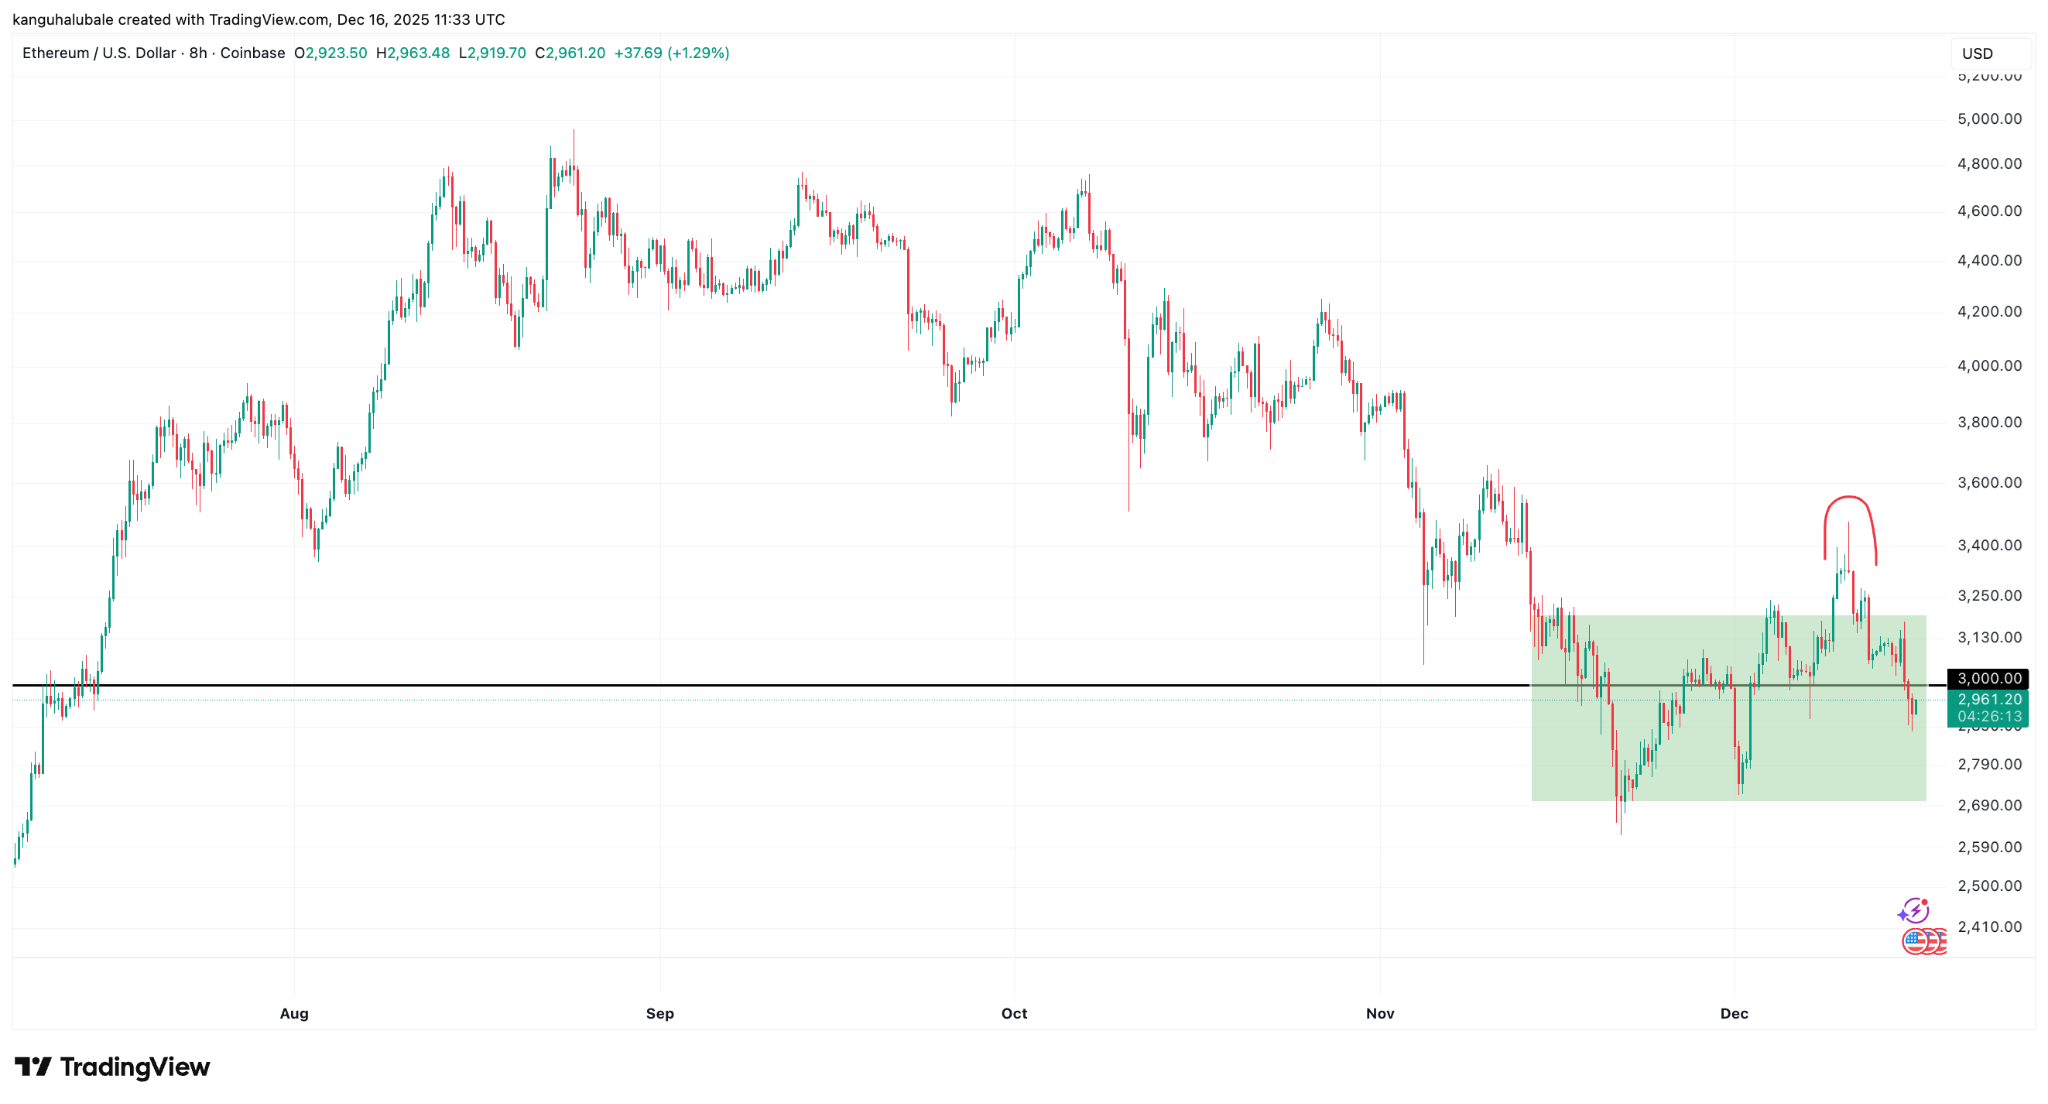
Пара ETH/USD подтвердила медвежий флаг на дневном графике после падения ниже его нижней границы на уровне $3 200, как показано ниже.
«Ethereum консолидируется после резкого распродажи, формируя медвежий флаг под предыдущей поддержкой near зоне от 3 173 до 3 250», — сказал аналитик Danny Naz в посте в X в воскресенье, добавив:
«Эта область превратилась в сопротивление.»
Измеренная цель флага составляет $2 300, что представляет собой падение на 22% от текущей цены.

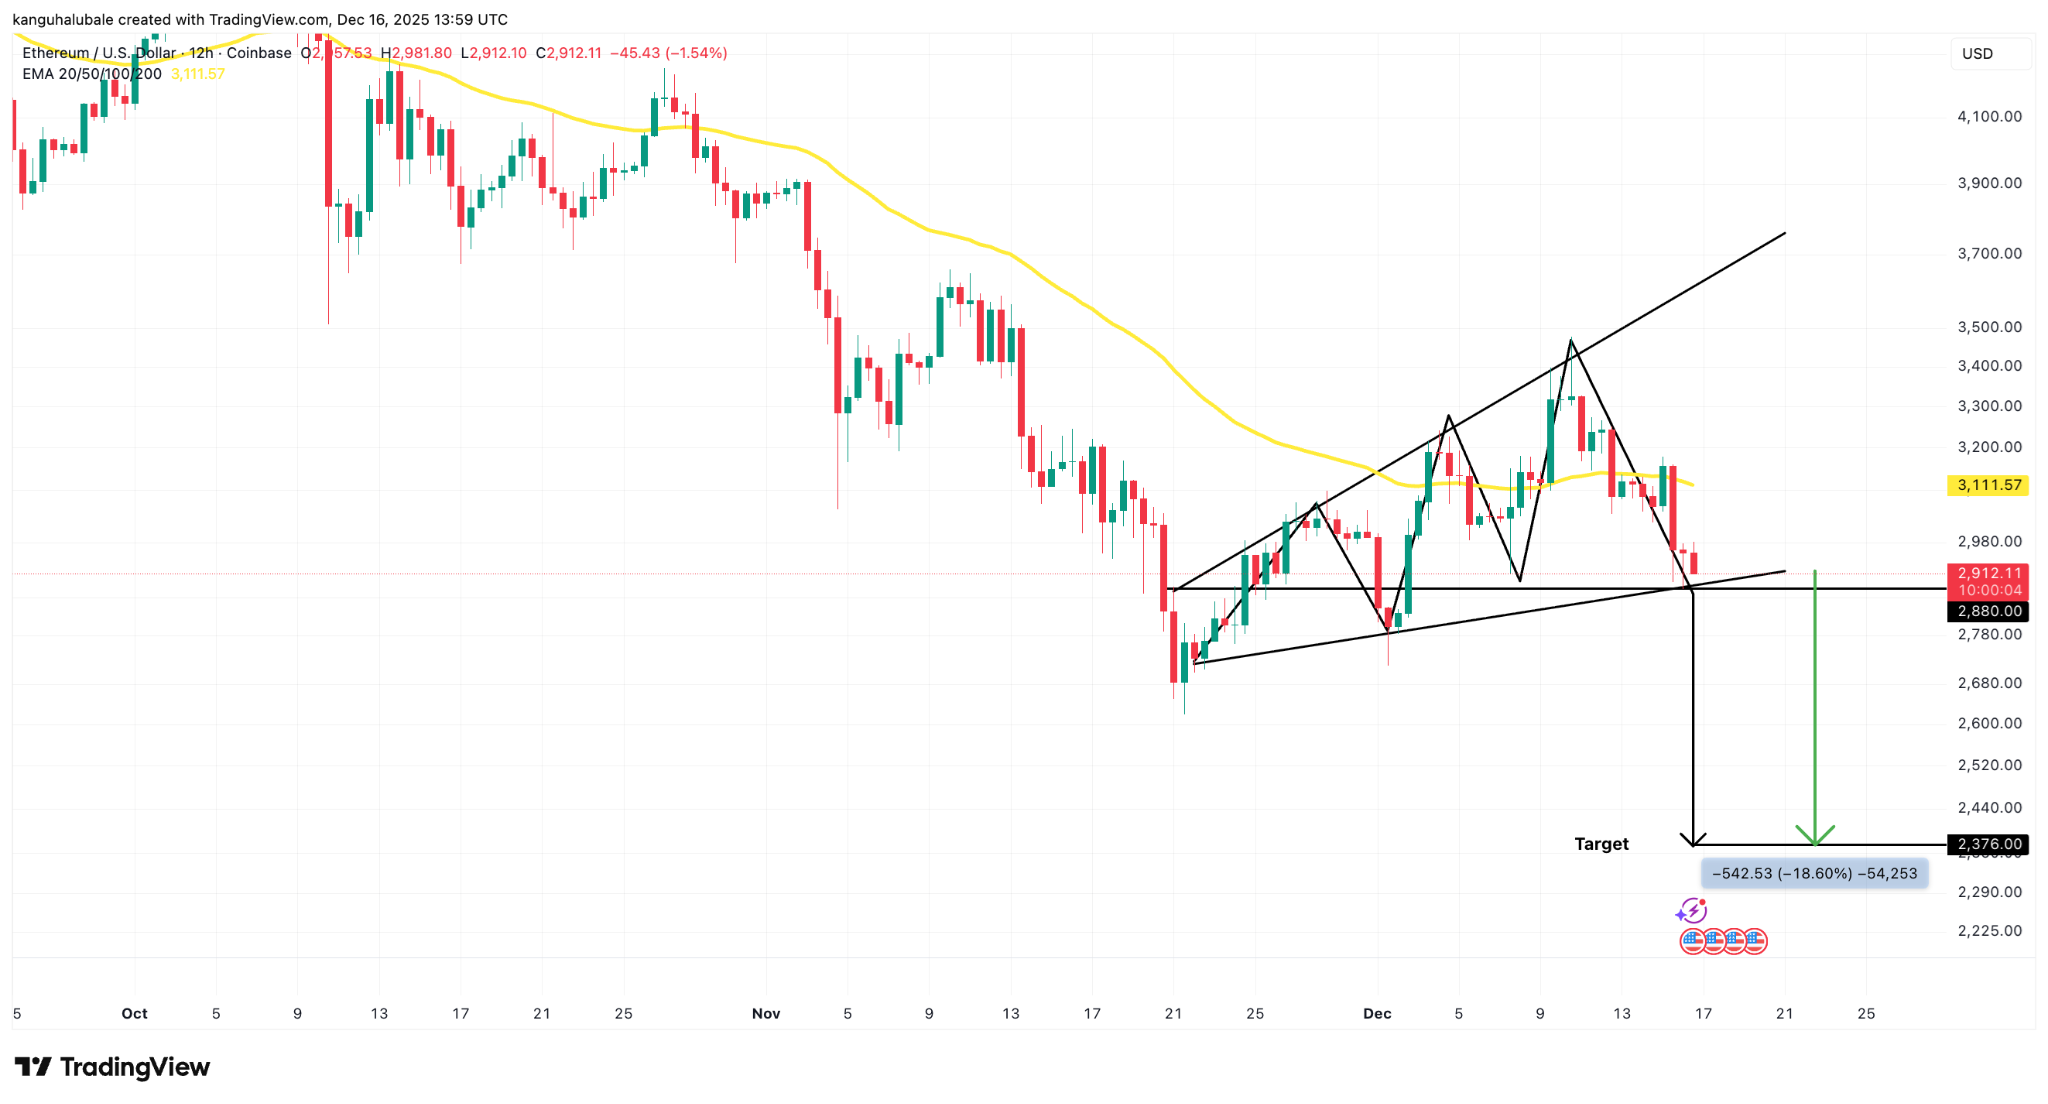
Приближаясь к 12-часовому таймфрейму, пробой и закрытие ниже нижней линии тренда мегафонового паттерна на уровне $2 800 открыло бы путь для более глубокой коррекции к измеренной цели паттерна на уровне $2 376.
Такое движение represent падение на 18% от текущей цены.
Если эта поддержка не устоит и медведям удастся опустить цену ниже $2 800, цена ETH может опуститься до следующей зоны поддержки от $2 716 до $2 623.
Эта статья не содержит инвестиционных советов или рекомендаций. Каждое инвестиционное и торговое решение связано с риском, и читатели должны провести собственное исследование при принятии решения. Хотя мы стремимся предоставлять точную и своевременную информацию, Cointelegraph не гарантирует точность, полноту или надежность любой информации в этой статье. Эта статья может содержать прогнозные заявления, которые подвержены рискам и неопределенностям. Cointelegraph не несет ответственности за любые убытки или ущерб, возникшие в результате вашей reliance на эту информацию.