What Really Triggered Feb. 5’s Bitcoin Crash? Jeff Park’s New Theory

bitcoinistОпубликовано 2026-02-09Обновлено 2026-02-09

Введение

Jeff Park attributes Bitcoin's sharp 13.2% decline on Feb. 5 to traditional finance mechanics rather than crypto-specific news. He argues the crash was triggered by broad-based deleveraging in multi-strategy funds following a significant risk-off event. This forced selling coincided with a surge in put options and record volume in BlackRock's IBIT ETF. Paradoxically, the ETF saw net inflows instead of outflows, suggesting the selling pressure came from derivatives and hedging activity. Park points to a rapid unwind of basis trades and short-gamma mechanics, where dealers were forced to sell into falling prices, exacerbating the drop. The snap-back recovery on Feb. 6 is framed as a positioning reset, indicating the event was primarily a technical breakdown driven by a change in fundamentals.

Bitcoin got hit hard on Feb. 5 (down 13.2%), and Jeff Park’s take is pretty blunt: this didn’t look like a crypto headline. It looked more like tradfi plumbing: margin, derivatives, and ETF mechanics, running through spot Bitcoin ETFs, with BlackRock’s IBIT right in the middle. Here’s the odd part: flows didn’t show the big redemptions you’d normally expect on a day like that.

Why Did Bitcoin Crash On Feb. 5?

Park starts with the ETF tape in his X post from Feb. 7. IBIT, he said, did record volume—“2x the prior high, 10B+”—and options were going nuts too, with contract counts at launch-era highs. And unlike prior spikes in options interest, he says this one leaned put-heavy, based on a clear volume imbalance.

That timing matters. It landed right as markets were going risk-off across the board. Park cited Goldman’s prime brokerage desk calling Feb. 4 one of the worst daily performance events for multi-strat funds, around a 3.5 z-score—basically a “0.05% event” in his framing. When that happens, pod-shop risk managers step in and tell everyone the same thing: cut gross, fast. Park frames Feb. 5 as the second leg of that forced deleveraging.

But the flow data didn’t line up with the obvious story. He points to prior IBIT drawdowns where you did see real redemptions: Jan. 30’s roughly $530 million of net outflows after a 5.8% down day, and Feb. 4’s roughly $370 million during the losing streak. On a -13% day, you’d think you’d see $500M–$1B of outflows. He didn’t.
Instead, Park points to net creations: about 6 million new IBIT shares created, adding roughly $230 million in AUM. And the rest of the spot Bitcoin ETF complex was net positive too—$300M+. “That is a little perplexing,” he wrote. His point: it probably wasn’t one thing.

Deleveraging First, Then Short-Gamma Mechanics

His main claim: the trigger wasn’t crypto-native. “The catalyst to the sell off was that there was a broad based deleveraging across multi-asset funds/portfolios due to the high downside correlation of risk assets reaching statistically anomalous levels,” he wrote. In his view, that set off violent de-risking that included Bitcoin, even if a lot of the exposure was supposedly “delta neutral”: basis trades, RV versus crypto equities, and other setups that box delta across dealers.

After that, the hedging mechanics took over. “This deleveraging then caused some short gamma to come into effect that compounded to the downside,” he wrote, basically saying dealers had to sell IBIT as their hedges updated. And because it happened so fast, he thinks market makers ended up net short Bitcoin without really managing inventory the “normal” way. That can mute what you’d otherwise see as big ETF outflows on the tape.

He also notes how closely IBIT tracked software equities and other risk assets in the weeks leading into the drop. In his framing, the software-led selloff is the cleaner spark here: gold matters, sure, but it’s less central to the funded multi-strat trades he’s talking about.

One hard datapoint he leans on is the CME basis. Using a dataset he attributed to Anchorage Digital Head of Research David Lawant, Park said the near-dated CME BTC basis jumped from 3.3% on Feb. 5 to 9% on Feb. 6—an unusually big move since the ETF launch. He reads that as a forced unwind of the basis trade by large multi-strat shops (sell spot, buy futures).

As extra fuel, he brings up structured products: knock-ins and barrier levels. Not necessarily the driver, but something that can make a fast move nastier. He referenced a JPM note priced in November with a barrier “right at 43.6,” and argued that if similar notes were printed later as BTC slid, barriers could cluster around “38–39.”

That’s the kind of zone where a fast selloff can flip hedging into a cascade. If barriers break, negative vanna and quickly changing gamma can force dealers to sell hard into weakness. He also notes implied vol nearly touching 90% in his description.

Why Bitcoin Snapped Back On Feb. 6

Park frames Feb. 6’s “heroic 10%+ recovery” as a positioning reset. CME open interest expanded faster than Binance’s. He says CME OI collapsed from Feb. 4 to Feb. 5 (supporting the basis-unwind idea), then recovered as players leaned back into relative-value setups.

In his telling, ETF creates/redeems can look flat-ish if the basis trade is being rebuilt, even if price stays heavy because crypto-native leverage and short-gamma exposures—often on offshore venues—are still clearing out.

Bottom line, in his view: this may not have been “fundamental” at all. It was technical plumbing: multi-asset de-risking, then derivatives feedback loops making it worse. If ETF inflows keep coming without a matching expansion in the basis trade, he implies, that’s the cleaner signal of real demand, less dealer recycling, more sticky buyers.

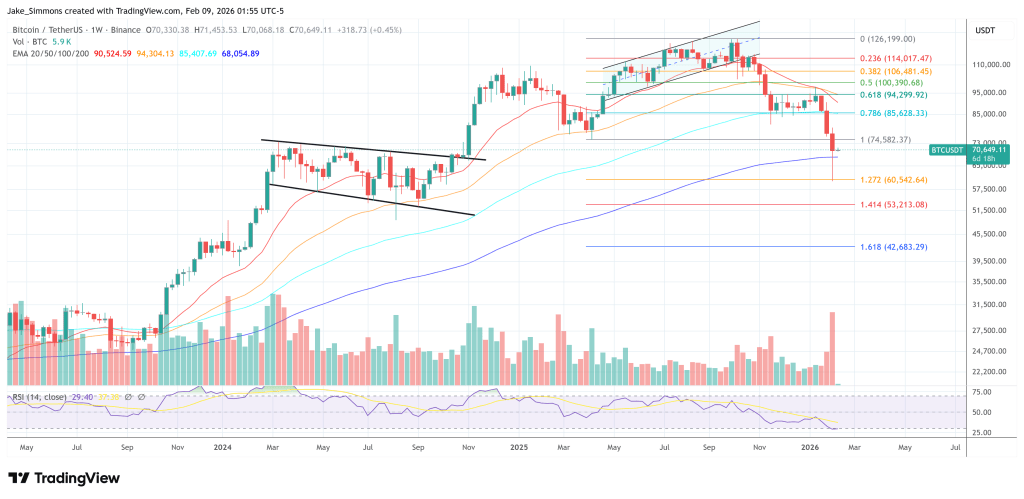
At press time, BTC traded at $70,649.

Bitcoin closed the week above the 200-week EMA, 1-week chart | Source: BTCUSDT on TradingView.com

Связанные с этим вопросы

QAccording to Jeff Park, what was the primary trigger for the Bitcoin crash on February 5th?

AThe primary trigger was a broad-based deleveraging across multi-asset funds and portfolios, caused by statistically anomalous downside correlation of risk assets, which forced a violent de-risking event.

QWhy were the net flows into spot Bitcoin ETFs, including IBIT, 'perplexing' on the day of the crash?

ADespite a 13.2% price crash, the ETFs saw net creations and positive inflows (IBIT added ~$230M AUM, and the complex was net positive over $300M), which is the opposite of the massive outflows one would typically expect on such a down day.

QWhat role did 'short-gamma mechanics' play in exacerbating the selloff?

AThe initial deleveraging forced dealers to update their hedges, causing a short-gamma effect where they had to sell IBIT into the falling market, which compounded the downside move.

QWhat does the sharp jump in the CME BTC basis from 3.3% to 9% indicate, according to Park's theory?

AIt indicates a forced unwind of the basis trade by large multi-strategy shops, where they were selling spot Bitcoin and buying futures contracts to close their positions.

QHow does Park explain the sharp price recovery that occurred on February 6th?

AHe frames it as a positioning reset, where CME open interest recovered as players leaned back into relative-value trades, helping to stabilize and push the price back up.

Похожее

Торговля

Спот
Фьючерсы

Популярные статьи

Как купить S

Добро пожаловать на HTX.com! Мы сделали приобретение Sonic (S) простым и удобным. Следуйте нашему пошаговому руководству и отправляйтесь в свое крипто-путешествие.Шаг 1: Создайте аккаунт на HTXИспользуйте свой адрес электронной почты или номер телефона, чтобы зарегистрироваться и бесплатно создать аккаунт на HTX. Пройдите удобную регистрацию и откройте для себя весь функционал.Создать аккаунтШаг 2: Перейдите в Купить криптовалюту и выберите свой способ оплатыКредитная/Дебетовая Карта: Используйте свою карту Visa или Mastercard для мгновенной покупки Sonic (S).Баланс: Используйте средства с баланса вашего аккаунта HTX для простой торговли.Третьи Лица: Мы добавили популярные способы оплаты, такие как Google Pay и Apple Pay, для повышения удобства.P2P: Торгуйте напрямую с другими пользователями на HTX.Внебиржевая Торговля (OTC): Мы предлагаем индивидуальные услуги и конкурентоспособные обменные курсы для трейдеров.Шаг 3: Хранение Sonic (S)После приобретения вами Sonic (S) храните их в своем аккаунте на HTX. В качестве альтернативы вы можете отправить их куда-либо с помощью перевода в блокчейне или использовать для торговли с другими криптовалютами.Шаг 4: Торговля Sonic (S)С легкостью торгуйте Sonic (S) на спотовом рынке HTX. Просто зайдите в свой аккаунт, выберите торговую пару, совершайте сделки и следите за ними в режиме реального времени. Мы предлагаем удобный интерфейс как для начинающих, так и для опытных трейдеров.

1.2k просмотров всегоОпубликовано 2025.01.15Обновлено 2025.03.21

Как купить S

Sonic: Обновления под руководством Андре Кронье – новая звезда Layer-1 на фоне спада рынка

Он решает проблемы масштабируемости, совместимости между блокчейнами и стимулов для разработчиков с помощью технологических инноваций.

2.2k просмотров всегоОпубликовано 2025.04.09Обновлено 2025.04.09

Sonic: Обновления под руководством Андре Кронье – новая звезда Layer-1 на фоне спада рынка

HTX Learn: Пройдите обучение по "Sonic" и разделите 1000 USDT

HTX Learn — ваш проводник в мир перспективных проектов, и мы запускаем специальное мероприятие "Учитесь и Зарабатывайте", посвящённое этим проектам. Наше новое направление .

1.8k просмотров всегоОпубликовано 2025.04.10Обновлено 2025.04.10

HTX Learn: Пройдите обучение по "Sonic" и разделите 1000 USDT

Обсуждения

Добро пожаловать в Сообщество HTX. Здесь вы сможете быть в курсе последних новостей о развитии платформы и получить доступ к профессиональной аналитической информации о рынке. Мнения пользователей о цене на S (S) представлены ниже.

活动图片