Venice Token [VVV] вырос на 14,37% до $6,40, в то время как объем торгов увеличился на 26,54% до $23,12 млн, что сигнализирует о сильном расширении спроса на спотовом рынке.
Это расширение показывает, что цена не дрейфует вверх, а растет благодаря сильному спросу на споте.
По мере роста участия, ралли отражает убежденность, а не всплески на низкой ликвидности. Рост цены VVV до $6,40 подчеркивает соответствие между спросом и ценовым действием.
Однако расширение объема на этом этапе также предполагает, что трейдеры реагируют на пробой, а не anticipate его.
В результате эта фаза часто определяет, сможет ли продолжение удержаться или начнет ослабевать под давлением.
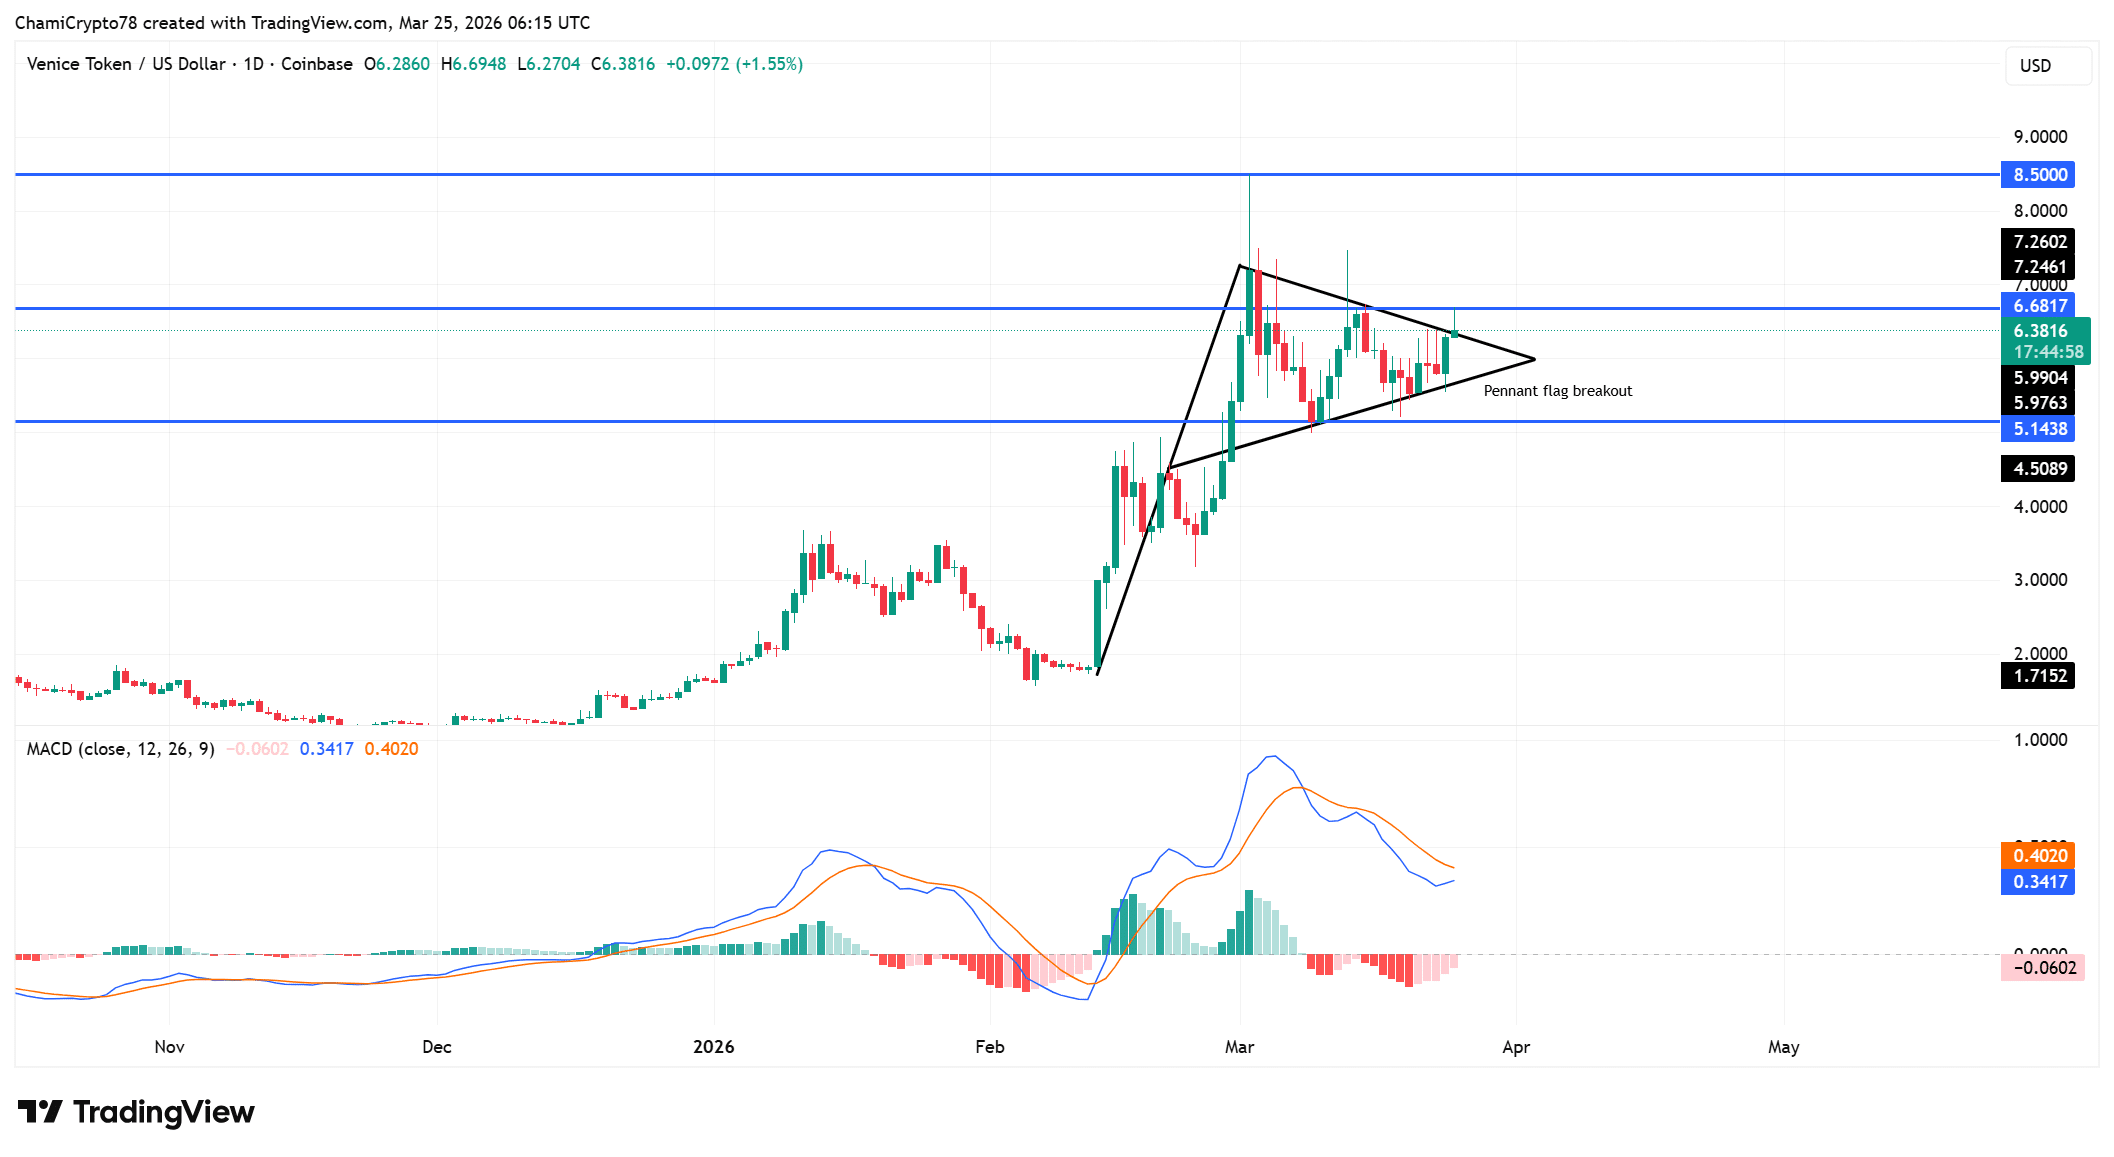
VVV вырывается на свободу по мере смещения структуры вверх
Цена вышла из флага-вымпела, завершив предыдущую фазу сжатия и сместив структуру в сторону расширения.
Пробой устанавливает ближайшее сопротивление на уровне $6,68, в то время как более широкая цель формируется около $8,50, если продолжение сохранится.
Кроме того, бывший регион консолидации вокруг $5,14 теперь действует как ключевая база поддержки. Этот переход отражает сдвиг от нерешительности к направленному контролю.
Однако цена теперь приближается к зонам сопротивления, где продавцы могут отреагировать. В результате удержание выше зоны пробоя остается критически важным.
Если цена сохранит эту структуру, пробой может продолжиться, но неспособность удержать поддержку быстро ослабит setup.
Структура MACD показывает, что бычья сила не полностью совпала с ценовым действием.
Индикатор не пересек сигнальную линию сверху, что ограничивает подтверждение устойчивого восходящего давления.
Кроме того, гистограмма стала отрицательной, что отражает ослабление силы после пробоя.
Это расхождение подчеркивает разрыв между структурным расширением и внутренней силой. Однако цена продолжает удерживаться выше ключевых уровней, что предполагает, что покупатели все еще защищают движение.
В результате текущая setup отражает расширение на ранней стадии, а не полностью подтвержденное продолжение.

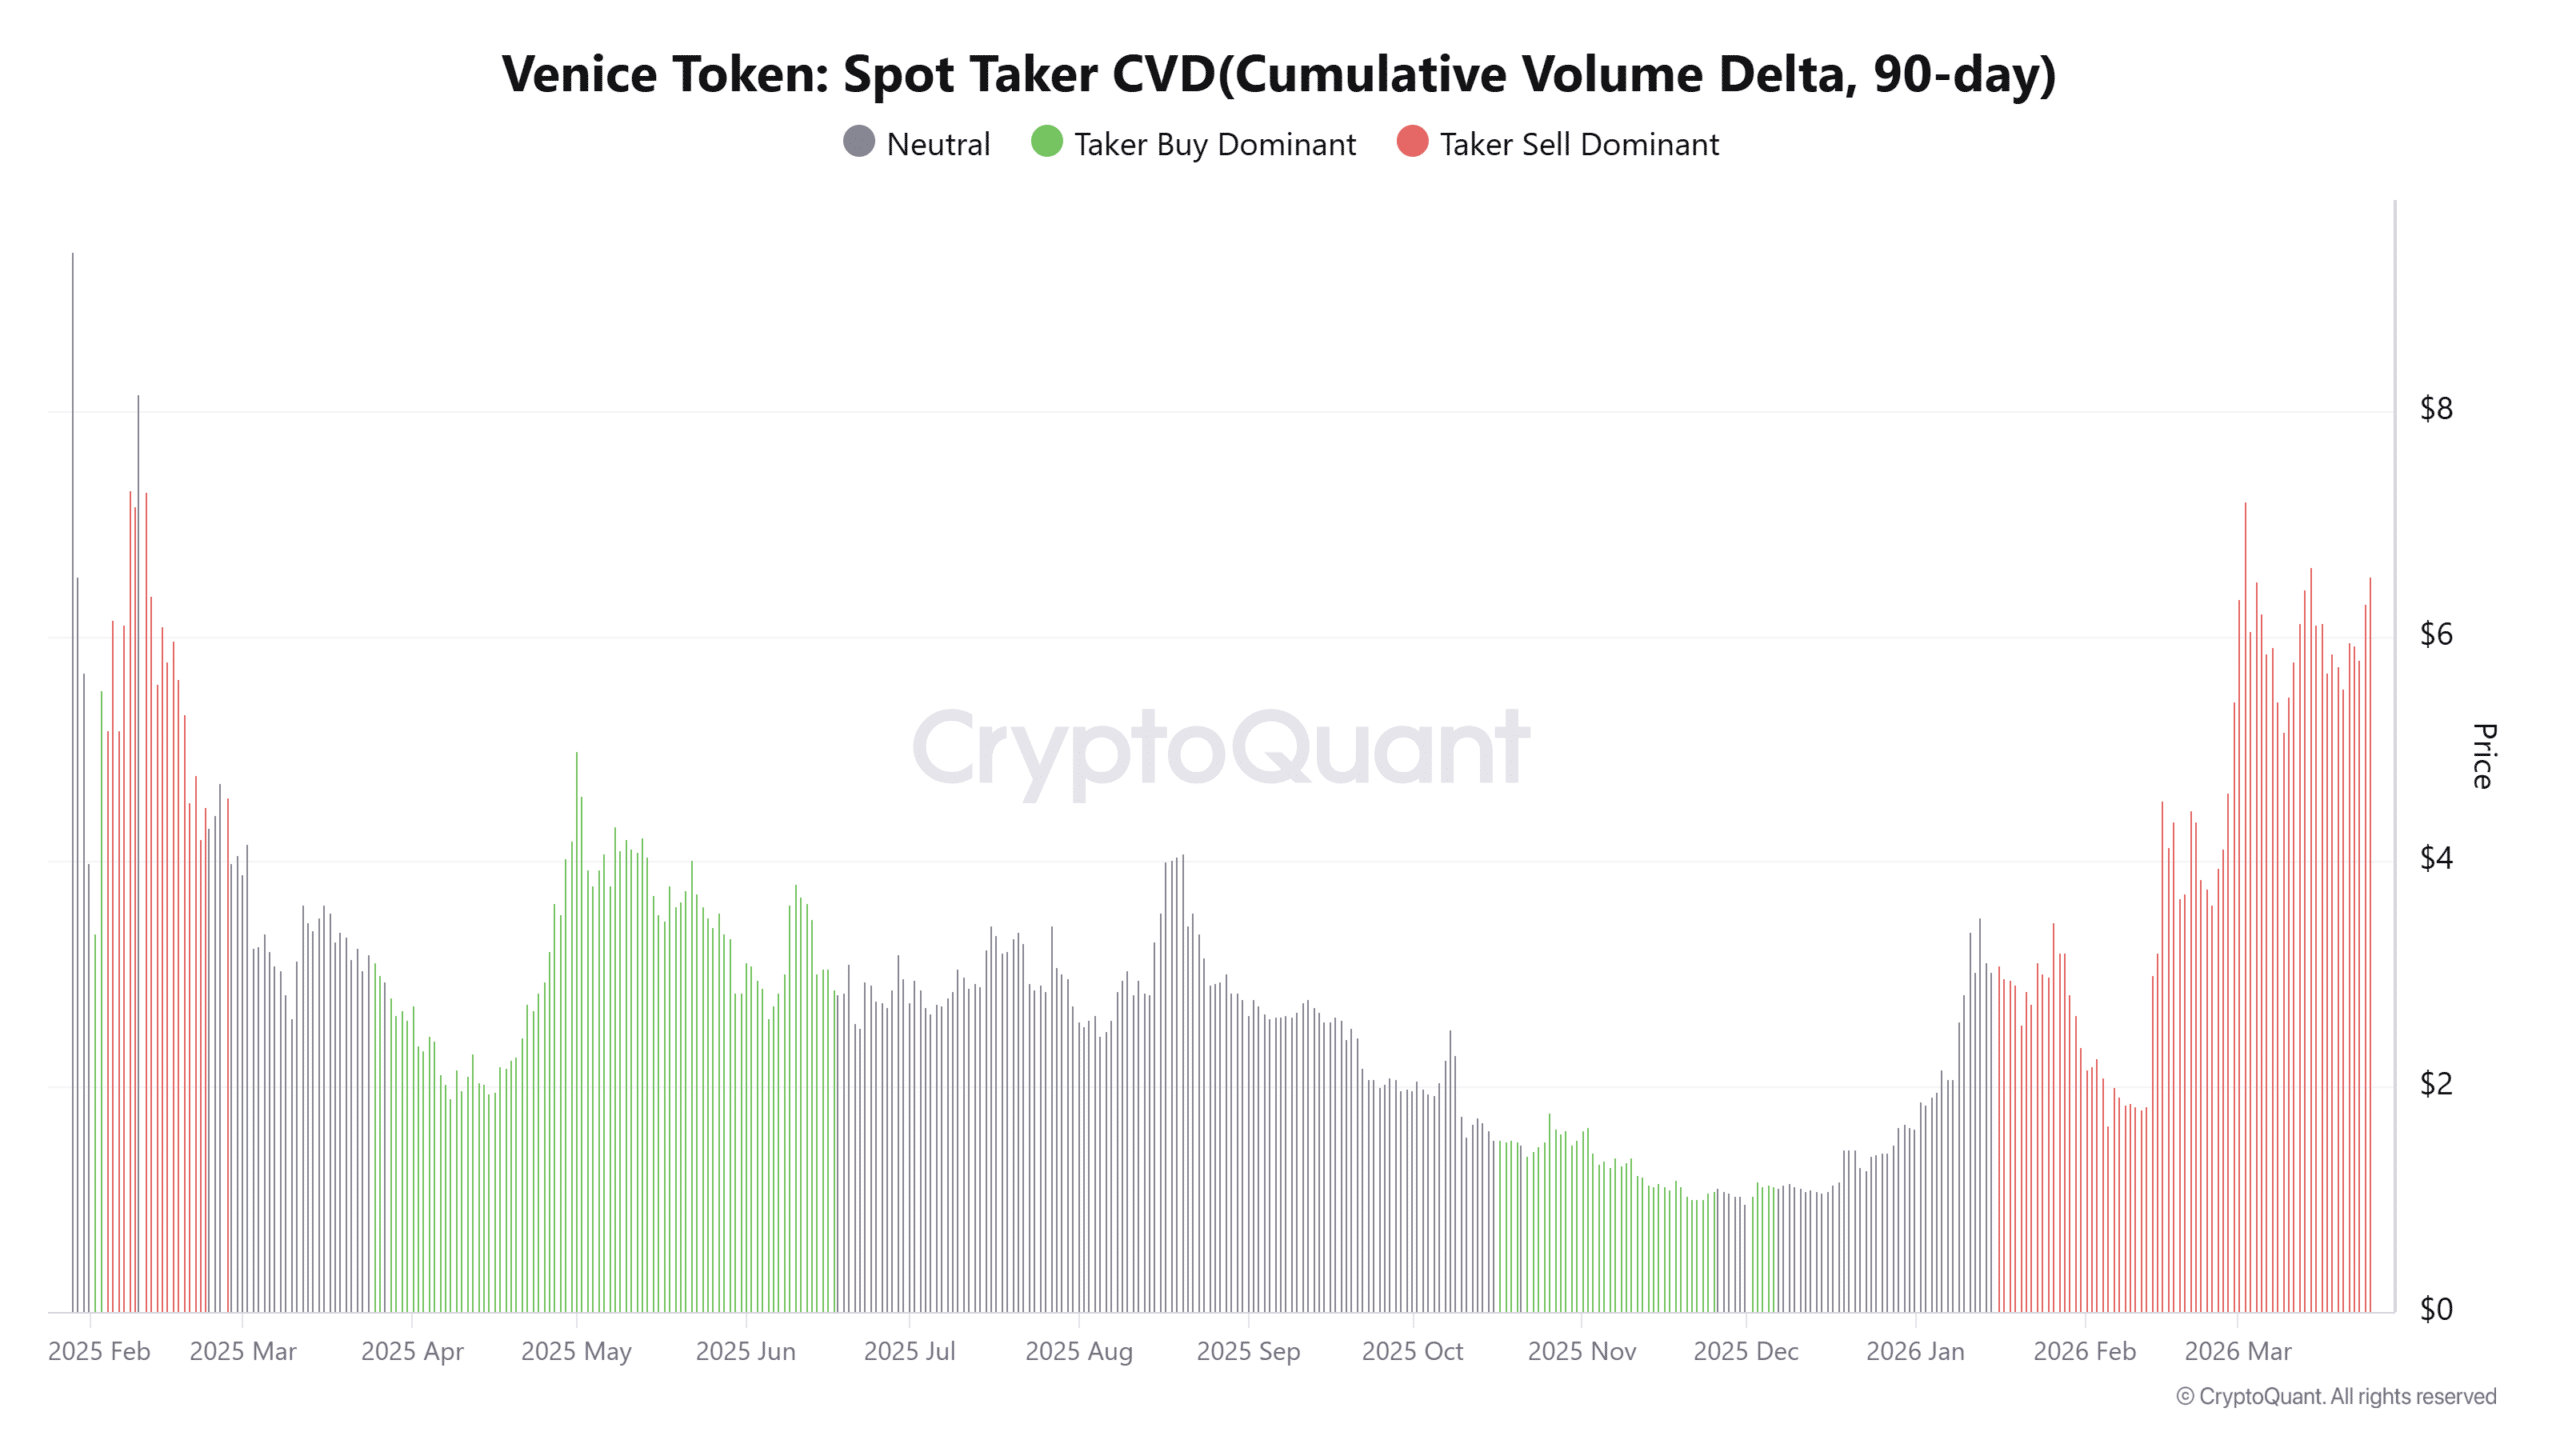
Расхождение CVD обнажает скрытое давление продаж
Spot Taker CVD остается доминирующим по продажам за последние 90 дней, выявляя устойчивые агрессивные продажи под ралли.
Эта структура указывает на то, что участники рынка продолжают выставлять ордера на продажу даже при росте цены.
Однако цена не снизилась, что предполагает, что более крупные покупатели, возможно, поглощают это предложение.
Это расхождение подчеркивает ключевой дисбаланс между видимыми продажами и скрытым спросом. В результате ралли зависит от continued поглощения для поддержания восходящего движения.
Если давление продаж усилится без соответствующего спроса, структура может ослабнуть. Однако, пока цена удерживается, это поглощение продолжает поддерживать текущий тренд.

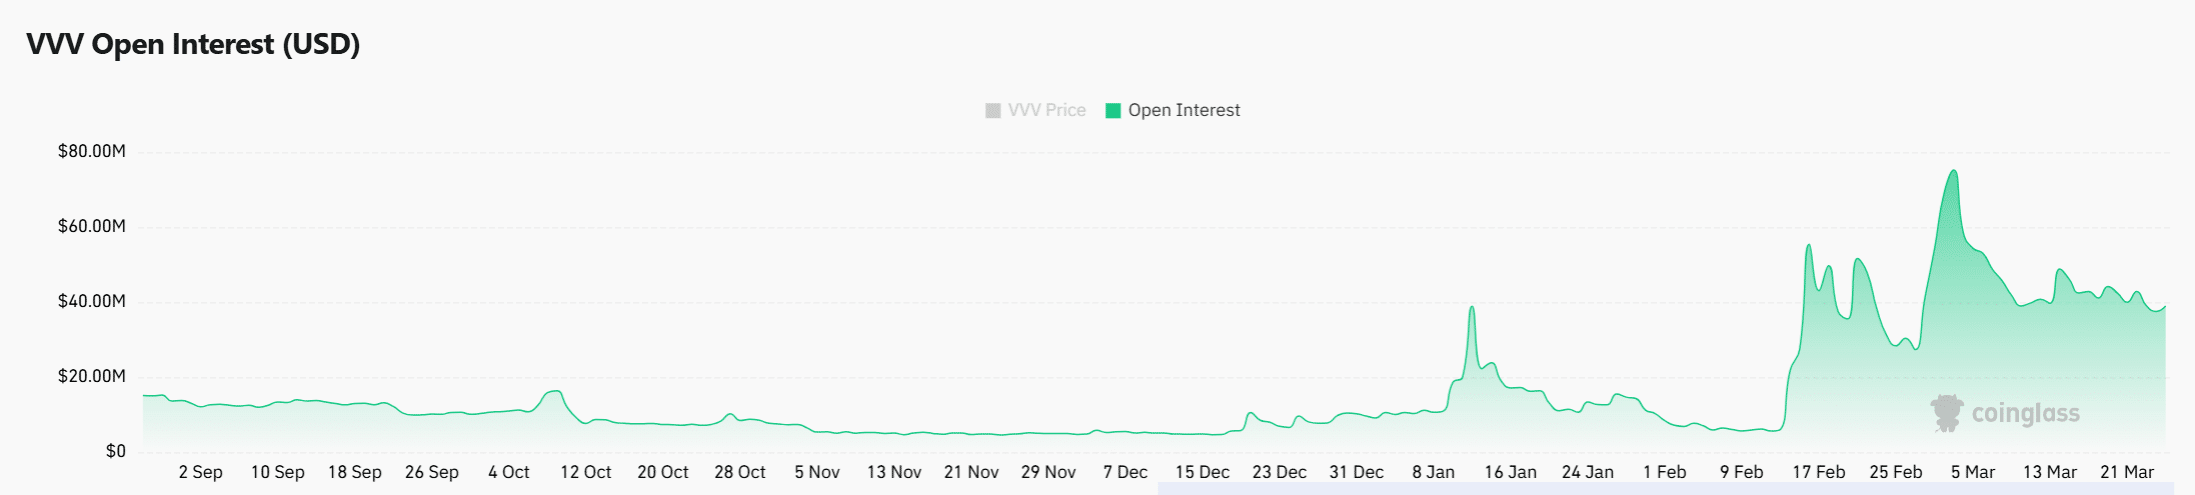
Рост открытого интереса показывает наращивание leverage на пробое VVV
Открытый интерес увеличился на 18,74% до $43,21 млн, что отражает растущее участие на рынках деривативов.
Этот рост показывает, что трейдеры агрессивно занимают позиции по мере пробоя цены из консолидации. Однако leveraged позиционирование вносит волатильность, особенно near зон сопротивления.
По мере наращивания позиций рынок становится чувствительным к быстрым движениям цены в любом направлении. Такая setup часто приводит к резким расширениям, once срабатывает ликвидность.
В то же время, рост открытого интереса без сильного подтверждения от других индикаторов увеличивает риск.
Если цена продолжит рост, эти позиции могут подпитывать продолжение, но любой разворот быстро развернет эти leveraged сделки.

VVV пробился вверх при сильной поддержке объема, что укрепляет его бычью структуру. Однако ослабляющиеся сигналы MACD и устойчивое давление продаж создают скрытое напряжение.
Ралли может продолжиться, если покупатели продолжат поглощать предложение и удержатся выше $5,14. Если эта поддержка не удержится, пробой, вероятно, быстро ослабнет под давлением.
Итоговое резюме
- VVV вырос на 14% до $6,40, подкрепленный скачком спотового объема на 26%. Пробой выше вымпела сместил структуру от консолидации к расширению.
- Открытый интерес вырос на 18%, сигнализируя об агрессивном leveraged позиционировании. Растущее leverage увеличивает риск резких движений, особенно near сопротивления