The Gold Buy-on-the-Dip Guide: Watch Interest Rates, Not Just War

marsbitОпубликовано 2026-06-12Обновлено 2026-06-12

Введение

"Gold Buying Guide: Focus on Interest Rates, Not Just War" Four months ago, gold buyers likely didn't anticipate buying at a peak that even a war couldn't sustain. After hitting a record high of $5,596 on January 29, gold entered a bear market just 91 days later, its fastest decline since 2008. A key trigger was the Fed's hawkish shift, highlighting that monetary policy, not geopolitics, is the primary driver. The article argues that the traditional "buy gold in turmoil" script has changed. While the US-Iran conflict initially boosted prices, the sustained rally in oil prices heightened inflation fears, forcing central banks to maintain or consider tighter policy. Since gold yields no interest, higher rates increase its opportunity cost, eroding its appeal. This dynamic was evident when gold fell sharply on May 18 despite positive peace talks, as lower oil prices eased inflation and thus rate hike pressures. The recent sell-off is also part of a broader market deleveraging. Correlations between gold, Nasdaq, and Bitcoin spiked as leveraged investors sold liquid assets to cover losses, creating a synchronized downturn. Historically, gold bottoms align with policy shifts, not conflict resolutions. The 2008 and 2022 bear markets ended with shifts to extreme easing and peak inflation expectations, respectively. For potential buyers, the author suggests monitoring three signals: 1) Peak interest rate hike expectations, 2) Reopening of the Strait of Hormuz (to ease oil/inflati...

Author: David, Chaoxiang Research

People rushing to buy gold four months ago probably didn't expect to buy at a peak that even a war couldn't rescue.

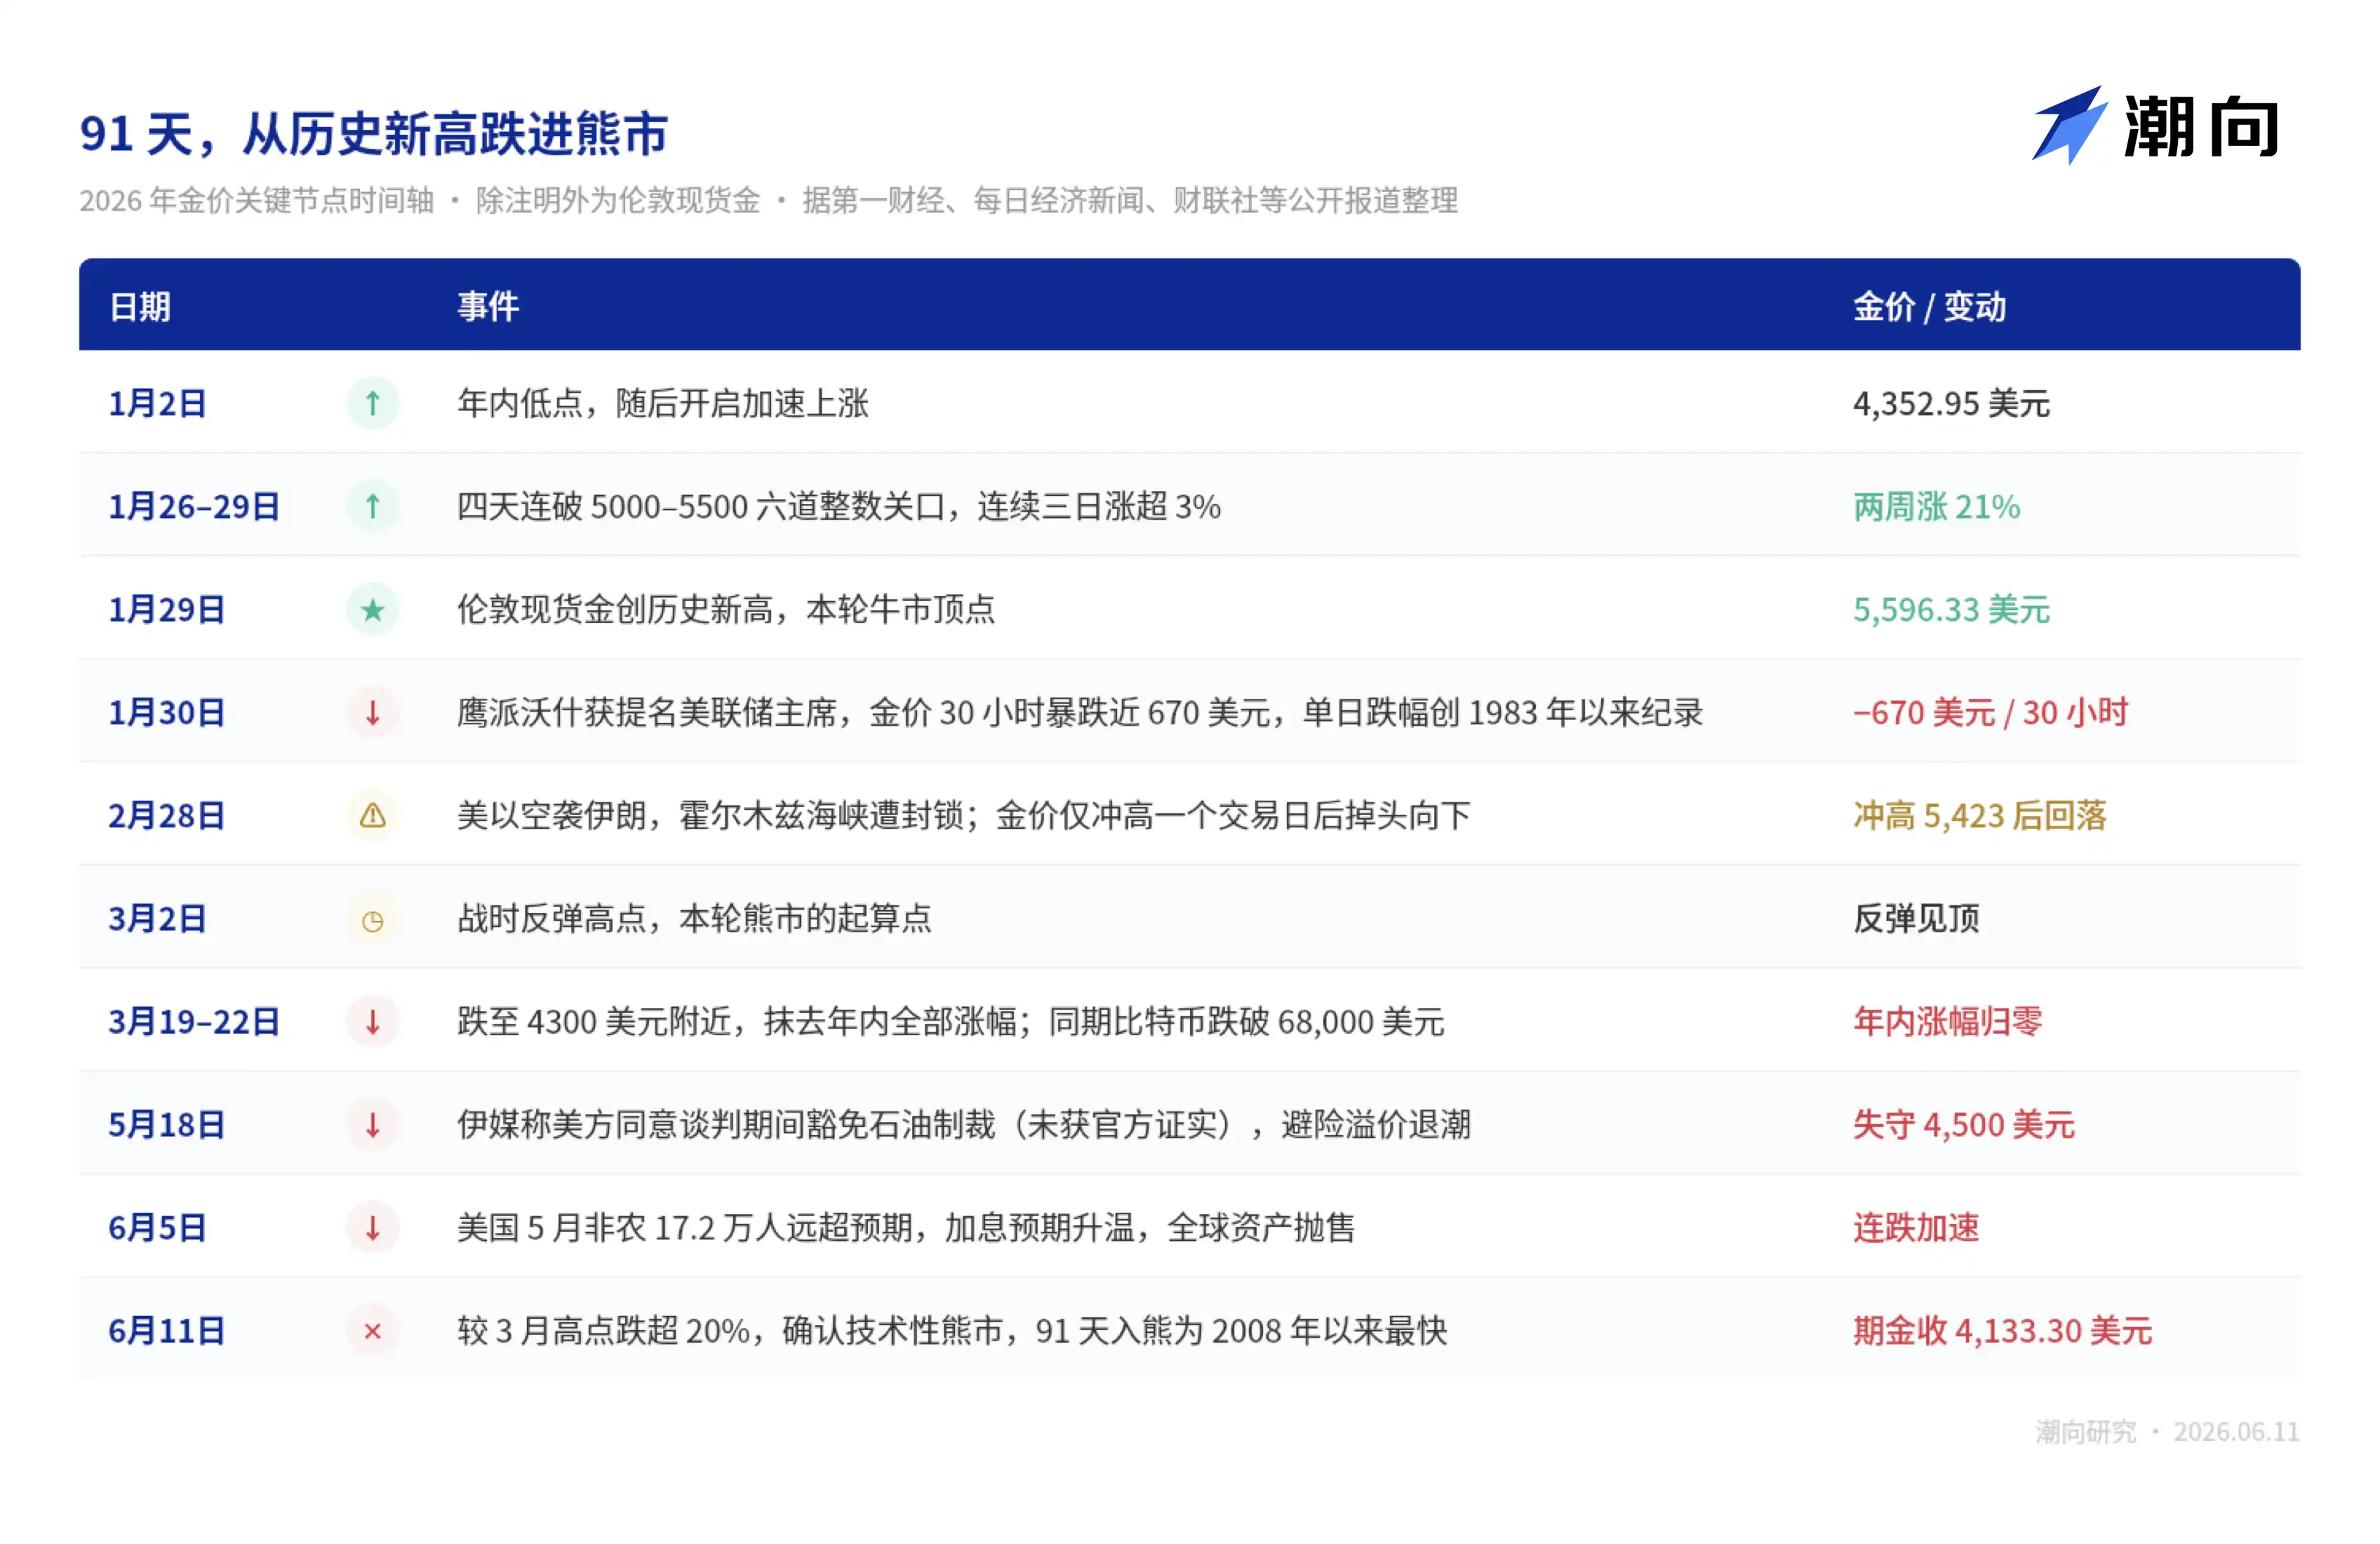
In the last week of January this year, gold was in the craziest phase of this bull run. From January 26th to 29th, spot gold broke through six round-number levels from 5000 to 5500 in four consecutive days, posting gains over 3% for three trading days in a row, which is extremely rare in gold trading history.

On January 29th, London spot gold touched $5,596.33, a historic high.

The peak came the next day. On January 30th, Trump nominated Kevin Warsh, with a hawkish background, as the next Fed Chairman. Gold prices plunged nearly $670 within 30 hours, setting a record for the largest single-day drop since 1983, while silver fell as much as 36% intraday.

Note the timing: this was a full month before the US-Iran war started.

The first hand pushing gold off the peak was monetary policy, a scenario that repeated in the following four months. The subsequent plot is familiar to everyone: war, blockade, rebound, slow decline... By June 11th, New York August gold futures settled at $4,133.30, down over 20% from the March high, officially confirming a technical bear market, entering bear territory just 91 days after the peak, the fastest such decline since 2008.
These days, opening investment chat groups reveals retail investors asking almost the same question: "The war is so intense, why is gold falling instead of rising?"

The author believes the question is reversed. The more pertinent question should be: why did the market rush to buy gold following the old script on the first day of the war, but a hundred days later, the same war became a reason to sell gold?

In the Grudge Match Between Gold and Interest Rates, War is Just the Messenger

Buy gold in turbulent times—the market initially followed this script.

On February 28th, the day the US and Israel launched airstrikes on Iran, spot gold surged from $5,296 to $5,423. However, this rally lasted only one trading day. The war didn't end quickly, the conflict stalemated, and the pricing chain for gold shifted accordingly.

The author believes the new chain works like this:

The Strait of Hormuz blockade kept oil and gas prices high. Rising energy costs pushed inflation expectations higher. Inflation forces central banks to tighten policy again. And since gold yields no interest, the higher interest rates go, the greater the opportunity cost of holding it.

Naeem Aslam, Chief Investment Officer at London-based independent financial research and investment consultancy Zaye Capital Markets, believes geopolitical tensions supporting oil prices mean high inflation is more persistent, making it difficult for the Fed to cut rates, with funds continuing to favor US Treasuries.

Whether this analysis holds water can be seen from the following data points.

First, the CME FedWatch Tool shows a 98.2% probability of no change at next week's FOMC meeting, with traders betting the next move is a December rate hike;

Second, before the war, the market expected the Fed to turn dovish later this year. The ECB is acting faster, with a 25 basis point hike on Thursday almost a market consensus, according to Refinitiv data.

Before the war, everyone was waiting for rate cuts; after the war, they're waiting for hikes. Thus, the foundation for gold bulls has been completely pulled out over these four months.

The counterexample in May best illustrates the point. On May 18th, Iranian media reported that the US agreed to exempt oil sanctions during negotiations, and crude oil fell accordingly. Following the safe-haven logic, with rising peace expectations, gold would at most decline slightly.
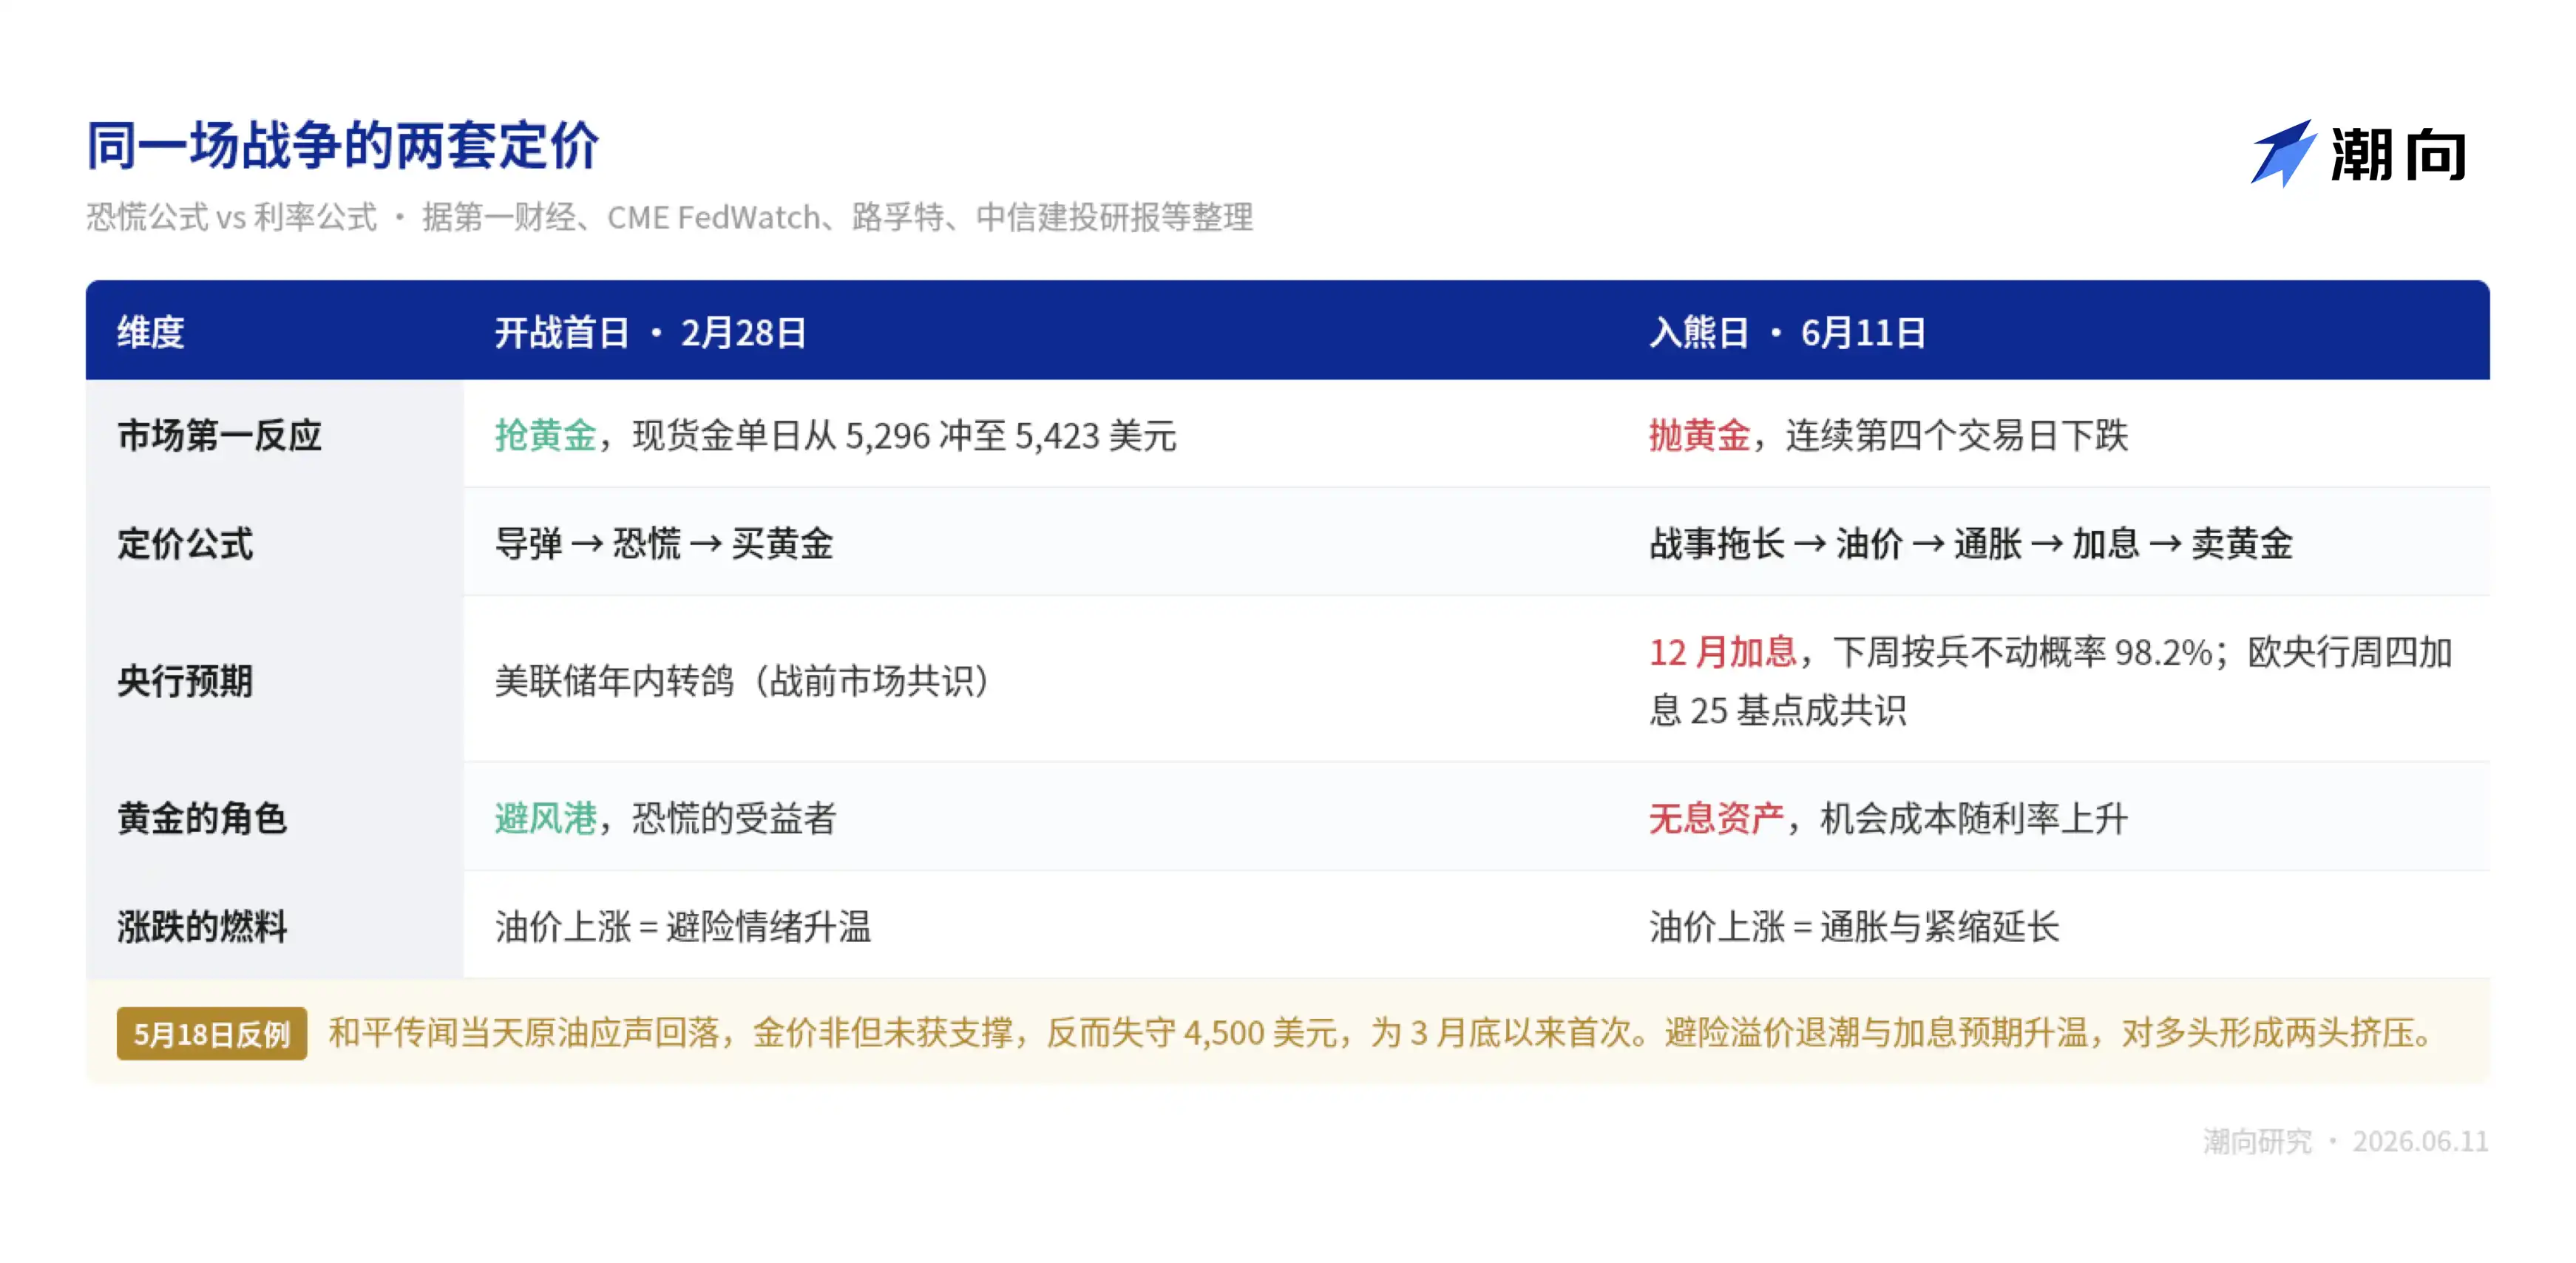
But the reality was, the gold price directly lost the $4,500 level that day, the first time since late March.

It falls on peace news because safe-haven premium recedes; it also falls on war news because rate hike expectations intensify. Bulls are trapped on both sides—this is the true nature of this gold bear market.

CITIC Securities gave an even more pointed judgment in a research report:

The essence of gold's surge in 2025 was liquidity pricing. After the US-Iran博弈 triggered inflation expectations, liquidity pricing receded accordingly, and gold must return to its own fundamentals.

In other words, those who bought gold last year profited from loose money, and are losing this year due to tightening money. The missiles in the war were merely messengers from start to finish.

However, if this were merely a grudge between gold and interest rates, the June decline list shouldn't be so long. Silver, Bitcoin, even the Nasdaq... all are taking hits in the same direction, and falling more and more like the same trade.

0.9 Correlation with Nasdaq, No One is Spared in a Deleveraging Market

First, consider a strange phenomenon.

During the over three months gold has been falling from its peak, the Nasdaq 100 Index kept rising, only peaking in early June. One was halfway down the bear market mountain, the other at the top of a bull market—originally on separate paths.

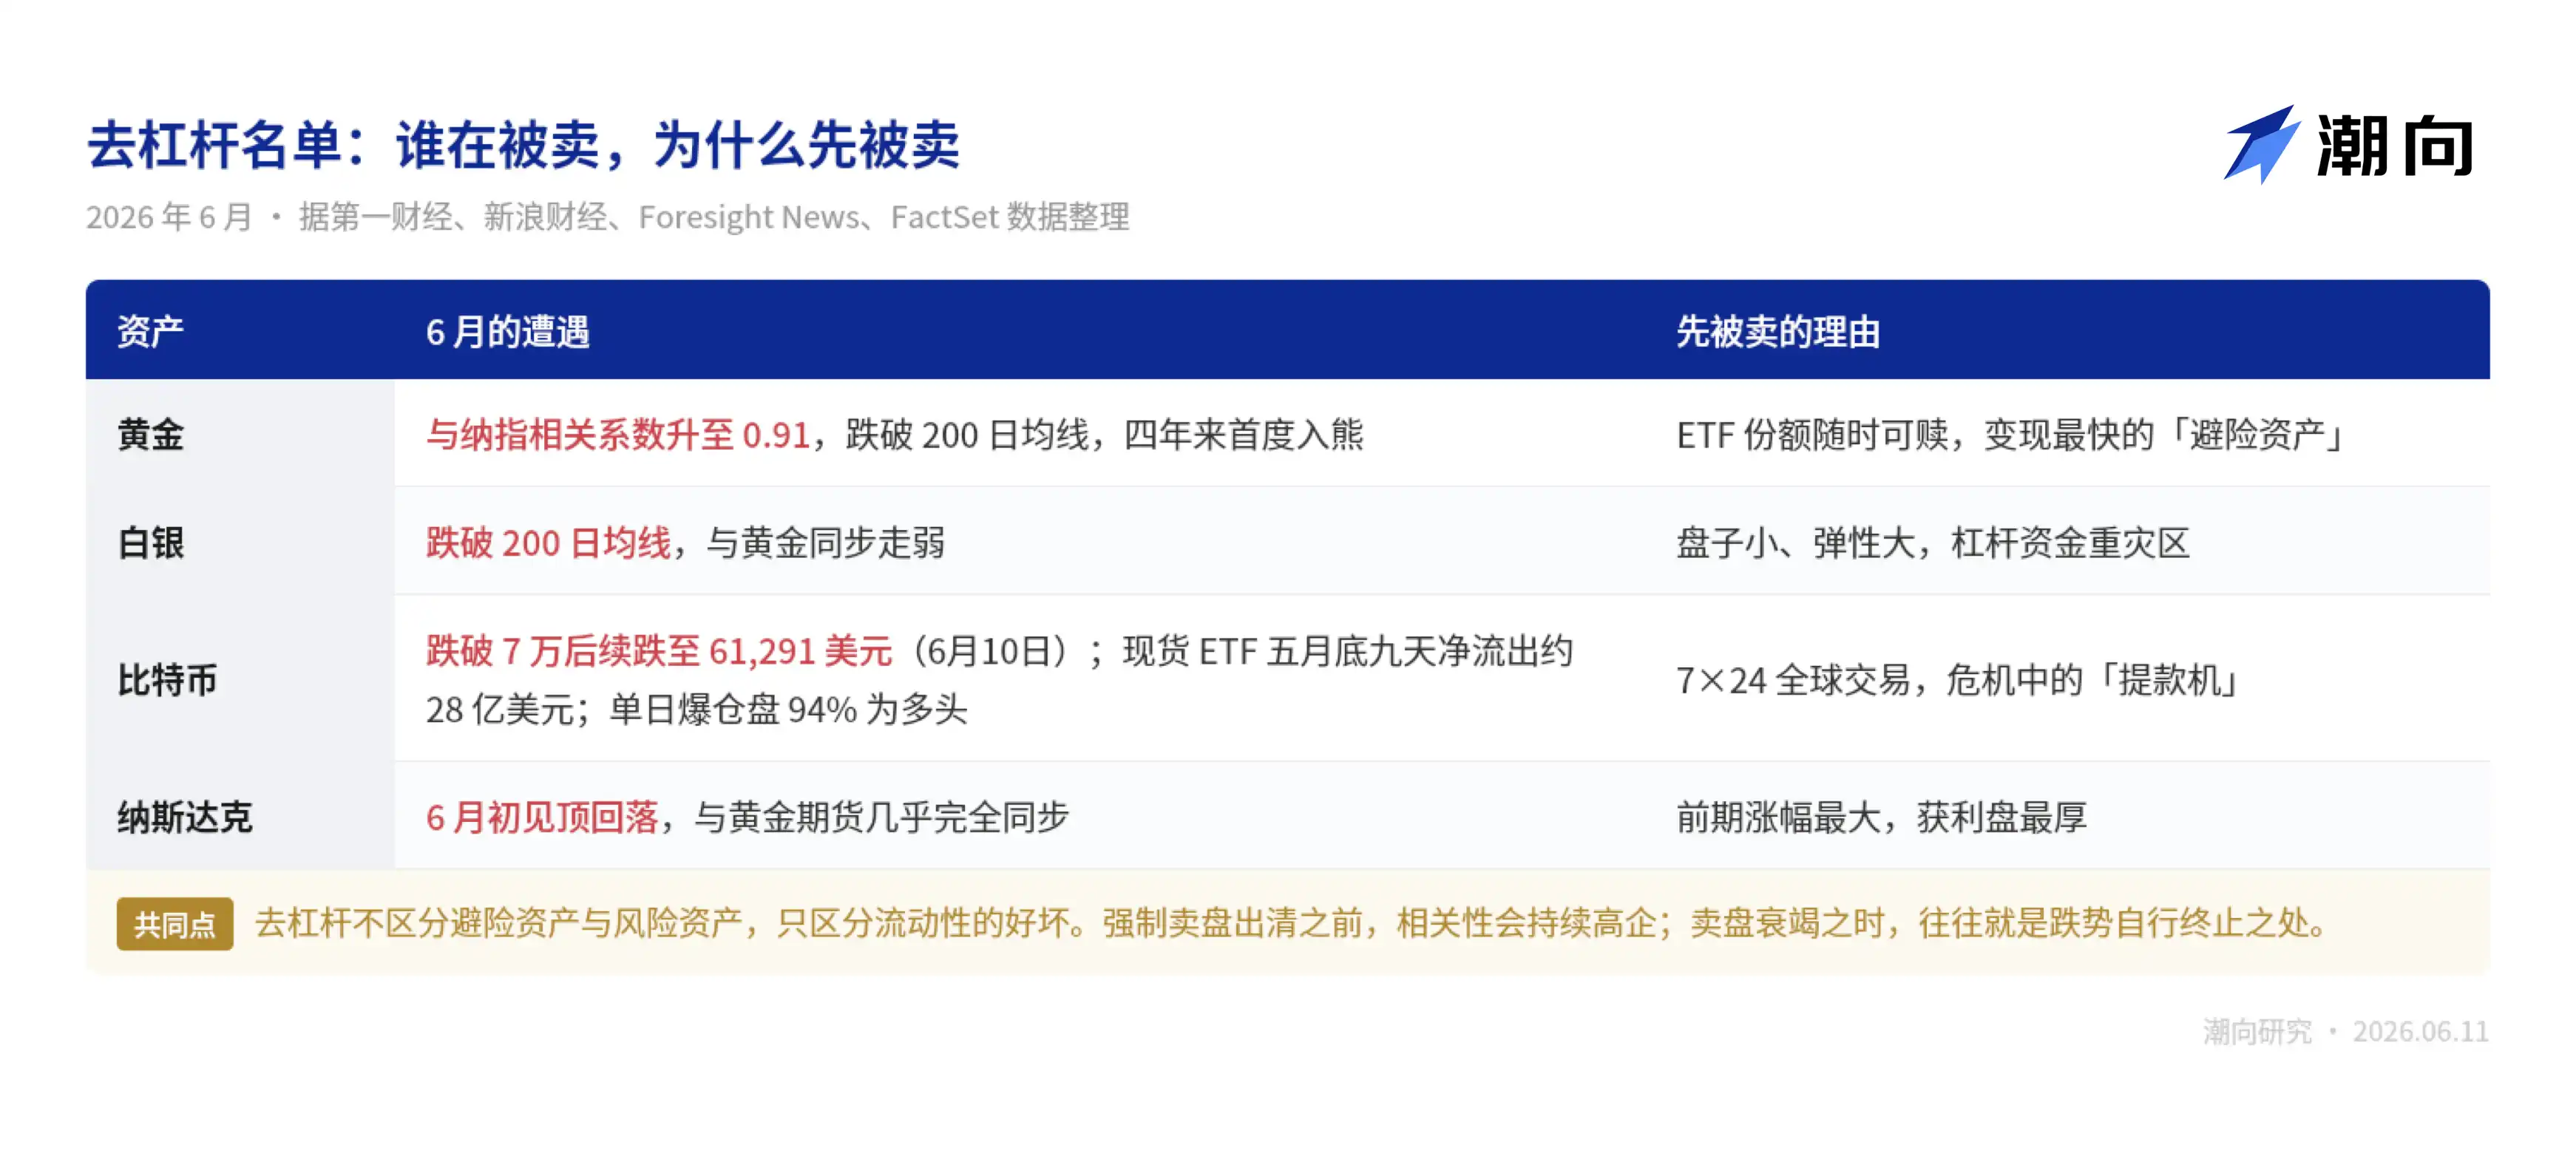
But according to a First Financial report, a managing partner at futures brokerage Altavest, based on FactSet data calculations, estimated that since around the Nasdaq peak in early June, the correlation coefficient between gold futures and the Nasdaq has reached 0.91, almost completely synchronized. His explanation: when investors seek liquidity, gold will move in sync with other risk assets in the short term.

What does this indicate?

This is classic whole-market deleveraging. Excessive positioning and high leverage earlier force investors to sell quality assets to meet margin calls on losing positions. In plain language, when you're short on cash, you sell not what you most want to sell, but what you can sell most easily.

The same story didn't spare "digital gold" Bitcoin either.

In early June, Bitcoin fell below $70,000, losing 12% in a single week. Spot ETFs saw net outflows of about $2.8 billion over nine consecutive days in late May, with 94% of single-day liquidated positions being long positions.

Bitcoin down 12% weekly, gold ETFs with continuous net outflows—their common reason for being hit isn't poor liquidity; on the contrary, it's because they are too easy to liquidate. When leveraged positions face margin calls, the first things sold are those that can be turned into cash the fastest.

Another more interesting detail. According to National Business Daily reports, the three biggest buyers pushing gold to its peak in January this year were the Polish central bank, Tether, and the world's largest gold ETF, SPDR, collectively hoarding nearly 1,780 tons over the past year.

A stablecoin company converting profits into gold bars, and four months later, standing guard alongside retail investors who chased the high in late January. The crypto and traditional worlds copying each other's homework, this time getting called to the principal's office together.

Deleveraging has one characteristic: it doesn't distinguish between good and bad assets, only between good and bad liquidity. So its ending also has nothing to do with fundamentals; once forced selling is exhausted, the decline stops on its own.

The question is, how to judge when the selling is exhausted? Historically, there are almost two identical scripts to copy.
The 2022 Script, This Time Only Four Months In

Gold bear markets are few, but each opening act is quite similar.

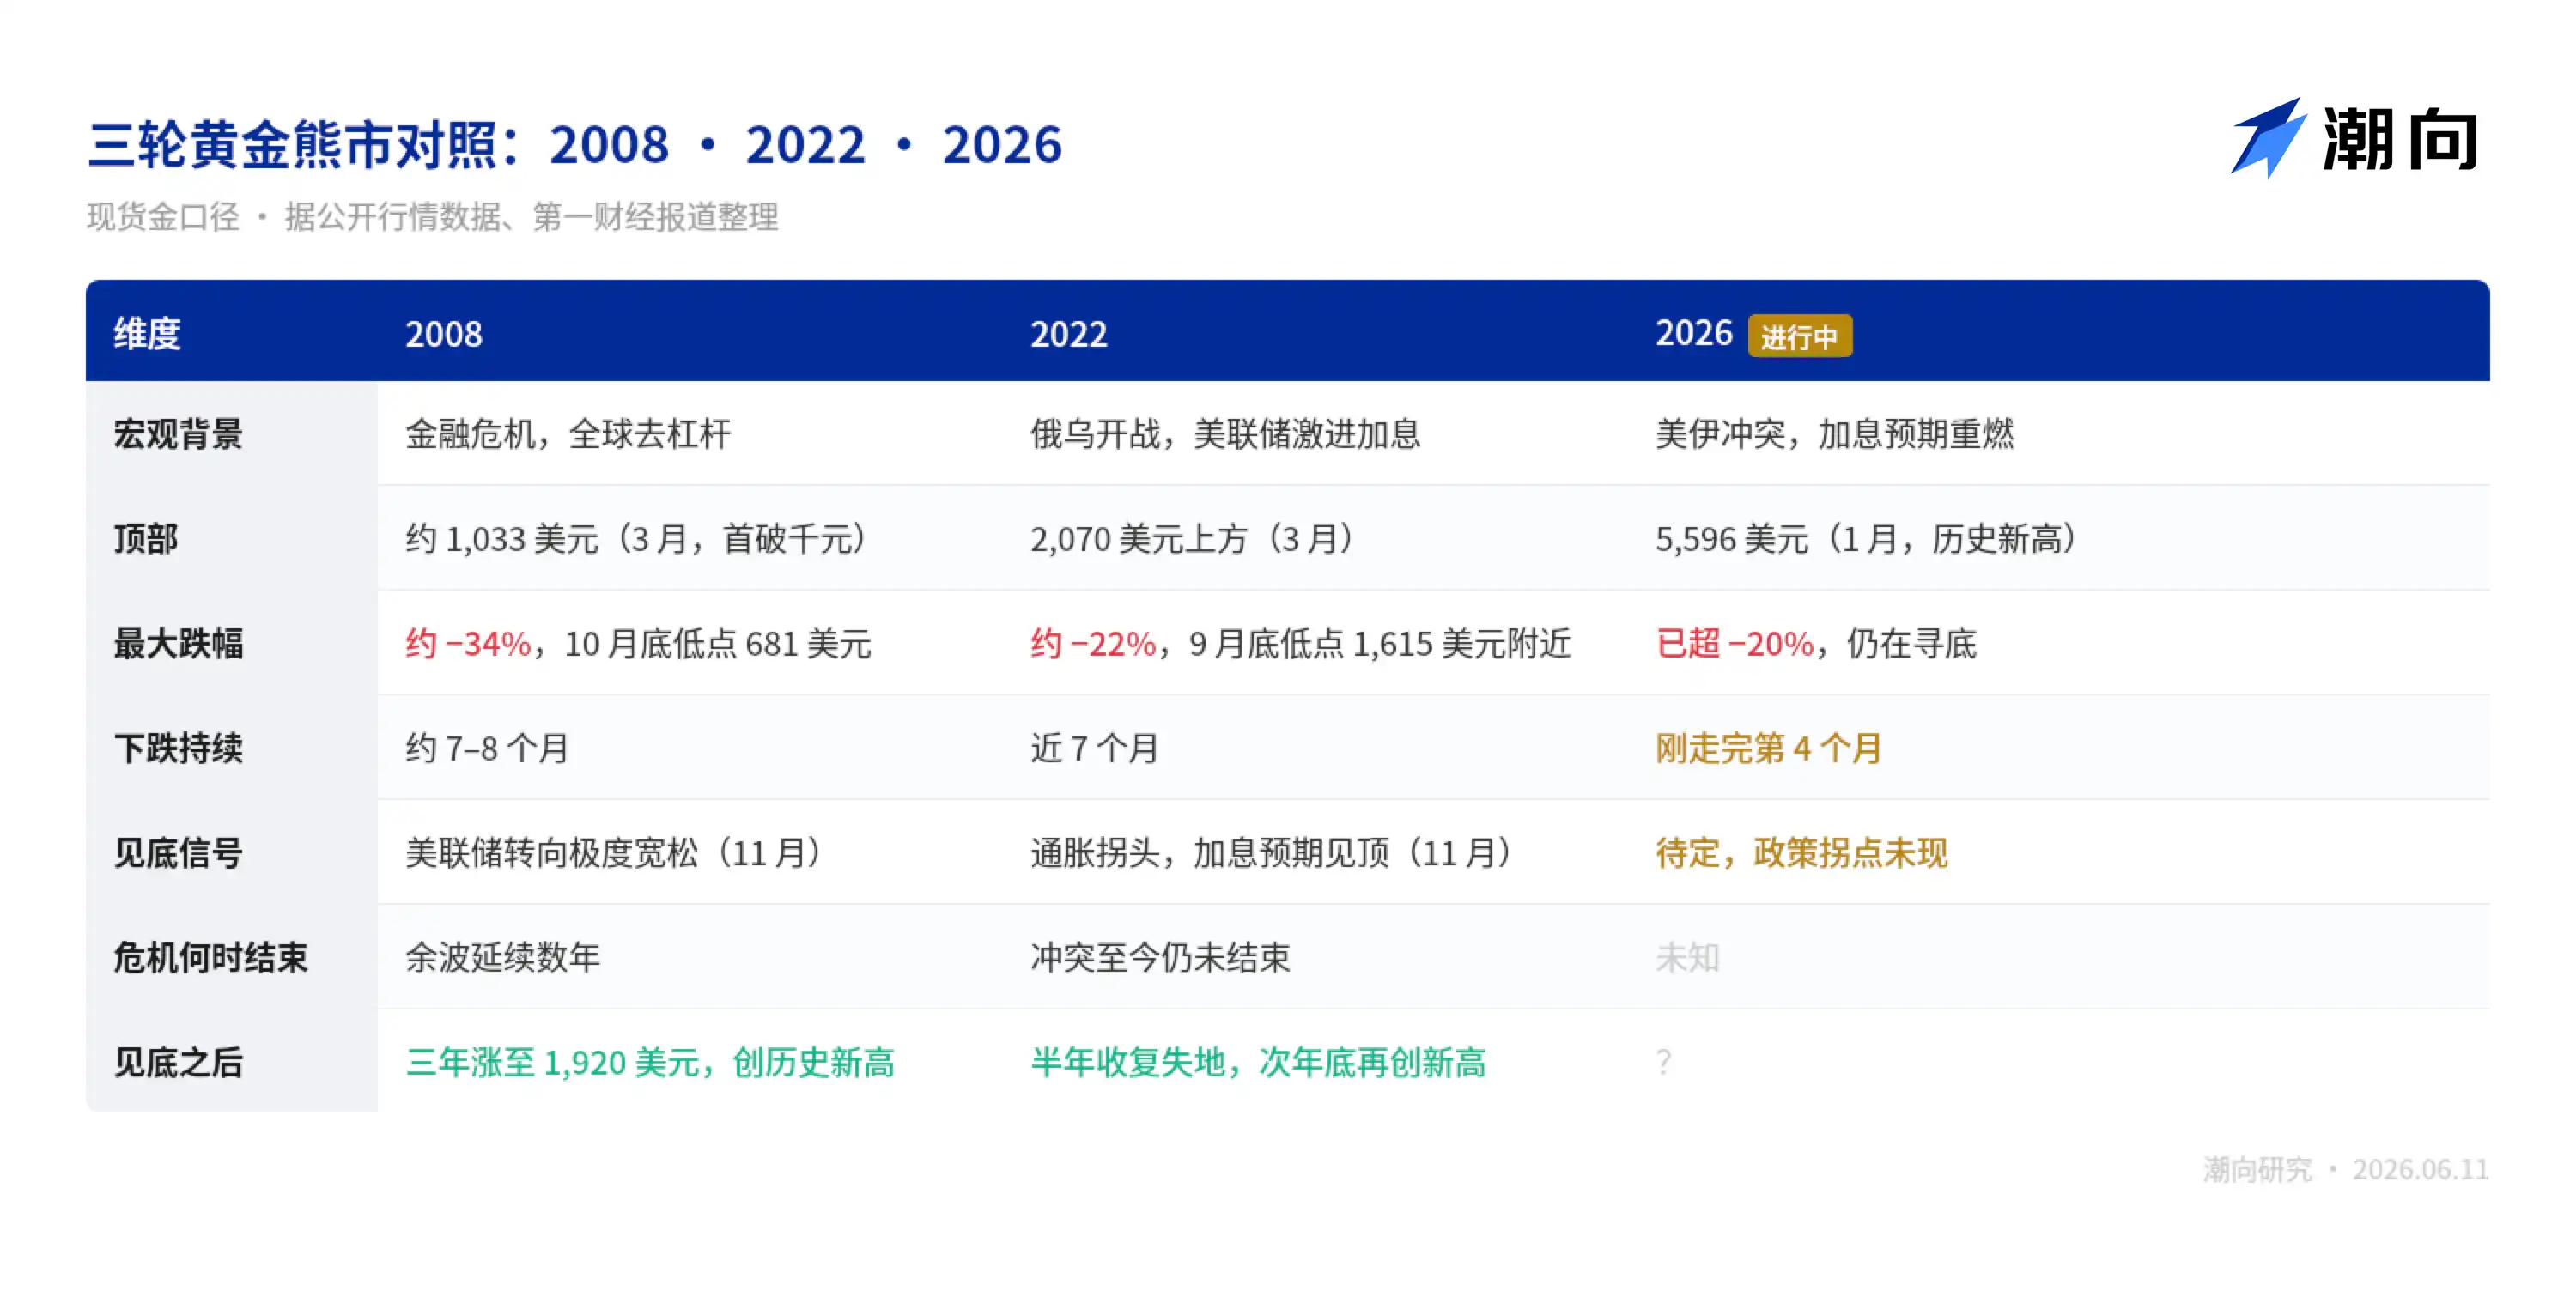
The first script is 2022. According to public market data, before the Russia-Ukraine war, spot gold started from around $1,800, surging above $2,070 after the war began. Subsequently, the Fed began aggressive rate hikes in March that year, gold prices turned and fell for nearly seven consecutive months, touching a low near $1,615 by late September, erasing all pre-war gains.

Gold prices bottomed in early November, recovered all losses within half a year, and thereafter, it was the bull run all the way to this January's peak.

War, plus tightening. Almost identical structure to now.

The second script is 2008. According to public market data, during the Lehman crisis, gold was also sold off alongside stocks, falling from its March peak when it first broke $1,000, to $681 by late October, a drop of over 30%. Subsequently, the Fed turned to extreme easing, gold bottomed in November, and rose to a historic high of $1,920 three years later.

The two scripts share a common point: The signal for gold's bottom has never been related to a ceasefire; it recognizes policy turning points.

The 2008 bottom appeared when the Fed turned to massive easing. The 2022 bottom appeared when inflation data peaked and rate hike expectations topped out. The most convincing counterexample is that the Russia-Ukraine conflict continues to this day, yet gold hit new all-time highs as early as late 2023.

Those waiting for a ceasefire to buy the dip might end up waiting and missing the boat.

Looking at timing in a rigid way, counting from the late January peak, this gold decline has only lasted four months. The 2022 decline lasted nearly seven months.

However, it's important to note that structurally, this round has a variable not present in 2022: central bank gold reserves.

The structural adjustment of various countries' foreign exchange reserves is key. The gold market's size is far smaller than the US Treasury market. Even slight portfolio shifts by major US Treasury holders have a relatively larger impact on gold prices. This round's buying floor from central banks is thicker than the last.
Buying the Dip Requires Waiting for Several Signals

With gold falling like this, voices calling to buy the dip are starting to appear. However, I think it's worth first clarifying two things:

First, how much deeper could it potentially fall; second, what should the turning point look like.

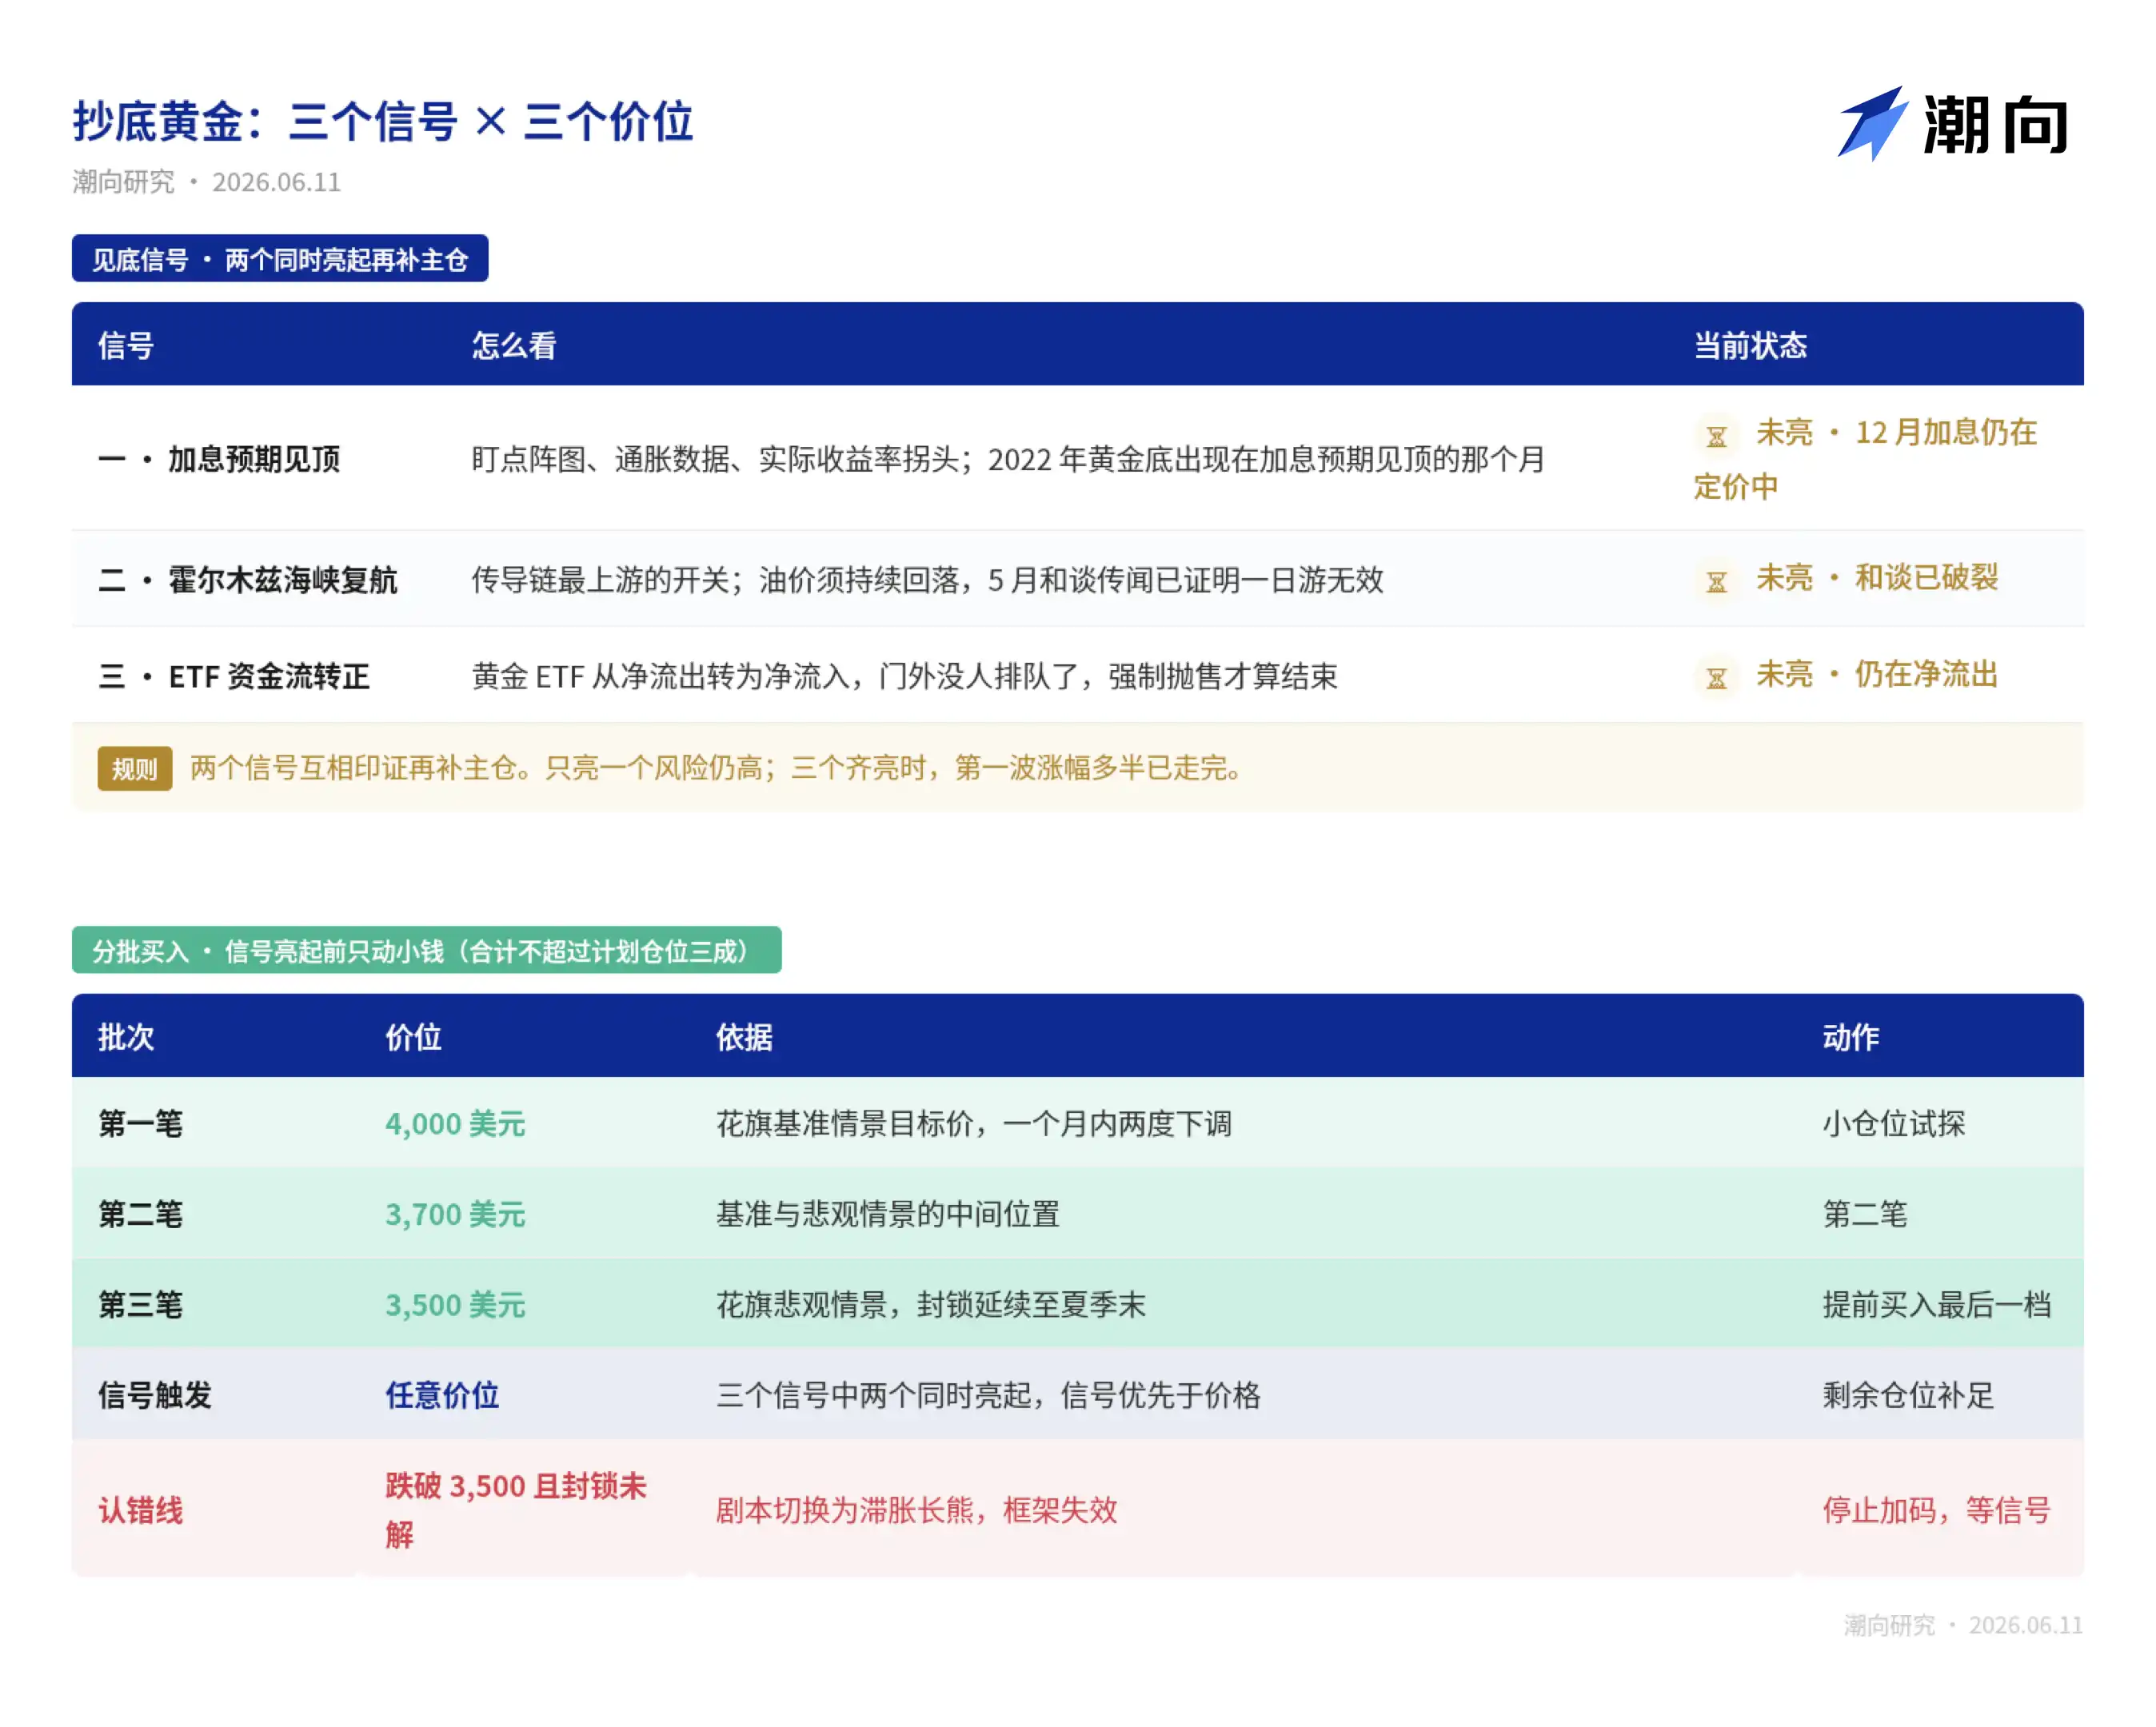
First, the depth. According to a First Financial report, Citigroup this week lowered its three-month gold price target from $4,300 to $4,000, and warned that if the Strait of Hormuz blockade persists into late summer, gold could fall to $3,500. This is already Citigroup's second revision within a month.

Investment bank targets aren't necessarily accurate, but they outline the lower limit of this decline in institutional eyes. From the current level down, the pessimistic scenario leaves about 15% more room.

Now, the turning point. I think there are only three signals worth watching:

  • Signal 1: Rate hike expectations peak.

As mentioned earlier, the engine of this bear market is interest rates. The 2022 gold bottom appeared precisely in the month when rate hike expectations peaked. If that year-end rate hike actually materializes, the event itself could be the reversal point.

Next week's Fed meeting, no change in rates is almost certain. What's truly worth watching is the dot plot and the tone of the press conference—they determine whether the year-end hike is an endpoint or a starting point.

  • Signal 2: Strait of Hormuz reopens.

It's the most upstream switch in the entire transmission chain. The strait opens, oil prices can fall; oil prices fall, inflation can ease; inflation eases, rate hike expectations recede. But note the May peace rumor already proved that ceasefire news alone isn't enough; oil prices need to fall sustainably, otherwise the chain doesn't transmit fully.

  • Signal 3: ETF fund flows turn from net outflows to net inflows.

As described earlier, the direct executors of this decline are leveraged positions and ETF redemptions; gold ETFs are the fastest escape hatch. When no one is queuing outside the door, forced selling ends.
Signals discussed. Below are the author's own thoughts, not necessarily correct, for reference.

No one can precisely predict the bottom. The earlier logic is that this bear market's engine is rate hike expectations, and the market currently prices in one 25 basis point hike by year-end.

From $5,596 to the current $4,130, gold has already fallen nearly 26%, digesting most of the shift from "no hikes" to "one hike." If rate hike expectations don't worsen further, the downside space is narrowing.

Several public references can help anchor the range:

Citigroup's base and pessimistic scenarios point to $4,000 and $3,500 respectively; the 2008 bear market saw a 34% gold drop, mapping to around $3,700 here; the 2022 decline was 22%, corresponding to $4,365, a level already breached.

The author's own approach is to divide into three tranches within this range: first tranche at $4,000, second at $3,700, third at $3,500, totaling no more than 30% of the planned position, each tranche prepared to potentially be held at a loss (not investment advice, personal opinion only).

Dividing into three tranches isn't because the bottom is calculated, precisely because it can't be calculated, using dispersion to hedge the cost of judgment error.

Whenever two of the above three signals light up simultaneously, allocate the remaining position fully. By then, the price will likely have already moved off the lowest point, but trading a small portion of gains for certainty is the most cost-effective part of the entire approach. However, if $3,500 is breached and the Strait blockade isn't lifted, stop adding to early purchases and simply wait for signals.

Finally, buying gold in turbulent times isn't wrong; but watching interest rates is more useful than watching war.

Disclosure: The author holds gold.

The views expressed in this article are solely those of the author and do not constitute any investment advice. Price levels, signal frameworks, and position strategies mentioned are personal analysis records and should not be used as trading basis.

Markets involve risks; make decisions independently.

Data Sources: First Financial · National Business Daily · Lanjinger News · Cailian Press · Sina Finance · CME FedWatch · Refinitiv (LSEG) · FactSet · Citigroup Research Report · CITIC Securities Research Report · Yahoo Finance Market Data

Chaoxiang Research · June 2026

Трендовые криптовалюты

Связанные с этим вопросы

QAccording to the article, what is the primary factor driving the current bear market in gold, rather than geopolitical conflict?

AThe primary factor driving the gold bear market is monetary policy and interest rate expectations. The article argues that rising interest rates increase the opportunity cost of holding non-yielding gold, and that market expectations have shifted from anticipating rate cuts pre-conflict to pricing in future rate hikes post-conflict, which undermines gold's foundation.

QWhat event in late January 2026 initially triggered the sharp reversal in gold prices from their all-time high?

AThe sharp reversal was triggered on January 30, 2026, when former U.S. President Trump nominated Kevin Warsh, known for his hawkish stance, as the next Federal Reserve Chair. This news caused the gold price to plunge nearly $670 within 30 hours, marking a record single-day drop since 1983.

QThe article mentions that gold's correlation with the Nasdaq 100 reached an extremely high level recently. What does this high correlation indicate about the market environment?

AThe near-perfect correlation (0.91) between gold futures and the Nasdaq 100 index indicates a market-wide deleveraging event. Investors facing margin calls are forced to sell their most liquid assets—including gold and tech stocks—to raise cash, regardless of the assets' fundamental qualities.

QBased on historical precedents from 2008 and 2022 cited in the article, what has consistently signaled a bottom for gold prices?

AHistorically, the bottom for gold prices has been signaled by a policy拐点 (inflection point), not by the end of geopolitical conflicts. In 2008, the bottom came with the Fed's shift to extreme monetary easing. In 2022, the bottom coincided with peak inflation and peak interest rate hike expectations.

QWhat are the three key signals the author suggests watching to identify a potential turning point for gold?

AThe three key signals are: 1) Peak interest rate hike expectations (when the market stops pricing in further rate increases). 2) The reopening of the Strait of Hormuz, which would lower oil prices and inflation pressures. 3) A reversal in Gold ETF fund flows from net outflows to net inflows, indicating the end of forced selling.

Похожее

После трёх кварталов падения: получится ли у крипторынка стабилизироваться в третьем квартале?

Криптовалютный рынок пережил худший квартал с 2022 года, общая капитализация упала на 12,6% до $2,1 трлн, а дневные объемы торгов снизились на 20,9%. Впервые за три года сократилась и капитализация стейблкоинов. Основные факторы спада — отток средств из биткоин-ETF, распродажа биткоинов корпоративным казначейством Strategy и ужесточение монетарной политики ФРС. Второй квартал завершился чистым оттоком $46,7 млрд из ETF, при этом в июне отток достиг рекордных $45 млрд. Ключевым событием третьего квартала станет заседание ФРС 28–29 июля. Мягкий сигнал может поддержать биткоин в диапазоне $68 000–84 000 и вернуть приток в ETF, тогда как жесткая риторика способна сместить торговый диапазон к $50 000–56 000. Законодательная неопределенность также давит на рынок: прогресс по закону CLARITY Act, определяющему регуляторные границы, замедлился, и вероятность его принятия в 2026 году упала до 40–45%. Несмотря на общий спад, два сегмента показали рост: объемы на рынках предсказаний выросли на 48,7%, а торговля токенизированными коллекционными предметами увеличилась на 143%. Сектор RWA продолжает стабильно развиваться, достигнув $28,1 млрд. Рынок, вероятно, миновал фазу острой распродажи, но для устойчивого восстановления необходимы ясность от ФРС и регуляторный прогресс.

marsbit1 ч. назад

После трёх кварталов падения: получится ли у крипторынка стабилизироваться в третьем квартале?

marsbit1 ч. назад

BIT Торговые часы: BTC по-прежнему под давлением 200 EMA на недельном графике, после отскока возможен перезапуск нисходящего движения; секторы хранения данных и полупроводников, выросшие ночью, начали падение в вечерней сессии

**Краткий обзор рынка: BTC под давлением, коррекция на рынке акций, внимание к данным и событиям** Рынок криптовалют демонстрирует осторожное восстановление. Bitcoin торгуется около $66 000, сталкиваясь со значительным сопротивлением в районе $68 000, где сосредоточены объемные "застрявшие" позиции. Ключевые технические уровни — 200-недельная скользящая средняя (~$63 333) и 200-недельная EMA (~$68 328). Аналитики отмечают низкую ликвидность, характерную для летнего периода. На фондовом рынке после сильного роста во вторник наблюдается коррекция. Фьючерсы на основные индексы США снижаются. Акции полупроводниковой и памяти, которые резко выросли накануне, падают в ночных торгах. Исключением стал SMCI, который вырос более чем на 15% после оптимистичного прогноза. На общий настрой негативно влияют рост цен на нефть (более $91 за баррель Brent) и доходности государственных облигаций США (10-летние — около 4,64%), что возрождает инфляционные опасения. Азиатские рынки показали нестабильную динамику. Индекс KOSPI в Корее вырос на 0,74%, а японский Nikkei 225 снизился на 0,18%. Основной риск для региона — ослабление японской иены до минимумов с 1986 года, что повышает вероятность вмешательства властей. **Ключевые события для наблюдения:** * **24 июля:** Финансовые отчеты Alphabet (Google), Tesla, IBM. Событие AMD, посвященное ИИ. * **25 июля:** Решение по процентной ставке ЕЦБ и пресс-конференция Кристин Лагард. Финансовые отчеты Intel, American Airlines, Honeywell и других. Данные по числу первичных заявок на пособие по безработице в США.

marsbit1 ч. назад

BIT Торговые часы: BTC по-прежнему под давлением 200 EMA на недельном графике, после отскока возможен перезапуск нисходящего движения; секторы хранения данных и полупроводников, выросшие ночью, начали падение в вечерней сессии

marsbit1 ч. назад

Бывший глава CFTC и президент Circle Тарберт: призывает к долгосрочной стратегии, но сам выводит $30 млн

Бывший председатель CFTC и президент Circle Хит Тарберт, публично пропагандируя долгосрочное видение компании для инвесторов на фоне падения акций на 70% с пиковых значений, сам активно распродавал свои акции CRCL. С момента IPO Circle он по плану 10b5-1 продал более 360 тысяч акций, выручив около 30 миллионов долларов, и при этом ни разу не докупал акции на открытом рынке. Эта разница между его публичными заявлениями и личными действиями вызвала критику. Карьера Тарберта демонстрирует классическое использование «вращающейся двери» между регулирующими органами и частным сектором. Уйдя с поста председателя CFTC в 2021 году, через 27 дней он занял должность главного юрисконсульта в маркет-мейкере Citadel Securities, который в тот момент находился под пристальным вниманием из-за скандала с акциями GameStop. Позже, уже работая в Citadel, Тарберт выступал за расширение полномочий CFTC на крипторынок, в то время как его работодатель планировал выход на этот рынок. В 2023 году Тарберт присоединился к Circle, где его опыт и связи сыграли ключевую роль в успешном проведении IPO компании в 2025 году. Однако его последующие массовые продажи акций, совпавшие с падением котировок и его же призывами к долгосрочным инвестициям, ставят под сомнение искренность его уверенности в будущем компании. Критики видят в его карьере образец превращения регуляторного опыта и политических связей в личную выгоду, в то время как риски несут обычные инвесторы, верящие его нарративам.

marsbit2 ч. назад

Бывший глава CFTC и президент Circle Тарберт: призывает к долгосрочной стратегии, но сам выводит $30 млн

marsbit2 ч. назад

Gate Research: Взлет «уолл-стритизации» криптофинансовых продуктов — это конкуренция или интеграция?

**Аналитический обзор Gate Research Institute: Волна "уолл-стритизации" криптофинансовых продуктов — конкуренция или интеграция?** Создание биткоина в 2009 году было ответом на финансовый кризис и стремлением построить децентрализованную систему без доверенных посредников. Однако к 2026 году значительная часть биткоинов (около 7,14%) хранится через ETF таких гигантов, как BlackRock. Это символизирует глубокую интеграцию традиционных финансов (TradFi) и крипторынка. С появлением биткоин-ETF, фьючерсов, RWA (токенизированных реальных активов) и государственных облигаций на блокчейне, традиционные институты получают всё больше влияния на выпуск, ценообразование, кастодию и дистрибуцию криптоактивов. Однако это не одностороннее поглощение, а взаимодополняющая конвергенция. Криптосфера приносит TradFi глобальную 24/7 ликвидность и программируемость, а TradFi предоставляет криптосфере регулируемые каналы, институциональное доверие и массовый доступ. Яркий пример — две противоположные, но ведущие к одной цели траектории: * **Путь А:** Криптобиржи, такие как Gate, начинают с токенизированных акций и CFD, а затем напрямую подключаются к инфраструктуре традиционных брокеров, предлагая реальную торговлю акциями США, Гонконга и Кореи за стейблкоины. * **Путь Б:** Традиционные брокеры, такие как Robinhood, интегрируют криптоактивы, а затем создают собственные Layer 2 для токенизации своих акций, стремясь к круглосуточной торговле. Обе стратегии нацелены на создание **универсального финансового аккаунта будущего** — единой точки доступа к акциям, криптовалютам, ETF, токенизированным облигациям и другим активам. Ключевой конкурентной борьбой становится не между CEX и брокерами, а между этими "супераккаунтами". Параллельно, слой RWA и токенизированных гособлигаций растёт даже на медвежьем рынке, становясь "прослойкой" для объединения капиталов. Хотя этот рынок (около $150 млрд токенизированных казначейских облигаций) ещё мал по сравнению с традиционным ($30 трлн), он демонстрирует устойчивый структурный тренд, привлекающий крупнейшие финансовые институты (JPMorgan, DTCC и др.). **Вывод:** "Уолл-стритизация" — это не поражение идеалов децентрализации, а формирование новой гибридной модели. Децентрализованные протоколы продолжают работать на базовом уровне, в то время как на уровне приложений и пользовательского опыта формируется более эффективный, глобальный и свободный объединённый рынок капитала, где активы TradFi и DeFi торгуются бок о бок в одном интерфейсе. Уолл-стрит не завоевала криптосферу, а криптосфера не обошла Уолл-стрит — они совместно строят новые финансовые рельсы.

marsbit2 ч. назад

Gate Research: Взлет «уолл-стритизации» криптофинансовых продуктов — это конкуренция или интеграция?

marsbit2 ч. назад

S&P Dow Jones и Pantera выпускают криптоиндекс, биткоин оставлен за бортом из-за «отсутствия прибыли»

Стандард энд Пурс (S&P Dow Jones Indices) совместно с Pantera Capital запускает индекс S&P Pantera Digital Asset Index. Новый индекс включает 18 токенов, но исключает биткоин, XRP и мем-токены. Критерием отбора послужила «финансовая жизнеспособность», по аналогии с S&P 500: протокол должен демонстрировать положительный доход в течение нескольких кварталов и распределять стоимость среди держателей токенов. Это первое применение фундаментального подхода к оценке криптоактивов со стороны крупнейшего в мире провайдера индексов. В первую пятерку активов вошли Ethereum (ETH), BNB, Solana (SOL), TRON (TRX) и Hyperliquid (HYPE). Pantera отмечает, что совокупный годовой доход всех протоколов индекса превышает $30 млрд. Биткоин был исключен по трем причинам: он рассматривается как монетарный актив, доступный через отдельные ETF; он не генерирует доход протокола; а смешивание его в индексе с доходными активами затрудняет фундаментальный анализ для институциональных инвесторов. Пока индекс является эталонным, но Pantera ведет переговоры о создании на его основе ETF и других инвестиционных продуктов. Компания также отмечает значительный разрыв на рынке: многие институциональные инвесторы готовы к аллокации в криптоактивы, но им не хватает структурированных продуктов, фокусирующихся на активах с реальной экономической деятельностью.

marsbit2 ч. назад

S&P Dow Jones и Pantera выпускают криптоиндекс, биткоин оставлен за бортом из-за «отсутствия прибыли»

marsbit2 ч. назад

Торговля

Спот

Популярные статьи

Как купить WAR

Добро пожаловать на HTX.com! Мы сделали приобретение WAR (WAR) простым и удобным. Следуйте нашему пошаговому руководству и отправляйтесь в свое крипто-путешествие.Шаг 1: Создайте аккаунт на HTXИспользуйте свой адрес электронной почты или номер телефона, чтобы зарегистрироваться и бесплатно создать аккаунт на HTX. Пройдите удобную регистрацию и откройте для себя весь функционал.Создать аккаунтШаг 2: Перейдите в Купить криптовалюту и выберите свой способ оплатыКредитная/Дебетовая Карта: Используйте свою карту Visa или Mastercard для мгновенной покупки WAR (WAR).Баланс: Используйте средства с баланса вашего аккаунта HTX для простой торговли.Третьи Лица: Мы добавили популярные способы оплаты, такие как Google Pay и Apple Pay, для повышения удобства.P2P: Торгуйте напрямую с другими пользователями на HTX.Внебиржевая Торговля (OTC): Мы предлагаем индивидуальные услуги и конкурентоспособные обменные курсы для трейдеров.Шаг 3: Хранение WAR (WAR)После приобретения вами WAR (WAR) храните их в своем аккаунте на HTX. В качестве альтернативы вы можете отправить их куда-либо с помощью перевода в блокчейне или использовать для торговли с другими криптовалютами.Шаг 4: Торговля WAR (WAR)С легкостью торгуйте WAR (WAR) на спотовом рынке HTX. Просто зайдите в свой аккаунт, выберите торговую пару, совершайте сделки и следите за ними в режиме реального времени. Мы предлагаем удобный интерфейс как для начинающих, так и для опытных трейдеров.

457 просмотров всегоОпубликовано 2024.12.11Обновлено 2026.06.02

Как купить WAR

Обсуждения

Добро пожаловать в Сообщество HTX. Здесь вы сможете быть в курсе последних новостей о развитии платформы и получить доступ к профессиональной аналитической информации о рынке. Мнения пользователей о цене на WAR (WAR) представлены ниже.

活动图片