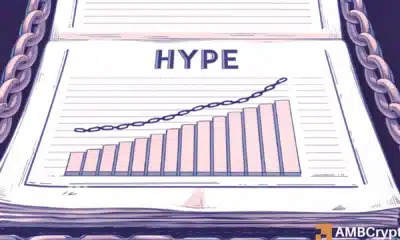
TVL, объем торгов, открытый интерес: как использовать данные DeFi, чтобы найти следующий хайповый проект?
Децентрализованные финансы (DeFi) предоставляют беспрецедентную прозрачность и доступ к данным в реальном времени, что является ключевым преимуществом перед традиционными финансами. Основные метрики для анализа включают:
- **TVL (общая заблокированная стоимость)**: Показывает сумму активов в смарт-контрактах протокола. Аналогично активам под управлением (AUM) в TradFi, но требует анализа вместе с чистыми притоками в долларах для исключения влияния волатильности цен.
- **Комиссии, доходы и доход держателей**: Комиссии — это общая сумма, уплаченная пользователями; доход — доля, сохраняемая протоколом; доход держателей — часть, распределяемая среди холдеров токенов.
- **Объем торгов**: Отражает активность на DEX и перпетуальных биржах. Важнее тренды изменения доли рынка, чем абсолютные значения.
- **Открытый интерес (Open Interest)**: Сумма незакрытых деривативных контрактов, показатель ликвидности платформы.
- **Капитализация стейблкоинов**: Отражает реальный приток капитала в экосистему, менее подвержена волатильности.
- **Доходы и комиссии приложений**: Показывают экономическую активность в сети,類似 ВВП для блокчейна.
Эффективный анализ требует:
1. Фокуса на устойчивом росте, а не единичных всплесках.
2. Совместного использования метрик запаса (TVL, OI) и потока (объем, доходы).
3. Учета расписания разблокировки токенов и стимулирующих программ, создающих давление продаж.
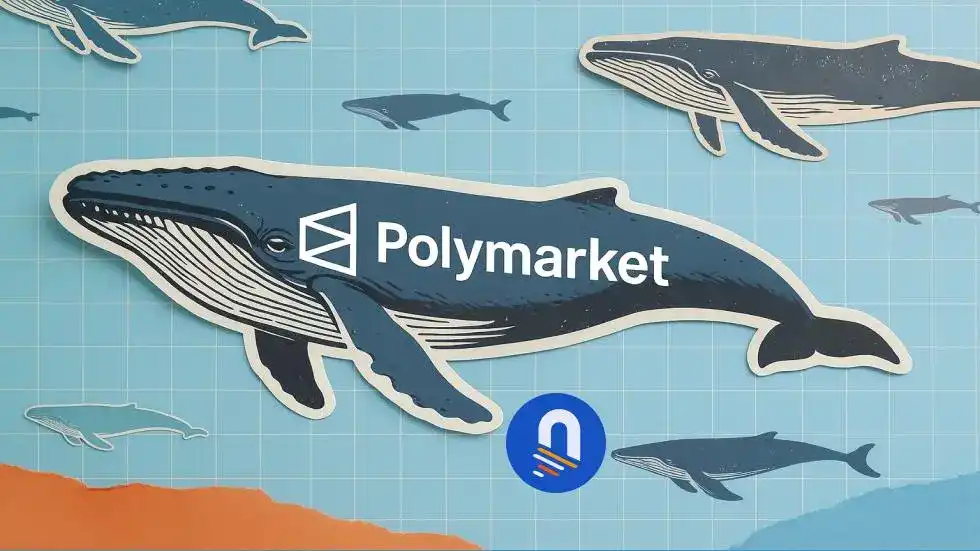
Данные DeFi позволяют выявлять перспективные проекты, такие как Polymarket или Hyperliquid, задолго до роста их популярности, обеспечивая инвесторам информационное преимущество.
marsbit01/08 05:04