On-Chain аналитика
В ловушке диапазона
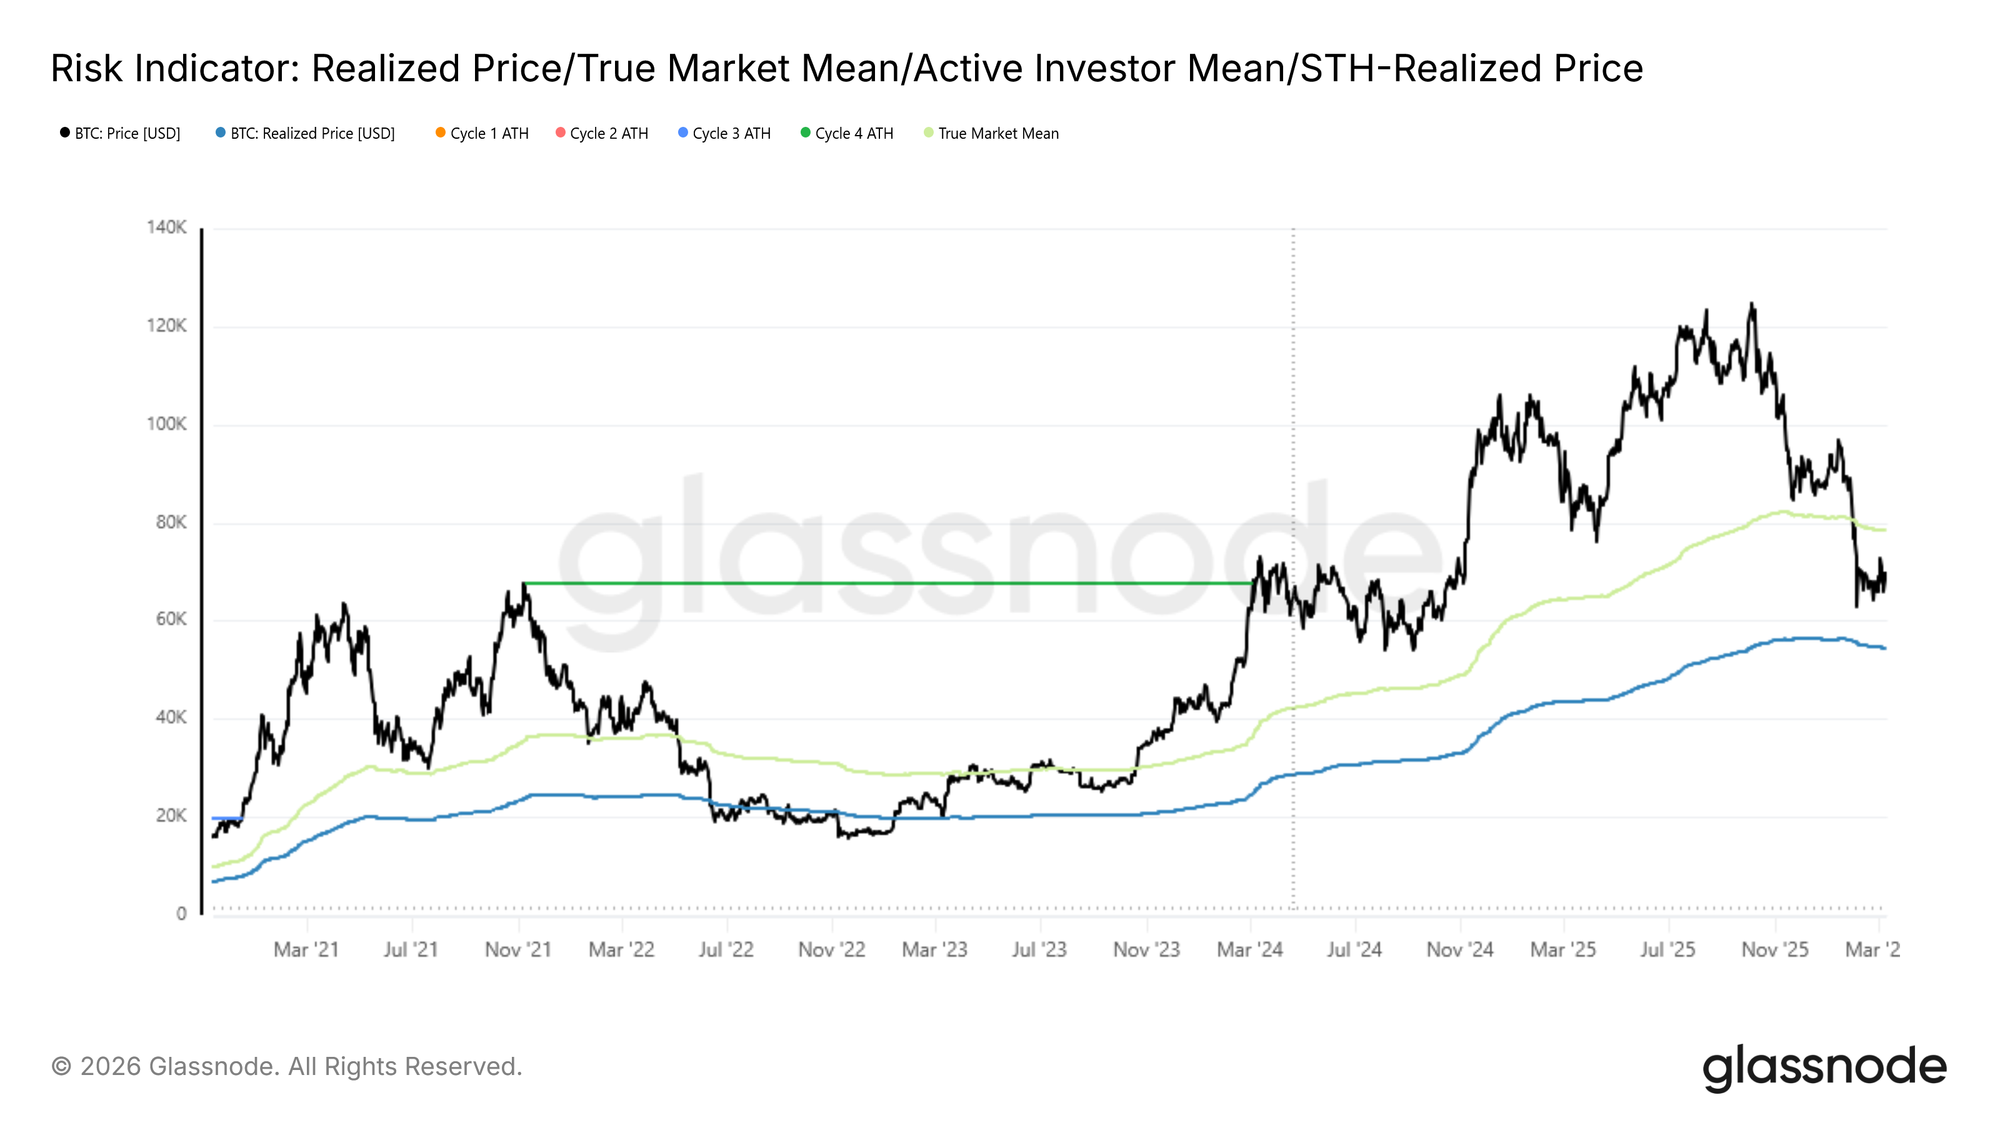
Биткоин провел более месяца в консолидации в диапазоне $62,8 тыс. – $72,6 тыс., с множеством неудачных попыток закрепиться выше $70 тыс., каждая из которых сопровождалась кратковременными всплесками Чистой Реализованной Прибыли, превышающей $5 млн в час, что свидетельствует о выгодной фиксации прибыли, а не об устойчивом спросе. Если смотреть шире, цена в настоящее время зажата между двумя структурно значимыми моделями себестоимости: Реализованной Ценой на уровне $54,4 тыс., представляющей среднюю стоимость приобретения всего находящегося в обращении предложения, и Истинной Рыночной Средней на уровне $78,4 тыс., которая отслеживает себестоимость активно торгуемых монет.
При отсутствии более широких макроэкономических встречных ветров этот диапазон мог бы правдоподобно поддержать восстановительный ралли медвежьего рынка, ограниченный Истинной Рыночной Средней. Однако наложение геополитической неопределенности на уже хрупкую структуру, которая неоднократно не могла удержаться выше $70 тыс., смещает распределение среднесрочной доходности в сторону снижения, при этом Реализованная Цена служит основным уровнем поддержки, за которым следует следить.
Накопление без убежденности
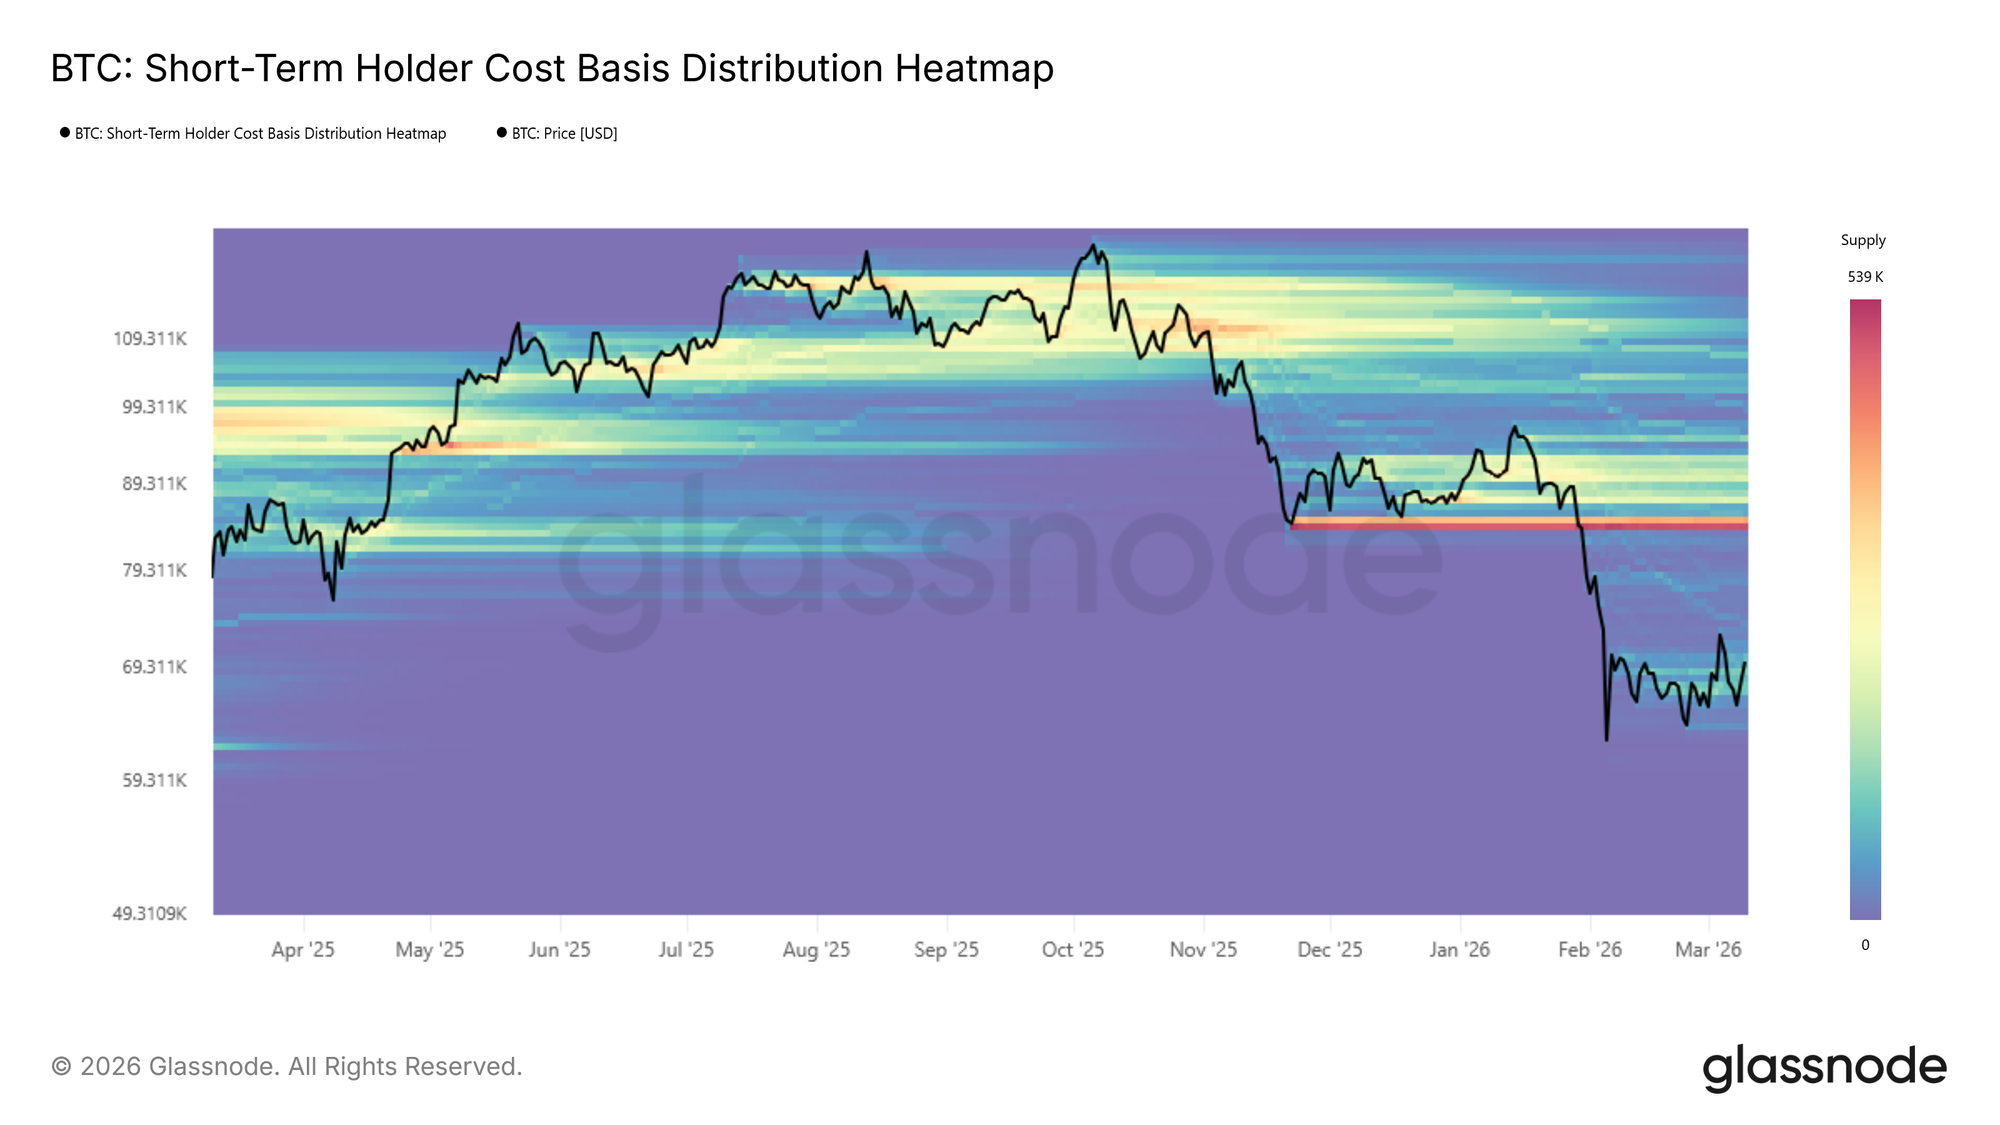
Основываясь на наблюдаемой стабильности вокруг середины диапазона от Реализованной Цены до Истинной Рыночной Средней, начинает формироваться ончейн кластер накопления. Используя Тепловую Карту Распределения Себестоимости, кластеры накопления идентифицируют уровни цен, на которых значительный объем предложения недавно поменял владельцев, служа индикатором краткосрочной убежденности инвесторов и потенциальной плотности поддержки.
Однако интенсивность текущего кластера относительно умеренна по сравнению с предыдущими фазами накопления, которые предшествовали решительным ценовым расширениям. Те более ранние эпизоды характеризовались более серьезными капиталовложениями, тогда как нынешний кластер отражает более осторожное репозиционирование. Таким образом, хотя формирующееся накопление придает некоторую достоверность изложенному выше тезису о ралли на медвежьем рынке, его недостаточная интенсивность suggests that the foundation for a sustained mid-term expansion remains thin.
Новые инвесторы под давлением
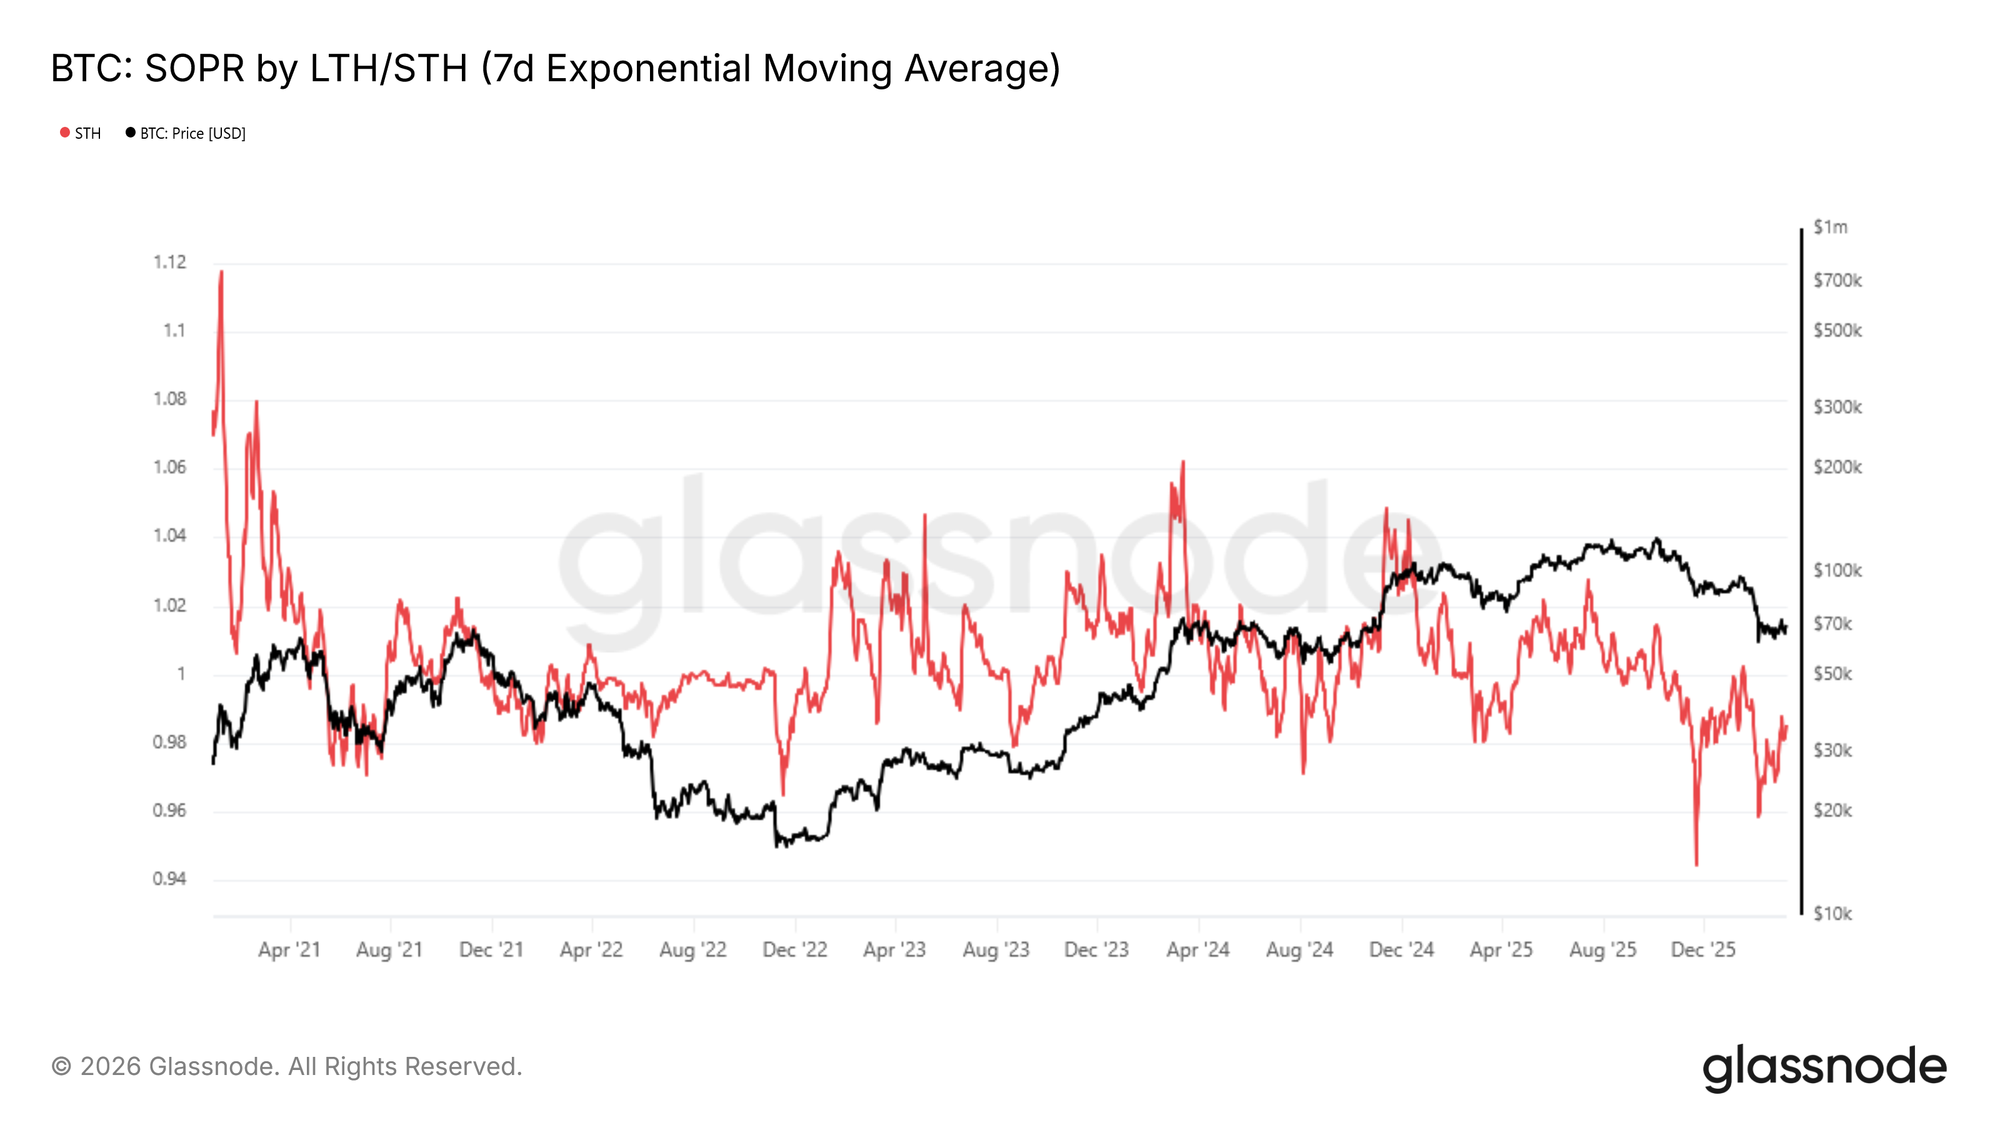
Усугубляя вялый сигнал накопления, ключевым тормозом рыночного импульса является устойчивое снижение прибыльности среди новых участников рынка. Эта динамика напрямую captured by the Short-Term Holder Spent Output Profit Ratio (STH-SOPR), который измеряет соотношение между ценой, по которой краткосрочные держатели приобрели свои монеты, и ценой, по которой они их тратят. Значение ниже 1 указывает на то, что эта когорта в совокупности фиксирует убытки.
7-дневная скользящая средняя STH-SOPR непрерывно торговалась ниже 1 с октября 2025 года и в настоящее время находится на уровне 0,985, что подтверждает, что у недавних покупателей нет существенной нереализованной прибыли для развертывания или защиты позиций. Это textbook characteristic медвежьего рыночного режима, который исторически требует extended period базообразования, прежде чем условия нормализуются.
Тактически, STH-SOPR также служит индикатором локального верха. Всплески к 1 во время восстановительных ралли tend to mark точки истощения, поскольку недавние покупатели используют возможность выйти near breakeven, а не держать для дальнейшего роста.
Off-Chain аналитика
Притоки в ETF вновь появляются
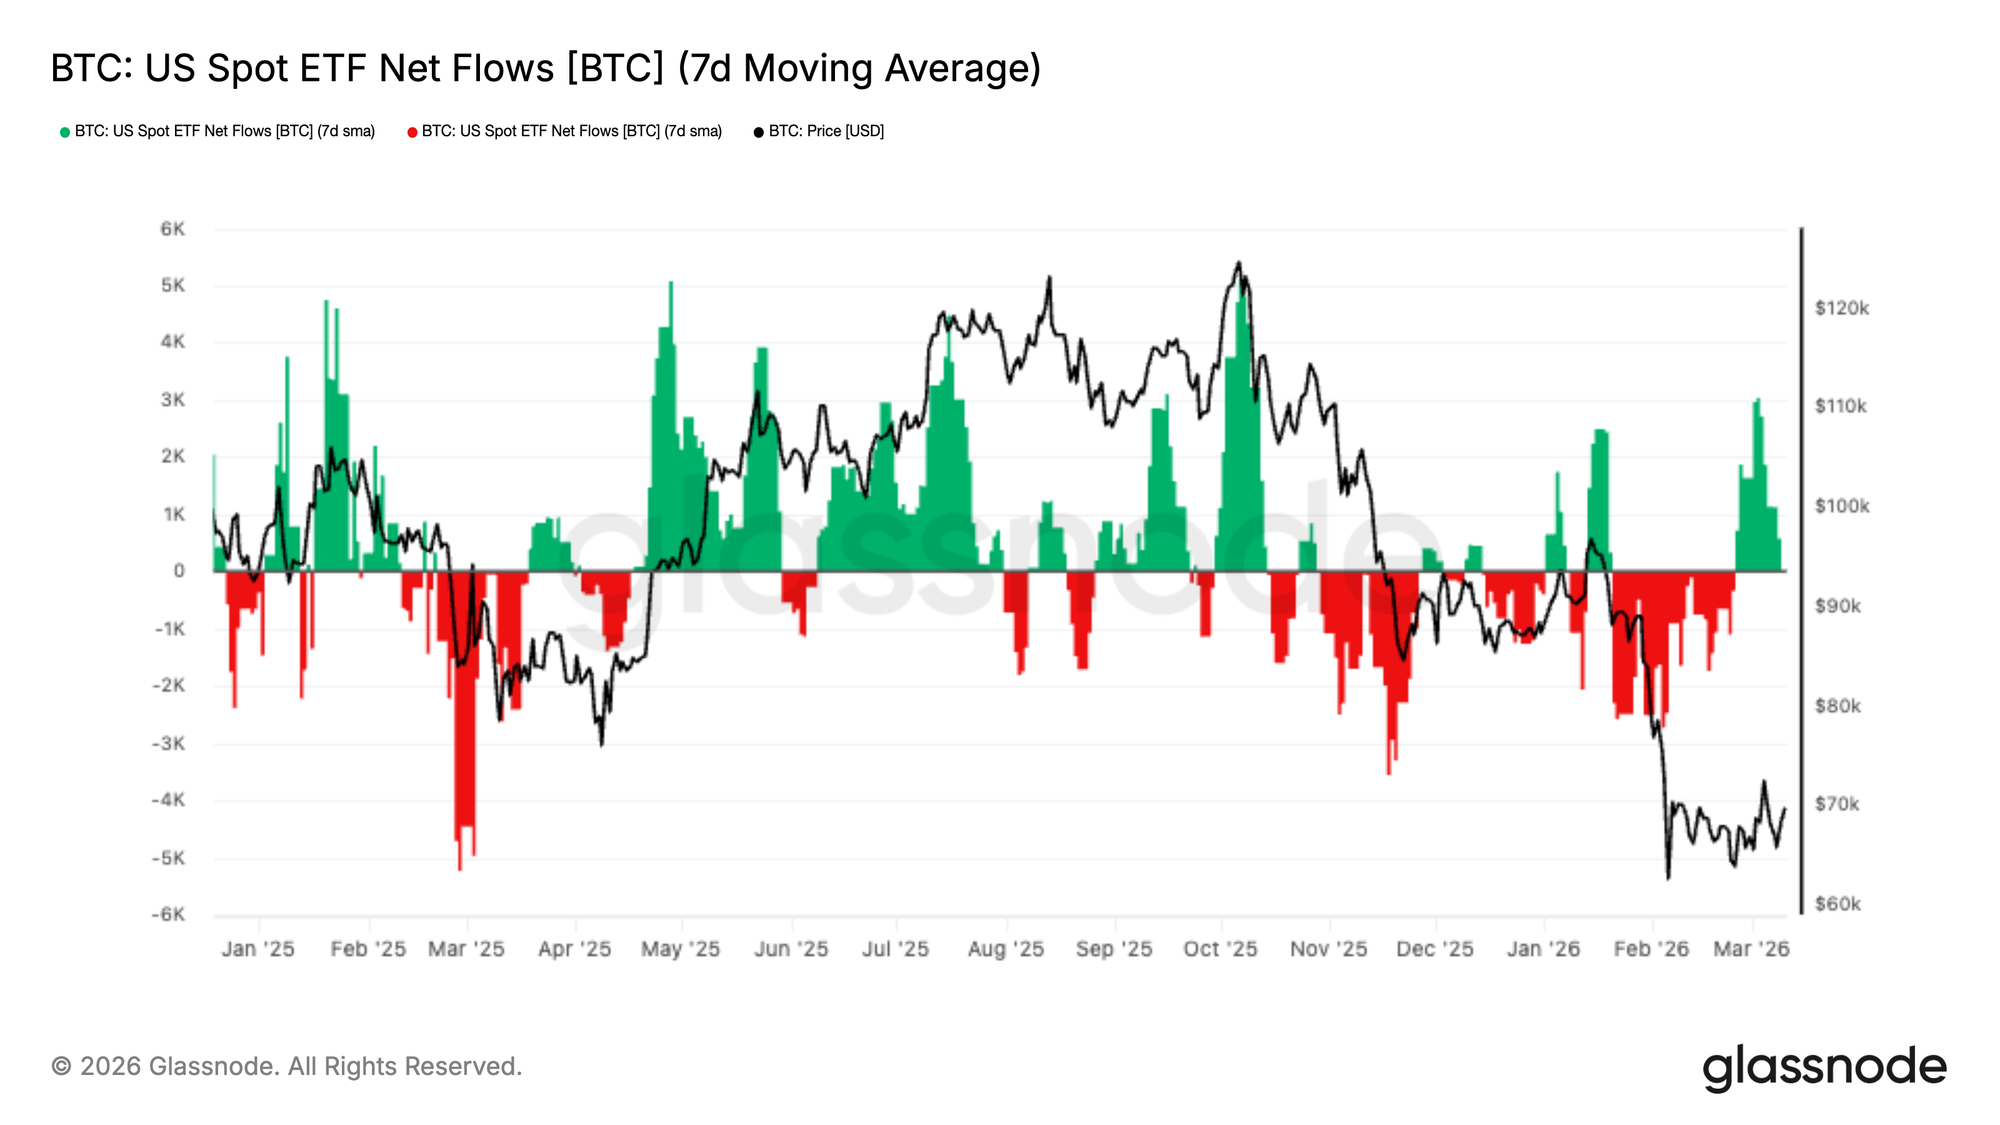
US Spot Bitcoin ETFs пережили sustained period чистых оттоков на протяжении недавней рыночной коррекции, при этом 7-дневная скользящая средняя оставалась отрицательной по мере снижения цен к региону $65 тыс. Это persistent давление погашений отражало более широкую фазу снижения рисков институциональными инвесторами across регулируемых инвестиционных инструментов.
Однако за последнюю неделю потоки существенно изменились, появился strong burst притоков, который firmly pushed 7-дневную среднюю обратно на положительную территорию. Это marks наиболее значительный импульс спроса с начала коррекции, что suggests that институциональные покупатели, возможно, вступают в игру, поскольку Биткоин стабилизируется near недавних минимумов.
Хотя еще рано подтверждать структурный сдвиг в спросе, продолжение положительных потоков в ETF signaled бы улучшение институциональных настроений и могло бы re-establish ETFs как важный источник спотовой поддержки для рынка.
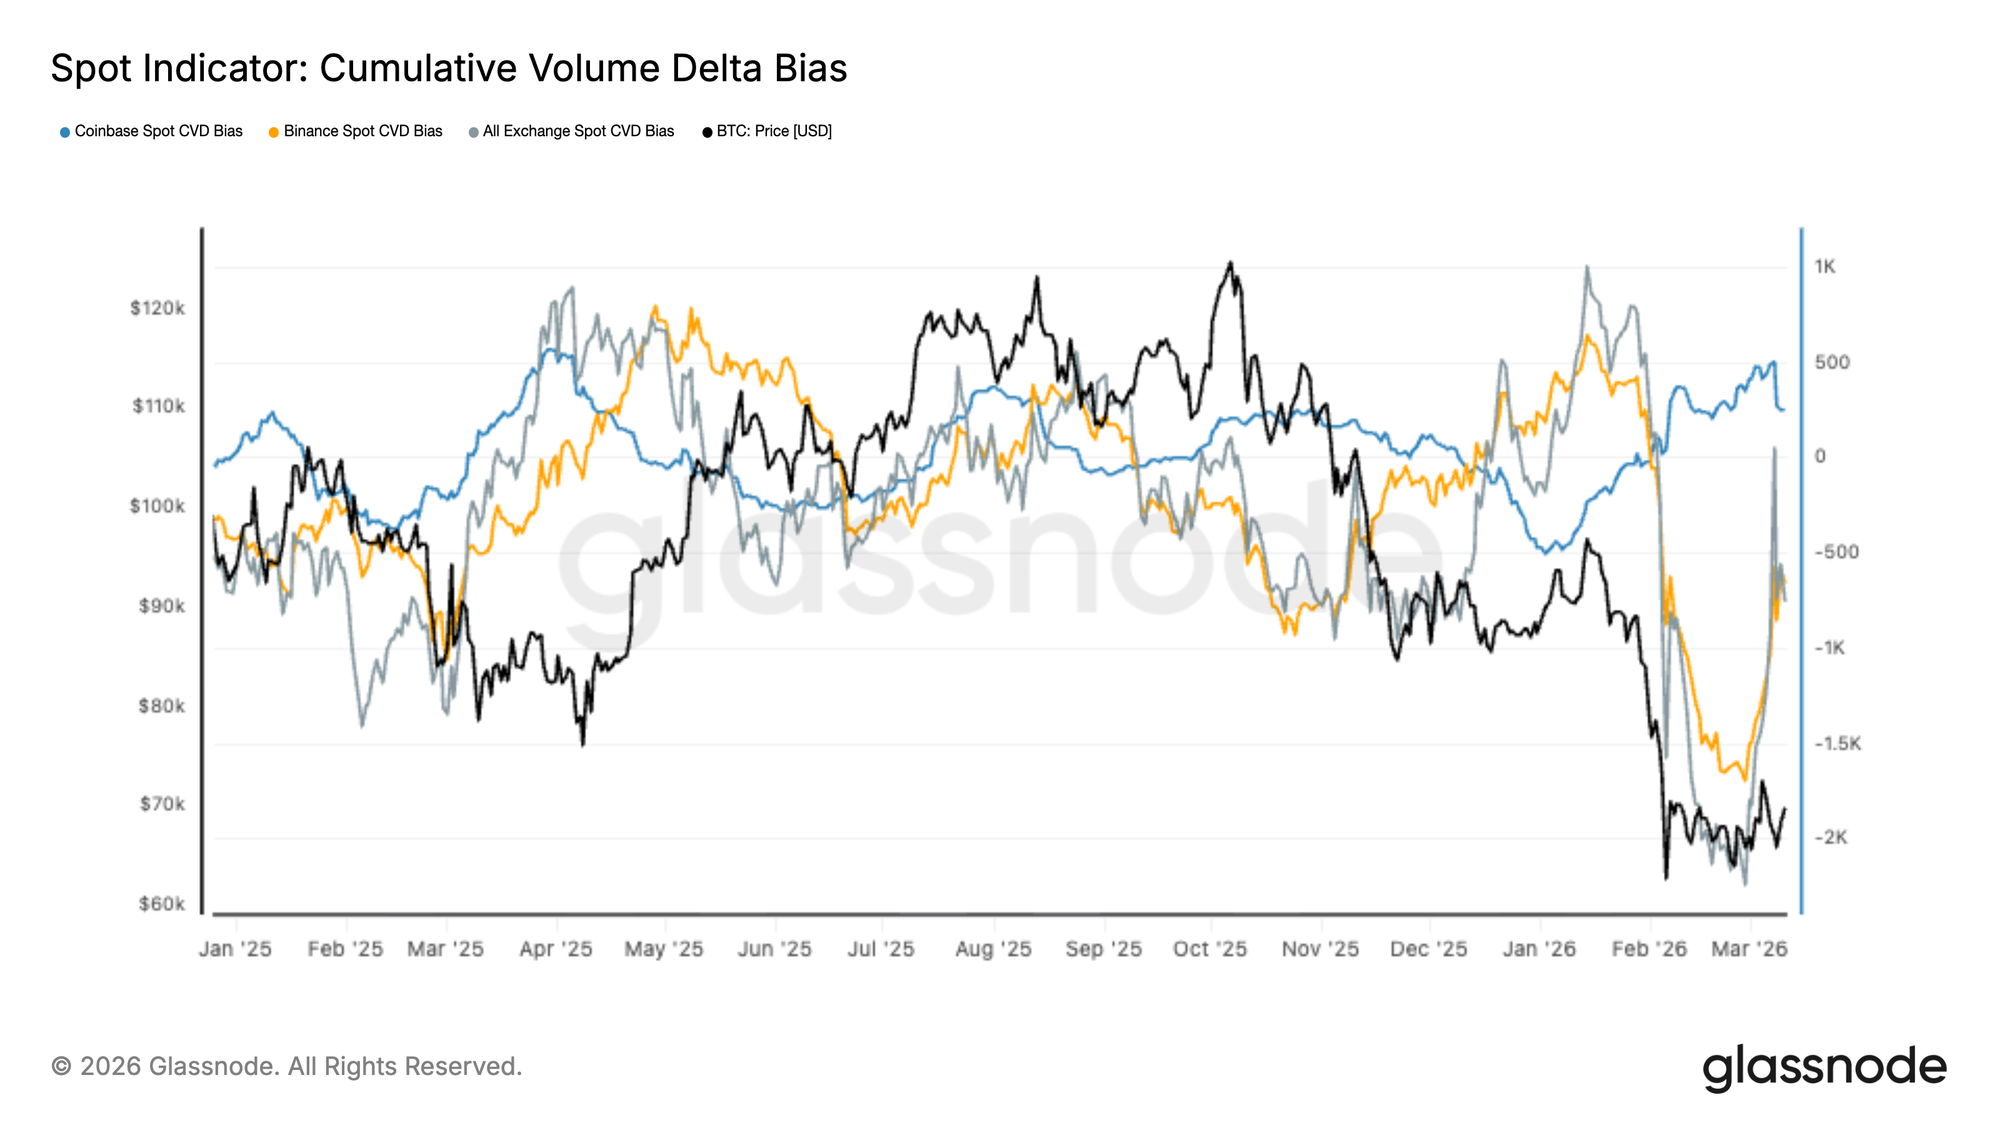
Спотовый спрос восстанавливается
Поток спотовых рыночных ордеров показывает early signs восстановления после extended period агрессивного давления со стороны продавцов. Совокупная дельта объема across крупных бирж резко упала во время недавнего рыночного снижения, при этом потоки на Binance и broader market отражали persistent давление рыночных продаж по мере падения BTC к диапазону $60–$70 тыс.
Однако в recent sessions спотовая CVD начала разворачиваться вверх, указывая на то, что покупатели начинают поглощать ликвидность со стороны продавцов. Восстановление particularly visible across агрегатов глобальных бирж, что suggests широкомасштабное улучшение спотового спроса, а не активность на отдельных биржах.
Хотя этот сдвиг указывает на potential стабилизацию условий спотового рынка, для подтверждения того, что спрос достаточно силен, чтобы поддержать durable восстановление цены, потребуется sustained доминирование покупателей.
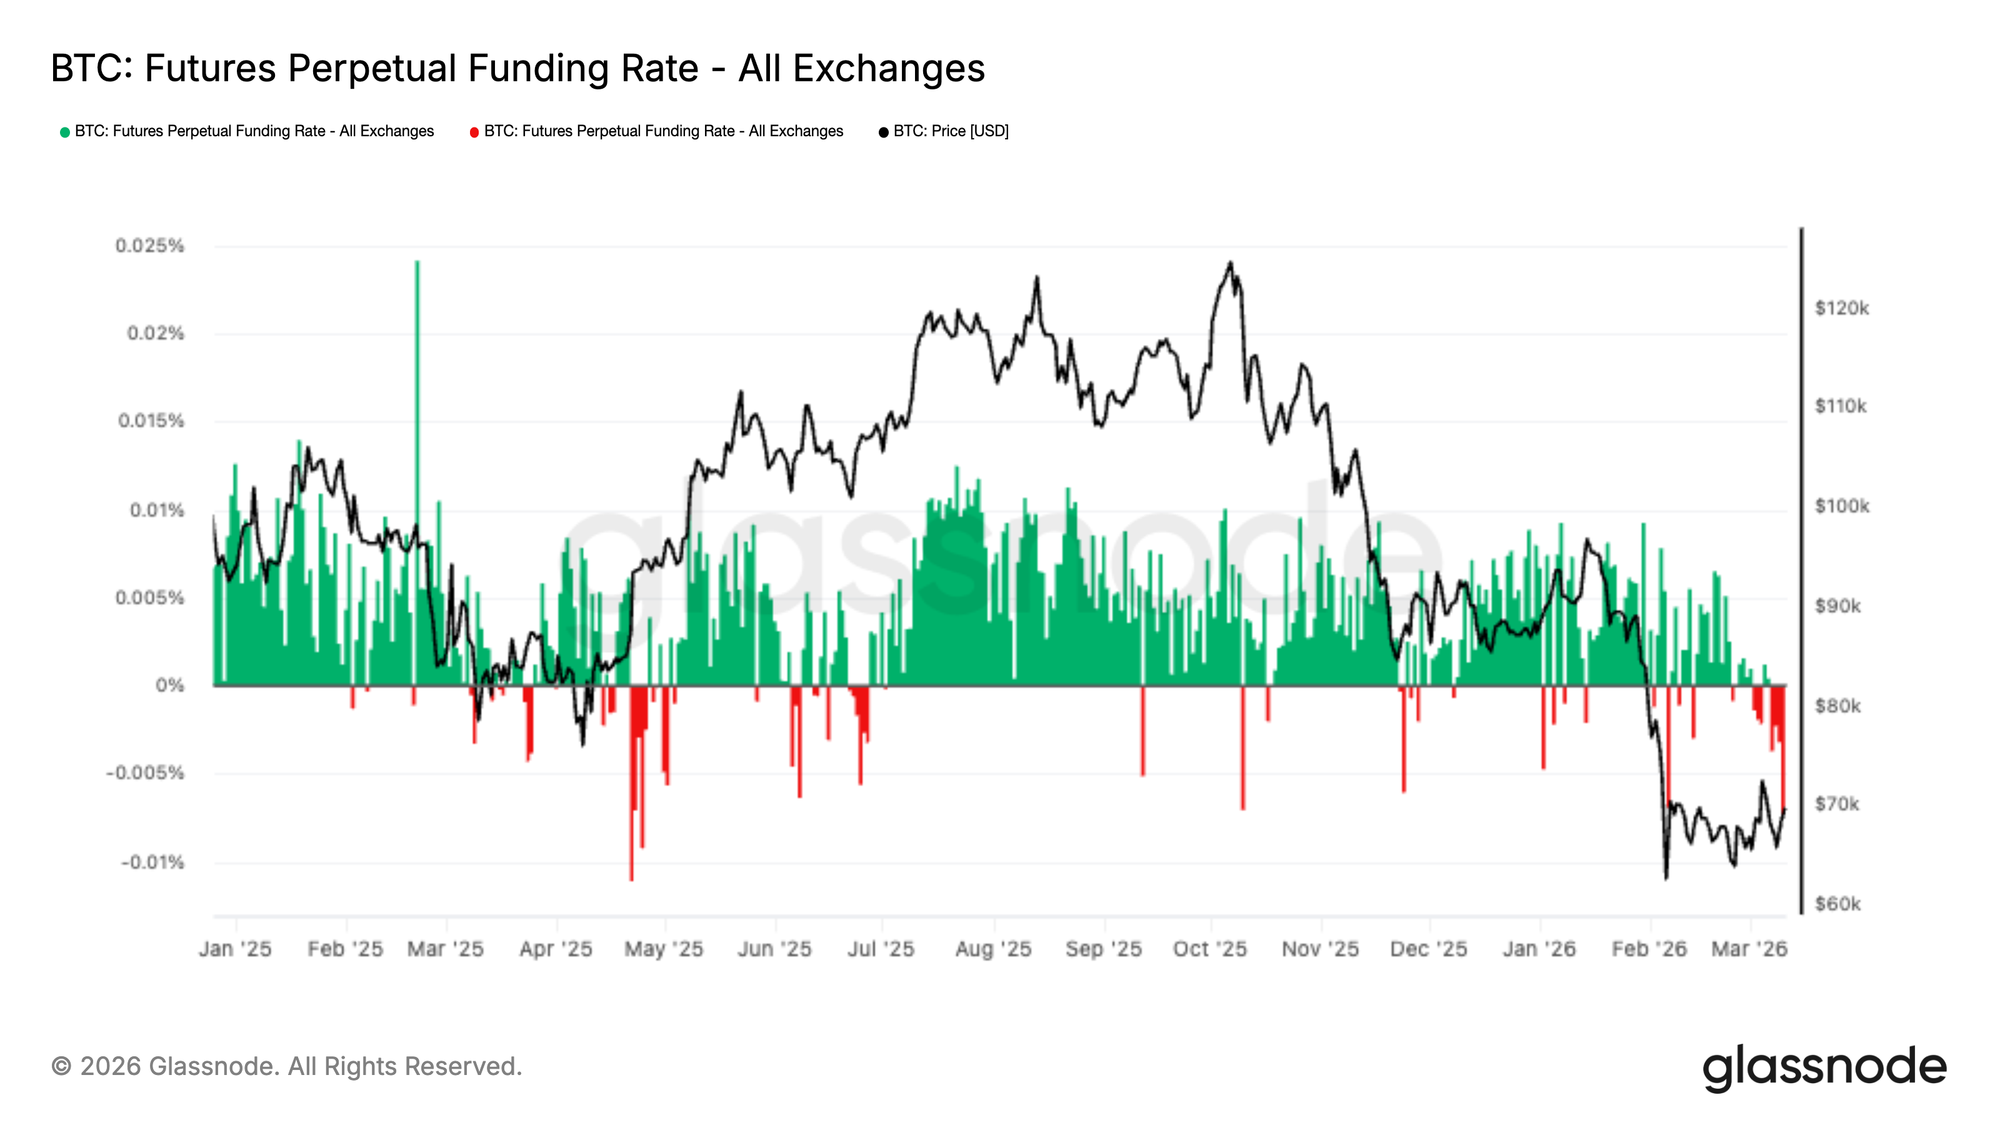
Фандинг становится отрицательным по мере наращивания коротких позиций
Ставки фандинга perpetual futures решительно сместились в отрицательную территорию в recent sessions, отражая increasing доминирование коротких позиций across derivatives рынков. Этот сдвиг происходит, когда Биткоин торгуется near нижней границы своего недавнего диапазона после резкого снижения к региону $60–$70 тыс.
Отрицательный фандинг indicates, что короткие продавцы теперь платят премию за поддержание своих позиций, что suggests растущий консенсус вокруг продолжения снижения. Однако такие crowded короткие позиции также могут создавать асимметричные условия, при которых резкое upward движение вынуждает шортов покрываться.
Если спотовый спрос продолжит восстанавливаться, накопление короткого exposure повышает potential для short squeeze, который мог бы усилить upside волатильность, если forced ликвидации начнут каскадировать.
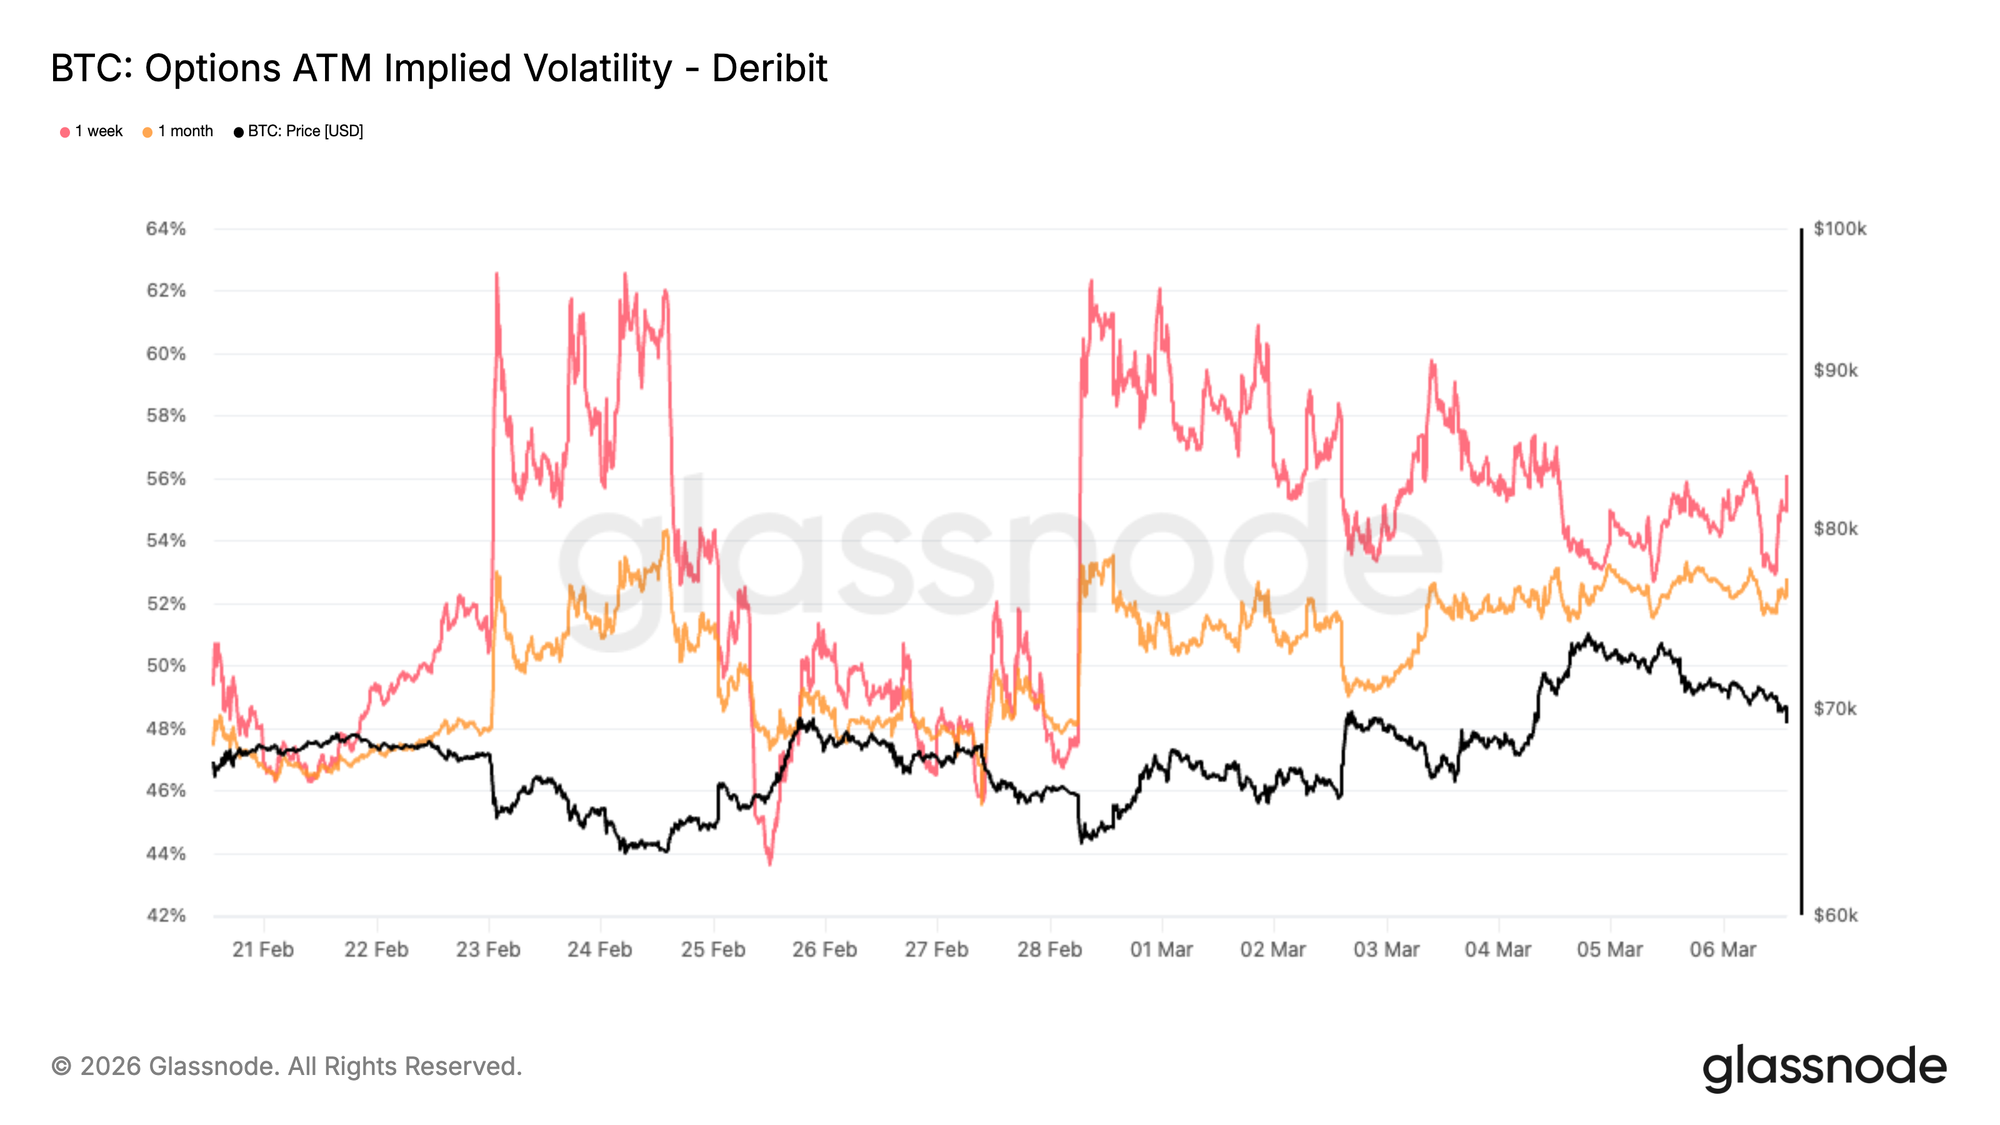
Подразумеваемая волатильность: Премия коротких сроков начинает снижаться
Биткоин оставался на удивление устойчивым после недавнего геополитического шока. Эта устойчивость теперь reflected на рынке опционов, где краткосрочная подразумеваемая волатильность начала снижаться.
За последнюю неделю снижение было наиболее заметно на коротком конце кривой, при этом краткосрочная подразумеваемая волатильность упала обратно к области mid-50 percent. Подразумеваемая волатильность представляет собой цену, которую трейдеры готовы платить за опционность. Когда неопределенность spikes, защита становится дорогой. Недавнее движение вниз suggests, что рынок видит меньше immediate event риска, чем earlier на неделе.
На графике видно, что волатильность коротких сроков, представленная tenor 1 неделя, сжимается быстрее, чем более длинные сроки, такие как 1 месяц, что подтверждает, что immediate event риск исчезает. Этот сдвиг не означает, что волатильность fully нормализовалась. Уровни остаются elevated по сравнению с recent месяцами, показывая, что рынок все еще pricing degree неопределенности.
Что изменилось, так это срочность. Трейдеры, кажется, less focused на immediate шоках снизу и gradually отходят от агрессивного краткосрочного хеджирования.
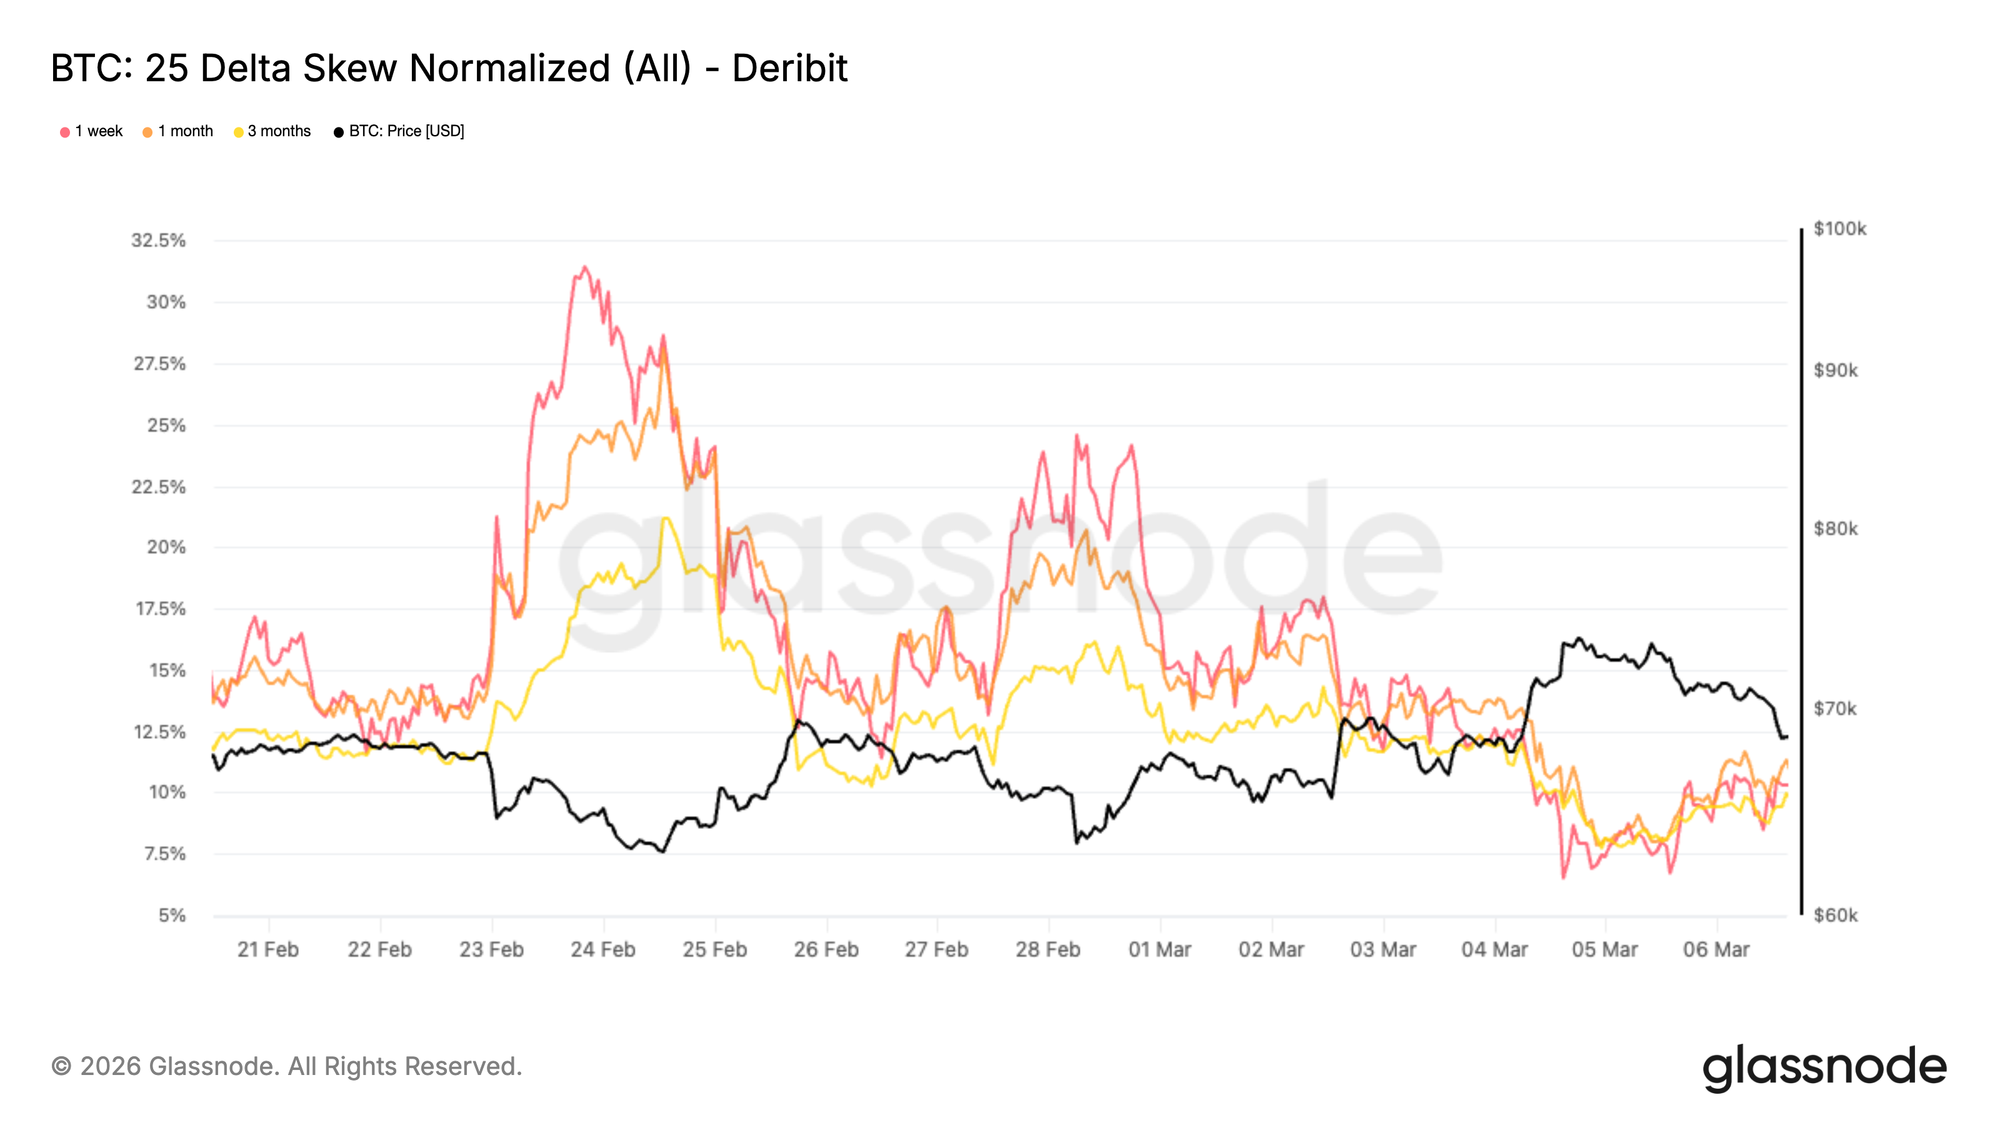
25 Дельта Скоу: Защитное позиционирование начинает ослабевать
По мере охлаждения волатильности, скоу дает представление о том, как трейдеры позиционируются под directional риск.
Across сроков погашения, 25 дельта risk reversals остаются отрицательными, что означает, что пут-опционы продолжают торговаться с более высокой подразумеваемой волатильностью, чем сопоставимые коллы. Это отражает тот факт, что спрос на защиту от снижения все еще присутствует на рынке.
Однако величина этого скоу начала сжиматься. За последние сессии скоу meaningfully ужесточился, указывая на то, что интенсивность защитного позиционирования начинает исчезать.
Скоу essentially измеряет относительный спрос на защиту versus участие. Когда трейдеры агрессивно хеджируют downside риск, путы становятся significantly дороже коллов. По мере того как этот дисбаланс сужается, это typically signals, что рынок становится более комфортным для принятия directional exposure снова.
Как показано на графике, 1-недельный скоу сейчас находится around 10% пут скоу, down с недавнего максимума в 31%, достигнутого 23 марта. Этот сдвиг suggests, что хотя осторожность remains, оборонительный тон, который доминировал во время шока, gradually ослабевает.
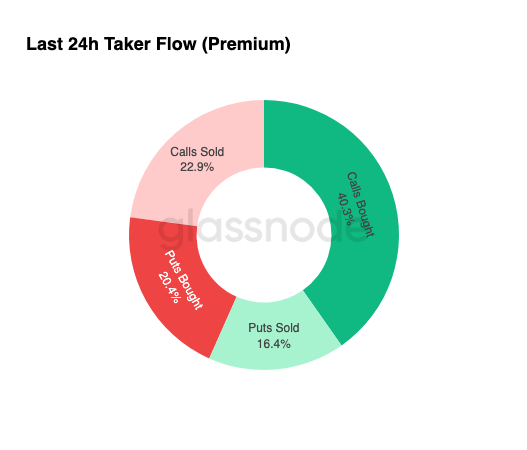
Поток опционов: Возрастает интерес к апсайду
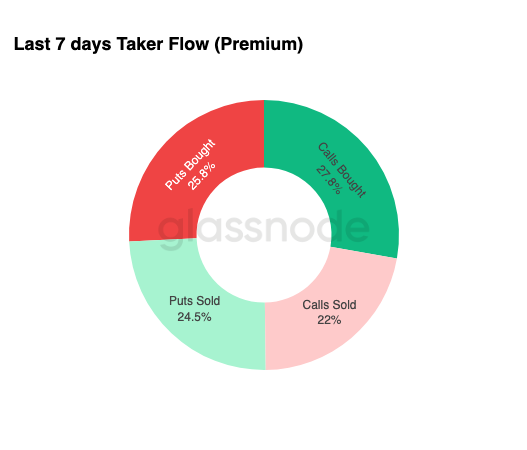
Крупнейшие опционные сделки, observed за последние 24 часа, были сконцентрированы на покупке коллов, accounting for 40,3% от общей опционной активности. За последнюю неделю покупка коллов уже была доминирующим потоком, representing 27,8% опционной активности. Эта тенденция ускорилась, при этом доля покупки коллов climbed до 40,3% за последние 24 часа.
Коллы предоставляют exposure к upward движениям, ограничивая downside риск, что делает их common инструментом для позиционирования during ранних стадий восстановления.
Что делает текущую setup particularly интересной, так это контраст между потоком и ценообразованием. Скоу остается отрицательным, что означает, что защита от снижения все еще relatively дорога, yet трейдеры increasingly накапливают апсайд экспозер through коллы.
Эта pattern often появляется, когда настроения начинают улучшаться, но broader рынок еще не fully переоценил риск. Участники начинают позиционироваться под upward возможности, while still сохраняя некоторые защитные структуры.
Вместо того чтобы signaling outright бычий сдвиг, поток suggests gradual переход, при котором трейдеры осторожно тестируют апсайд, while maintaining защиту от potential downside рисков.
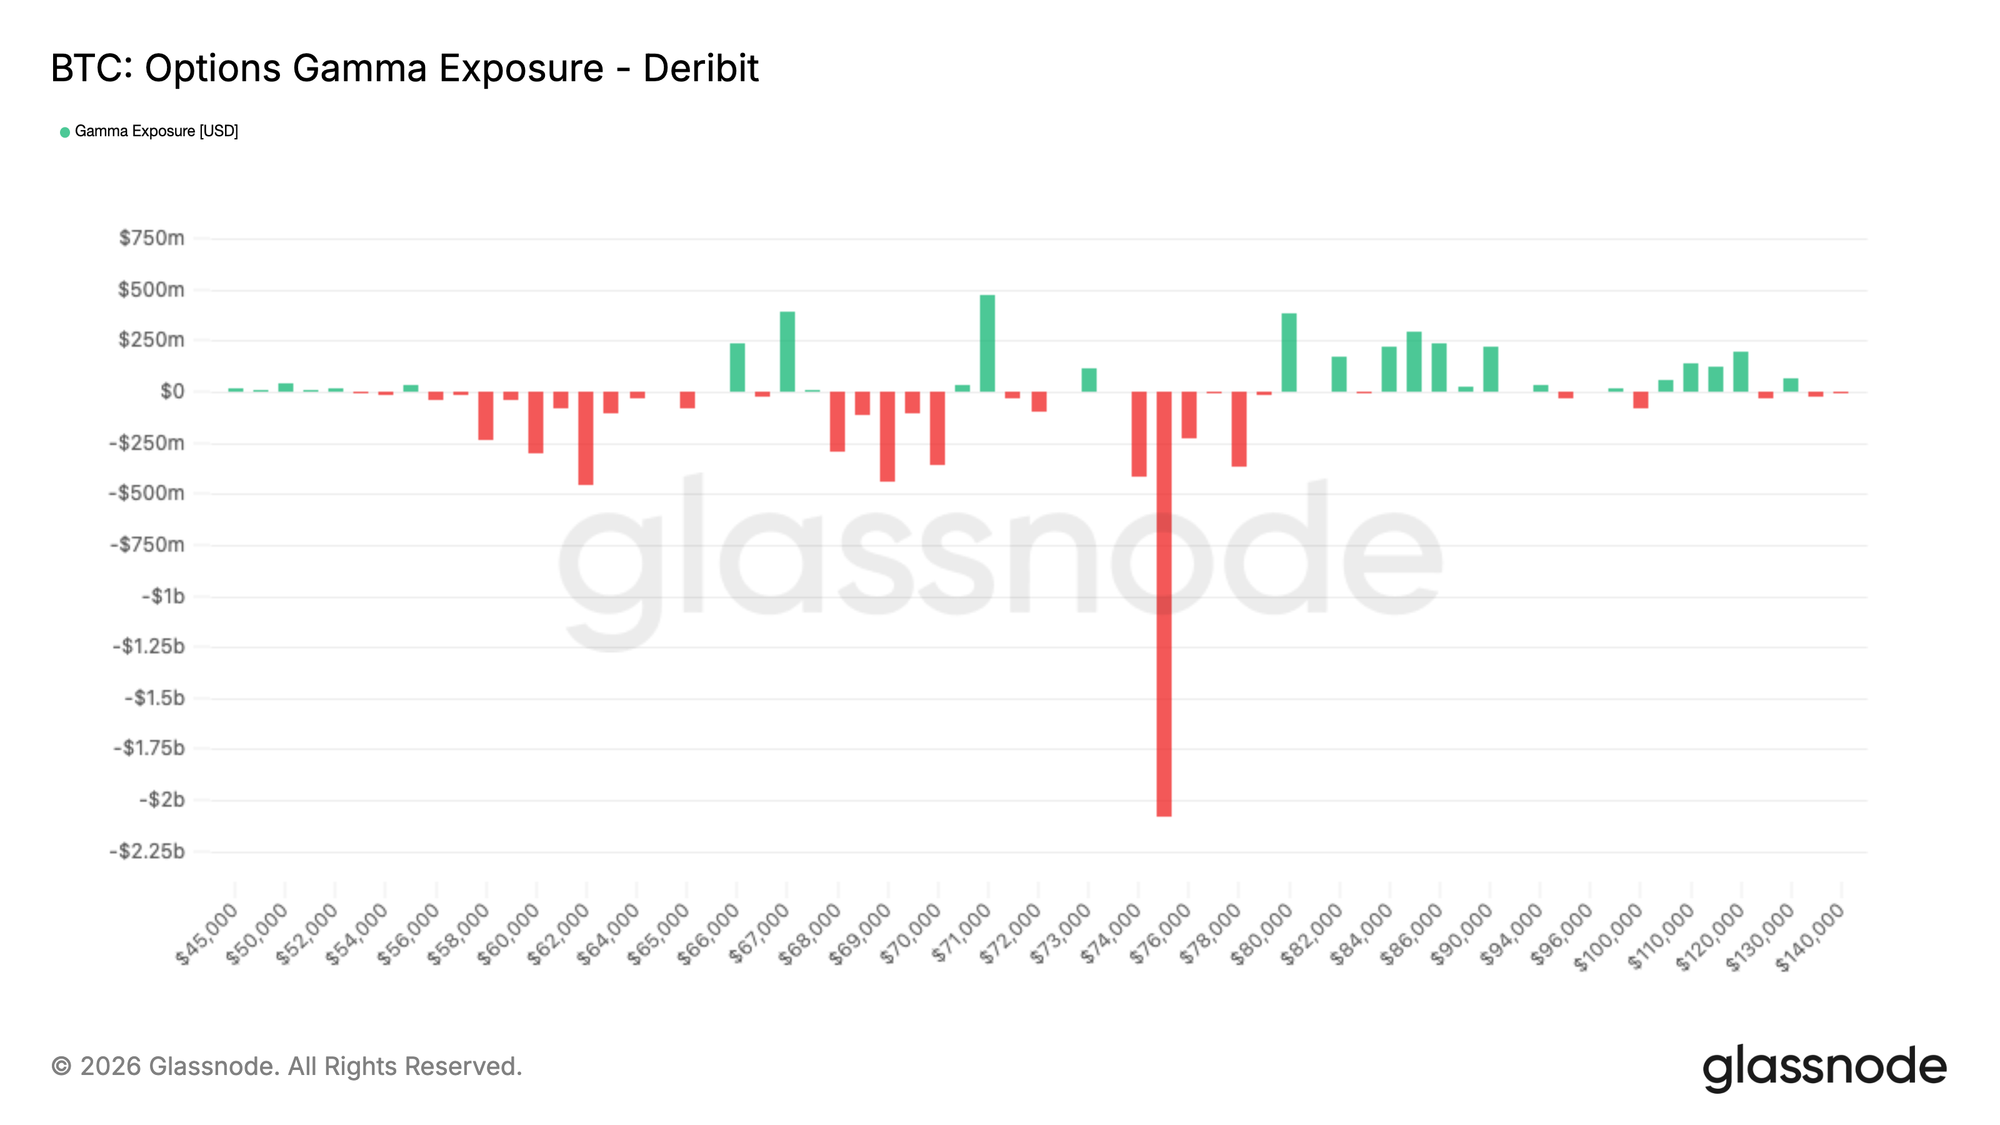
Гамма Экспозер: $75K как ключевой апсайд магнит
При том, что Биткоин торгуется around $69,5K на момент написания, спот в настоящее время находится в mild коротком гамма коридоре между roughly $67K и $71K. Around $400 миллионов положительной гаммы sits на каждой стороне этого диапазона, создавая nearby уровни, где хеджирование дилеров может временно стабилизировать цену.
Гамма описывает, как потоки хеджирования дилеров реагируют на изменения цены. Когда дилеры держат положительную гамму around страйка, они tend to продавать ралли и покупать dips, чтобы оставаться хеджированными, что может замедлить движения цены и создать краткосрочную поддержку и сопротивление.
Однако не потребовалось бы significant объема, чтобы прорваться через любую сторону этого коридора. Более важный уровень sits выше.
Вокруг страйка $75K сконцентрировано roughly $2 миллиарда отрицательной гаммы. В зоне короткой гаммы потоки хеджирования дилеров усиливают движение. Если цена pushed в этот регион, хеджирующая активность может ускорить движение выше к области $80K.
Примечательно, что around $1,8 миллиарда этого позиционирования истекает 27 марта, в конце квартального экспирации, что означает, что ландшафт гаммы мог meaningfully измениться, once эти опционы сойдут.
Заключение
Биткоин остается под давлением, но несколько сигналов suggest, что рынок, возможно, входит в более стабилизированную фазу. Неликвидное предложение continues расширяться, указывая на ongoing убежденность среди долгосрочных держателей, even as цена торгуется below ключевых ончейн уровней себестоимости.
Across офф-чейн рынков, условия начинают улучшаться. Потоки US Spot ETF turned положительными после prolonged режима оттоков, и спотовая CVD начинает восстанавливаться, indicating покупатели начинают re-вовлекаться. В то же время, perpetual фандинг moved отрицательным, отражая increasingly crowded короткое позиционирование, которое могло бы усилить апсайд, если спрос continues укрепляться.
Рынки опционов добавляют к этой картине, при этом краткосрочная подразумеваемая волатильность сжимается по мере того, как трейдеры снижают спрос на краткосрочное хеджирование. Дельта скоу остается relatively сбалансированным, while дилерское гамма позиционирование appears broadly нейтральным, suggesting рынки опционов больше не сильно смещены в сторону immediate защиты от снижения.
Взятые вместе, рынок, appears, shifting от вынужденного deleveraging к early стабилизации, с scope для восстановления, если спотовый спрос continues наращиваться.
Отказ от ответственности: Этот отчет не предоставляет никаких инвестиционных рекомендаций. Все данные предоставляются исключительно в информационных и образовательных целях. Ни одно инвестиционное решение не должно основываться на информации, предоставленной здесь, и вы solely несете ответственность за свои собственные инвестиционные решения.
Балансы бирж, представленные здесь, получены из комплексной базы данных Glassnode с метками адресов, которые собираются через официально опубликованную информацию о биржах и проприетарные алгоритмы кластеризации. Хотя мы стремимся обеспечить максимальную точность в представлении балансов бирж, важно отметить, что эти цифры могут не всегда охватывать всю полноту резервов биржи, particularly когда биржи воздерживаются от раскрытия своих официальных адресов. Мы призываем пользователей проявлять осторожность и осмотрительность при использовании этих метрик. Glassnode не несет ответственности за любые несоответствия или потенциальные неточности.


