Автор: Frank, PANews
Оригинальное название: Когда "старые карты" больше не работают: обзор 8 утративших актуальность классических криптопоказателей и структурных причин их неэффективности
В начале 2026 года на крипторынке царили разочарование и замешательство.
Биткоин откатился примерно на 36% от исторического максимума, достигнутого в октябре 2025 года, и рынок колебался между бычьими и медвежьими настроениями. Но что беспокоило многих криптоинвесторов больше, так это не сама цена, а то, что вся система показателей, которую они раньше использовали для оценки рыночной ситуации, практически перестала работать.
Прогноз модели S2F в 500 000 долларов отклонялся от реальности более чем в 3 раза, четырехлетний цикл после халвинга так и не принес ожидаемого взрывного роста, индикатор Pi Cycle Top молчал на протяжении всего цикла, фиксированные пороги MVRV Z-Score больше не срабатывали, достичь верхней области радужного графика стало практически невозможно. В то же время обратные сигналы индекса страха и жадности repeatedly давали сбои, а долгожданный "сезон альткоинов" так и не наступил.
Почему эти показатели коллективно перестали работать? Стоит ли за этим временное отклонение или же структура рынка претерпела фундаментальные изменения? PANews провела систематический обзор и анализ 8 широко обсуждаемых нефункционирующих показателей.
Теория четырехлетнего цикла: шок сокращения предложения от халвинга становится незначительным
Теория четырехлетнего цикла — это одна из наиболее широко признанных закономерностей на крипторынке. Согласно этой теории, биткоин следует фиксированному ритму, driven by событиями халвинга: накопление перед халвингом, взрывной рост через 12-18 месяцев после халвинга, падение с пика на 75%-90%, формирование дна на медвежьем рынке и новый старт. Три халвинга в 2012, 2016 и 2020 годах достаточно хорошо подтвердили эту закономерность.
Однако после халвинга в апреле 2024 года рынок не показал типичного для предыдущих циклов взрывного роста. Годовая волатильность биткоина снизилась с исторических значений свыше 100% до примерно 50%, приобретая черты более "плавного бычьего" тренда. Медвежьи падения также стали менее глубокими: падение с пика до дна в 2022 году составило 77%, что меньше, чем 86% в 2014 году и 84% в 2018 году.
Обсуждения несостоятельности теории четырехлетнего цикла широко распространены в соцсетях, и主流ная точка зрения заключается в том, что приток институциональных средств фундаментально изменил микроструктуру рынка.
Во-первых, запуск спотовых биткоин-ETF в США привел к постоянному притоку капитала, создав устойчивый спрос и разрушив простой нарратив, driven solely халвингом.
Во-вторых, на стороне предложения халвинг 2024 года снизил награду за блок до 3,125 BTC, уменьшив ежедневное новое предложение с примерно 900 BTC до 450 BTC. Годовое сокращение предложения составило около 164 000 монет. Это снижение привело к тому, что годовая инфляция биткоина (темп роста предложения) упала с 1,7% до халвинга до примерно 0,85%. Ежегодное сокращение предложения составляет лишь 0,78% от общего эмиссионного лимита в 21 миллион монет. По сравнению с триллионной капитализацией биткоина практическое влияние этого сокращения предложения стало ничтожным.
Pi Cycle Top: Снижение волатильности лишило условия пересечения скользящих средних
Pi Cycle Top, разработанный Philip Swift, определяет рыночные вершины путем наблюдения за тем, когда 111-дневная скользящая средняя (MA) пересекает сверху удвоенную 350-дневную скользящую среднюю. Этот индикатор трижды точно сигнализировал о вершинах: в 2013, 2017 годах и в апреле 2021 года.
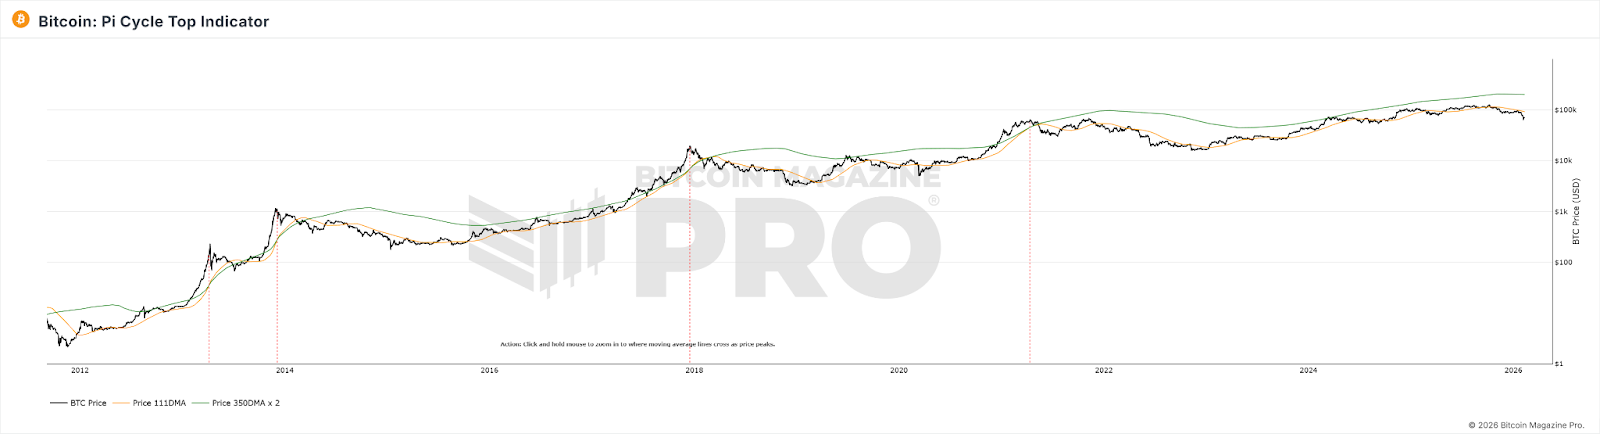
В бычьем цикле 2025 года две скользящие средние так и не произвели эффективного пересечения, индикатор持续 "молчал". Но нисходящий тренд рынка был уже вполне очевиден.
Причина отказа этого индикатора, возможно, заключается в том, что Pi Cycle Top зависит от резких колебаний цены, которые заставляют краткосрочную скользящую среднюю значительно отклоняться от долгосрочной, что приводит к пересечению. По мере структурного снижения волатильности биткоина, с появлением ETF и участием институциональных игроков, движение цены BTC стало более плавным, параболические роста, driven розничными инвесторами, сократились, и условия для пересечения скользящих средних больше не так легко выполняются. Кроме того, по своей сути этот индикатор является подгонкой кривой под данные ранней стадии adoption (2013-2021 гг.), и после качественного изменения структуры участников рынка параметры, fitted на раннем этапе, скорее всего, больше не применимы.
MVRV Z-Score: Размер рынка и модели хранения изменили основу расчета
MVRV Z-Score — это ончейн-индикатор оценки, который оценивает рыночную оценку, сравнивая степень отклонения рыночной стоимости биткоина (текущая капитализация) от реализованной стоимости (общая стоимость, рассчитанная по цене последнего ончейн-движения каждой монеты). Традиционно Z-Score выше 7 считается сигналом к продаже при перегреве рынка, а ниже 0 — сигналом к покупке при сильной недооцененности.
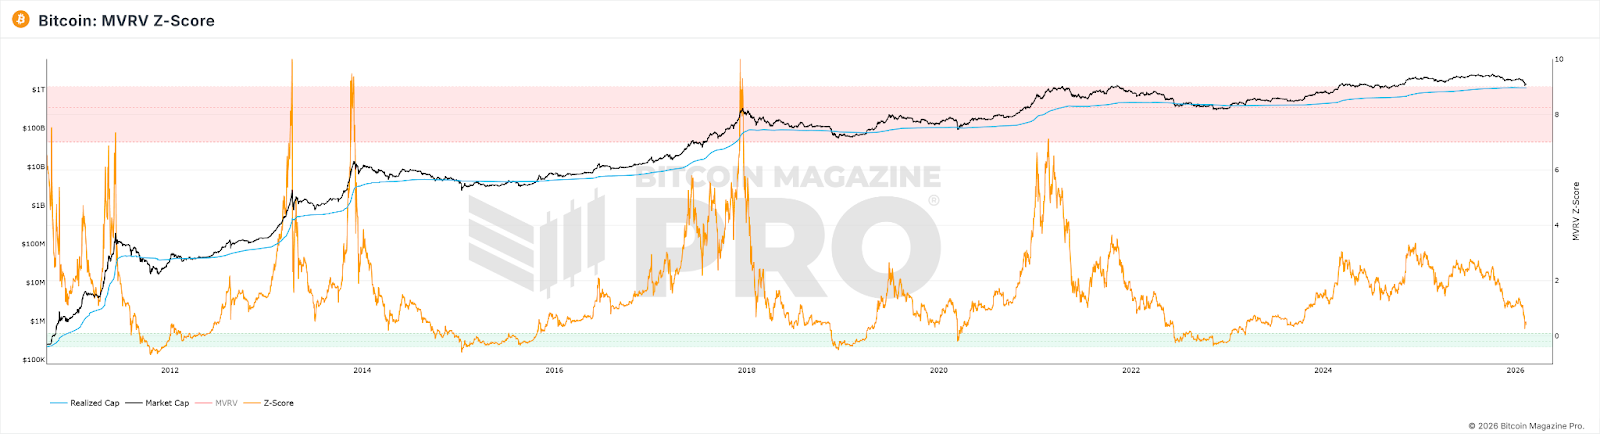
В плане表現, даже на пике бычьего рынка 2021 года Z-Score не достиг высот предыдущих циклов, традиционные фиксированные пороги (>7) больше не срабатывали. К 2025 году, хотя цена биткоина достигла пика, максимальное значение Z-Score составило всего 2,69.
Исследуя причины, можно выделить следующие аспекты:
1. Институциональные инвесторы покупали по высоким ценам и держали долгосрочно, что систематически подняло Realized Value до уровня, более близкого к рыночной стоимости, сжав пространство для колебаний MVRV.
2. Частые перемещения краткосрочных активных трейдеров持续 "обновляли" RV активного предложения до уровней, близких к текущей цене, further сужая разрыв между MV и RV.
3. После увеличения размера рыночной капитализации для достижения тех же экстремальных значений Z-Score, что и на ранних этапах, required объем средств grew в геометрической прогрессии.
Результатом наложения этих трех факторов стало: потолок Z-Score был структурно понижен, и originally установленный фиксированный порог "7=перегрев" больше невозможно достичь.
Радужный график: Логарифмическое предположение роста нарушается
Биткоин радужный график (Rainbow Chart) использует логарифмические кривые роста для аппроксимации долгосрочного ценового тренда, разделяя ценовые диапазоны на цветные полосы от "крайне недооценено" до "максимум пузыря", помогая инвесторам определять время для покупки и продажи. В 2017 и 2021 годах достижение ценой верхних цветных полос действительно соответствовало вершинам циклов.
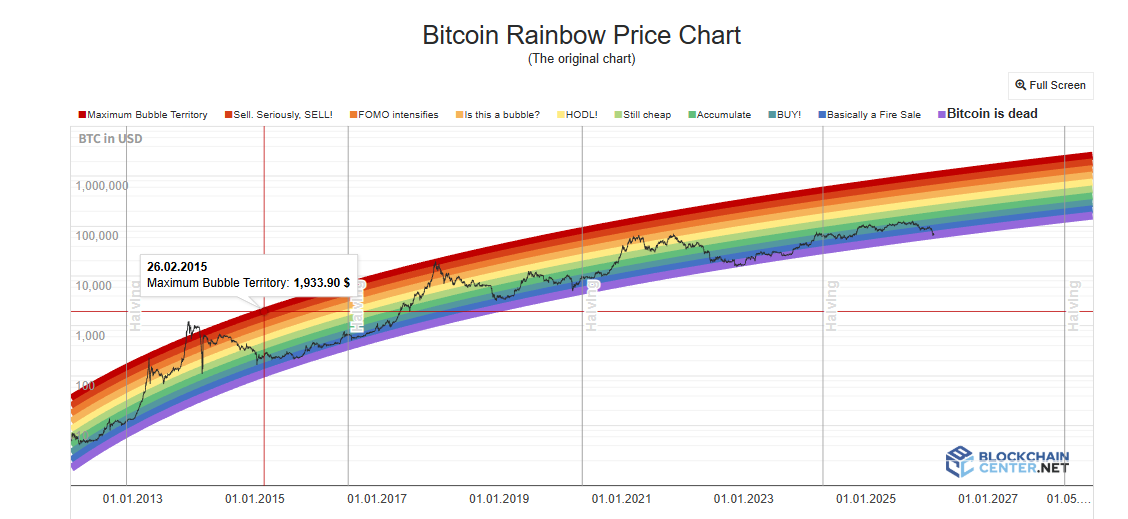
Но на протяжении всего бычьего цикла 2024-2025 годов цена биткоина оставалась лишь в нейтральной зоне "HODL!", никогда не приближаясь к темно-красной зоне, representing экстремальный пузырь. Прогностическая функция вершин графика практически не сработала.
Для индикатора радужного графика, в этой модели цена является лишь функцией времени. Она не учитывает халвинг, ETF, институциональные средства, макрополитику или любые другие переменные. Кроме того, институционализация привела к снижению волатильности, что систематически уменьшило амплитуду отклонения цены от линии тренда, и фиксированные по ширине цветные полосы больше не могут быть достигнуты. Кроме того, рост биткоина переходит от "крутого участка кривой adoption" к "медленному росту зрелого актива", экстраполяция логарифмической функции systematically дает более высокие темпы роста, чем фактические, в результате чего цена长期 находится ниже центральной линии.
Индекс сезона альткоинов и Доминирование BTC: Предпосылки "ротации капитала" изменились
Индекс сезона альткоинов измеряет долю (в процентах) из топ-100 альткоинов, которые за последние 90 дней обогнали по доходности BTC; превышение 75 считается "сезоном альткоинов". Доминирование BTC (доля капитализации BTC в общей капитализации) при падении ниже 50% или даже 40% рассматривается как сигнал перетока капитала из BTC в альткоины. В 2017 году доминирование BTC упало с 85% до 33%, в 2021 году — с 70% до диапазона 40%, что соответствовало масштабным движениям на рынке альткоинов.
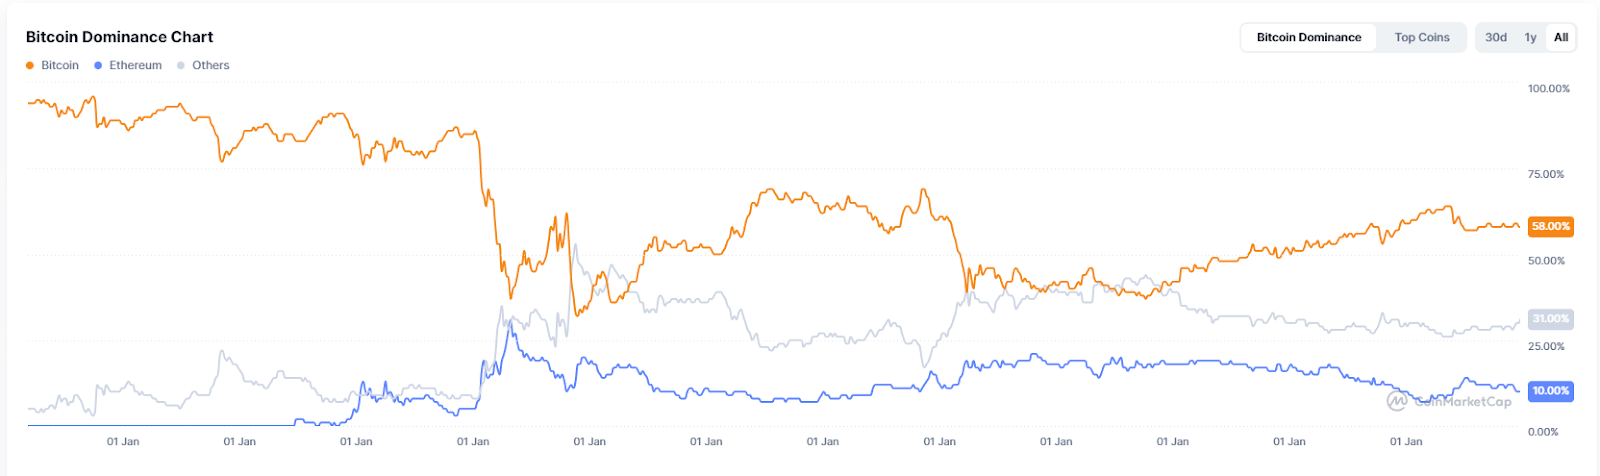
Однако на протяжении всего 2025 года индекс сезона альткоинов长期 оставался ниже 30,持续 находясь в "сезоне биткоина". Доминирование BTC достигло максимума в 64,34% и никогда не падало ниже 50%. К началу 2026 года так называемый "Altseason" больше проявлялся как локальная ротация, driven точечными нарративами, где выигрывали только определенные сектора, такие как AI и RWA, а не повсеместный рост, как в предыдущих двух циклах.
Глубинные причины отказа этих двух индикаторов также кроются в текущей структуре рынка: с доминированием институциональных и ETF-средств, appetite этих средств к риску для биткоина явно выше, чем для альткоинов. Кроме того, значительные объемы капитала были оттянуты ажиотажем вокруг AI и драгметаллов, что и так сократило приток средств на крипторынок. Биткоин-ETF привлекают инкрементальный капитал напрямую в BTC, и эти средства по структуре не "ротируются" в альткоины — держатели ETF покупают финансовый продукт, а не входной билет в криптоэкосистему. Кроме того, истощение нарративов в экосистеме альткоинов и ослабление ликвидностной поддержки новых проектов также являются важными причинами задержки "сезона альткоинов".
Индекс страха и жадности: Настроения розничных инвесторов больше не являются определяющей силой цены
Криптовалютный индекс страха и жадности объединяет несколько факторов, включая волатильность, рыночный импульс, настроения в соцсетях, Google Trends и другие, чтобы получить оценку от 0 до 100. Классическое использование — contrarian стратегия: покупать при сильном страхе, продавать при сильной жадности.
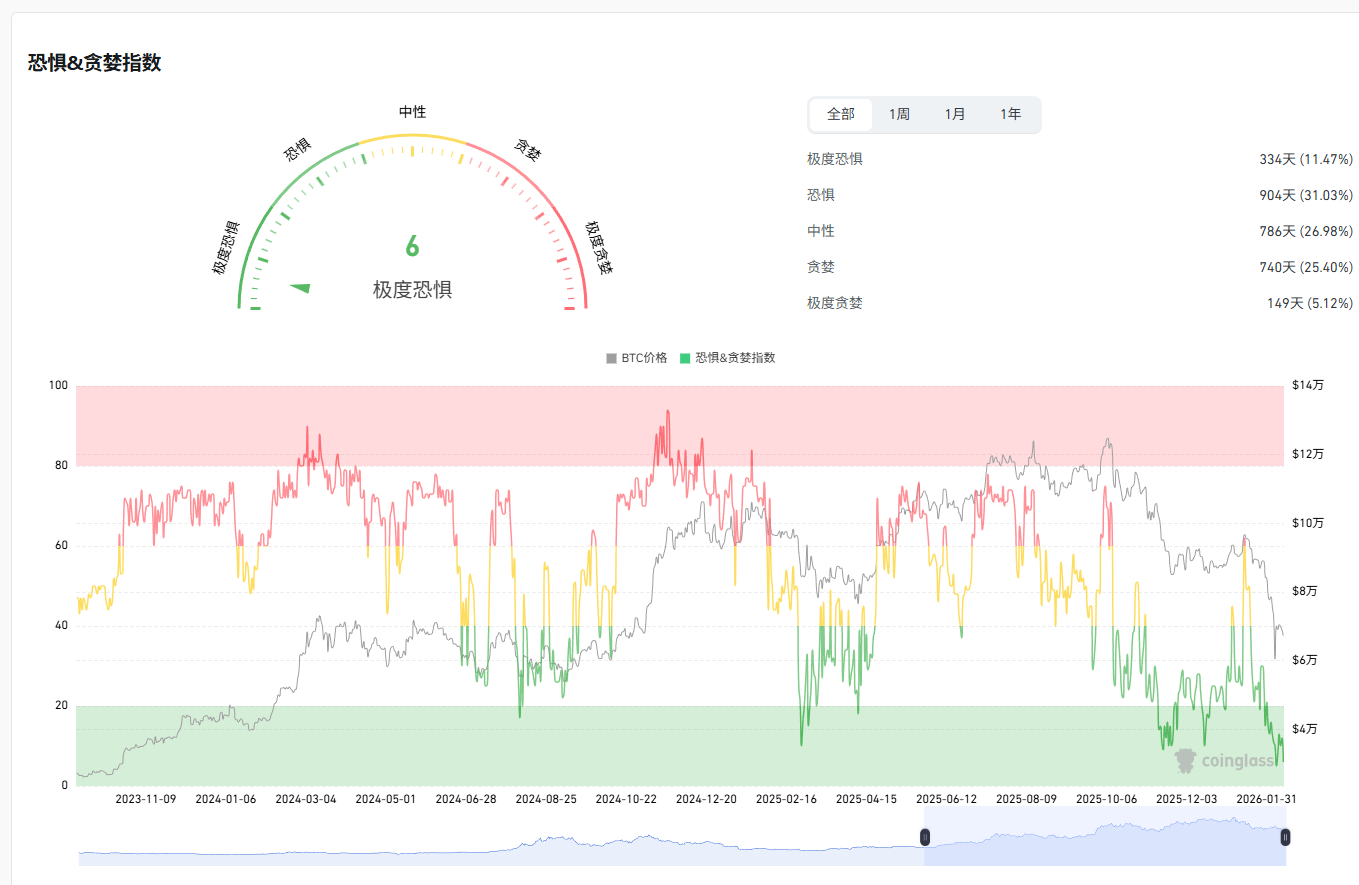
В апреле 2025 года индекс упал ниже 10, что ниже уровня коллапса FTX, но после этого BTC не показал ожидаемого сильного отскока. Годовая 30-дневная средняя составила всего 32, причем 27 дней находилась в зоне страха или сильного страха. Как сигнал вершины индикатор также оказался ненадежным: на пике рынка в октябре 2025 года индекс составлял всего около 70.
Основная причина неэффективности индекса страха и жадности заключается в том, что механизм передачи между настроением и ценой был прерван институциональными деньгами. Когда розничные инвесторы в страхе, институты могут покупать на падении; когда розничные инвесторы жадны, институты могут хеджироваться с помощью деривативов. Это привело к тому, что настроения розницы больше не доминирующей силой изменения цен.
Коэффициент NVT: Ончейн-объем больше не отражает реальную экономическую активность
Коэффициент NVT называют "криптовалютным аналогом P/E ratio". Он рассчитывается как отношение сетевой капитализации к дневному ончейн-объему транзакций. Высокий NVT может означать переоцененность, низкий — недооцененность.
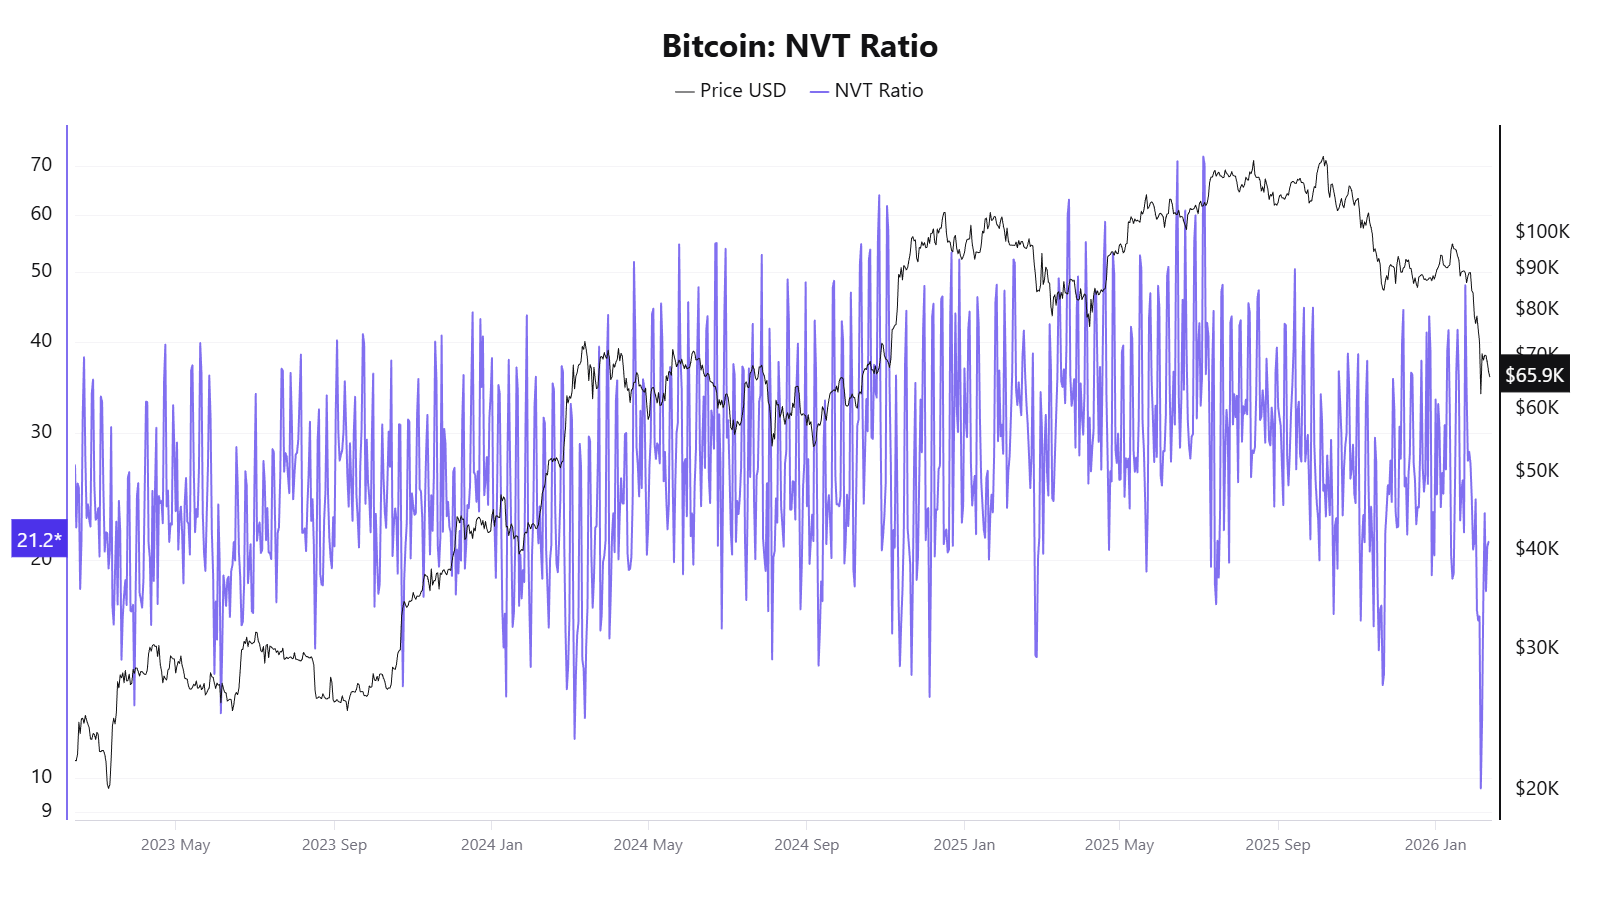
В 2025 году этот индикатор выдавал противоречивые сигналы: в апреле, когда цена еще не significantly выросла, NVT Golden Cross составлял целых 58, а к октябрю, когда цена достигла около 120 000 долларов, он показывал, что цена недооценена.
Коренная причина отказа NVT заключается в его знаменателе — ончейн-объеме транзакций, который больше не может отражать реальную экономическую активность сети биткоин.
Модель S2F: Цена игнорирования спроса
Модель Stock-to-Flow (S2F) была предложена анонимным аналитиком PlanB в 2019 году. Она заимствует логику оценки драгметаллов, используя отношение запаса биткоина к годовому приросту для измерения дефицитности, и с помощью логарифмической регрессии аппроксимирует кривую прогноза цены. Ключевое предположение: после каждого халвинга коэффициент S2F удваивается, и цена должна расти экспоненциально.
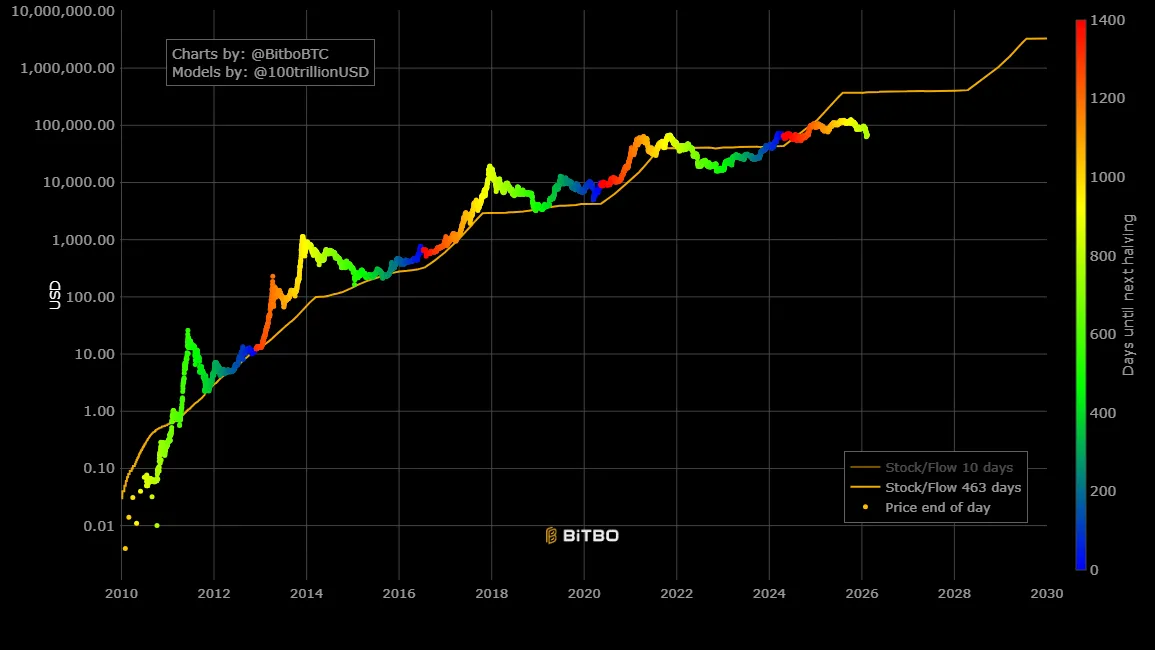
В плане неэффективности: в декабре 2021 года модель прогнозировала, что BTC должен достичь примерно 100 000 долларов, фактическая цена составила около 47 000 долларов, отклонение превысило 50%. В 2025 году целевое значение модели составляло 500 000 долларов, фактическая цена — около 120 000 долларов, разрыв further увеличился до более чем 3 раз.
Коренная причина отказа S2F заключается в том, что это чисто модель стороны предложения, полностью игнорирующая переменные стороны спроса. Кроме того, когда капитализация биткоина достигла триллионного уровня, экспоненциальный рост становится физически все более труднодостижимым, и эффектение diminishing returns — это неизбежная реальность.
Отказали не отдельные показатели, а рыночные предположения, на которых они все rely
Если рассмотреть коллективный отказ этих индикаторов вместе, становится ясно, что их неэффективность — не изолированные事件, а указание на одни и те же структурные изменения:
Институционализация изменила рыночную микроструктуру: биткоин-ETF, корпоративные казначейские allocations, деривативы CME, пенсионные фонды — все together изменили структуру капитала и механизм price discovery. Институты склонны покупать на падениях и держать долгосрочно, сглаживая резкие колебания, driven ранее настроениями розницы. Это привело к тому, что все индикаторы, relying на экстремальную волатильность или эмоциональные сигналы, перестали работать по-старому. А также отток ликвидности с крипторынка due to притяжения капитала в AI и драгметаллы.
Структурное снижение волатильности является прямой технической причиной отказа нескольких индикаторов: Pi Cycle Top, радужный график требуют экстремальных взлетов для triggering сигналов, MVRV требует огромного отклонения рыночной стоимости от cost basis, funding rates требуют экстремального дисбаланса long/short. Когда волатильность падает со 100% до 50%, эти условия становится harder выполнить.
"Тип актива" биткоина мигрирует: от цифрового товара к макрофинансовому активу. Драйверы цены биткоина смещаются от ончейн-переменных (халвинг, ончейн-активность) к макрофакторам, таким как политика ФРС, глобальная ликвидность, геополитика. Индикаторы, focused на анализе ончейн-данных, сталкиваются с рынком, который все больше определяется внеchain-факторами.
Репрезентативность самих ончейн-данных снижается: транзакции Layer 2, внутренние расчеты на биржах, модели хранения ETF — все эти тенденции размывают data foundation ончейн-индикаторов, делая такие показатели, как NVT, MVRV, все менее способными уловить полную картину.
Кроме того, большинство классических индикаторов по своей сути являются подгонкой кривой на основе 3-4 циклов халвинга, объем выборки extremely мал, и они легко теряют эффективность после качественного изменения рыночной среды.
Для обычного инвестора коллективный отказ этих индикаторов, возможно,传递ет более простой сигнал: понимание предпосылок и границ применимости каждого индикатора, возможно, более важно, чем поиск универсального прогностического инструмента. Излишняя зависимость от любого отдельного индикатора может привести к ошибкам. На этапе, когда основные правила рынка переписываются, сохранение когнитивной гибкости, возможно, более практично, чем поиск следующего "универсального индикатора".
Twitter:https://twitter.com/BitpushNewsCN
Группа общения в TG比推:https://t.me/BitPushCommunity
Подписка в TG比推: https://t.me/bitpush