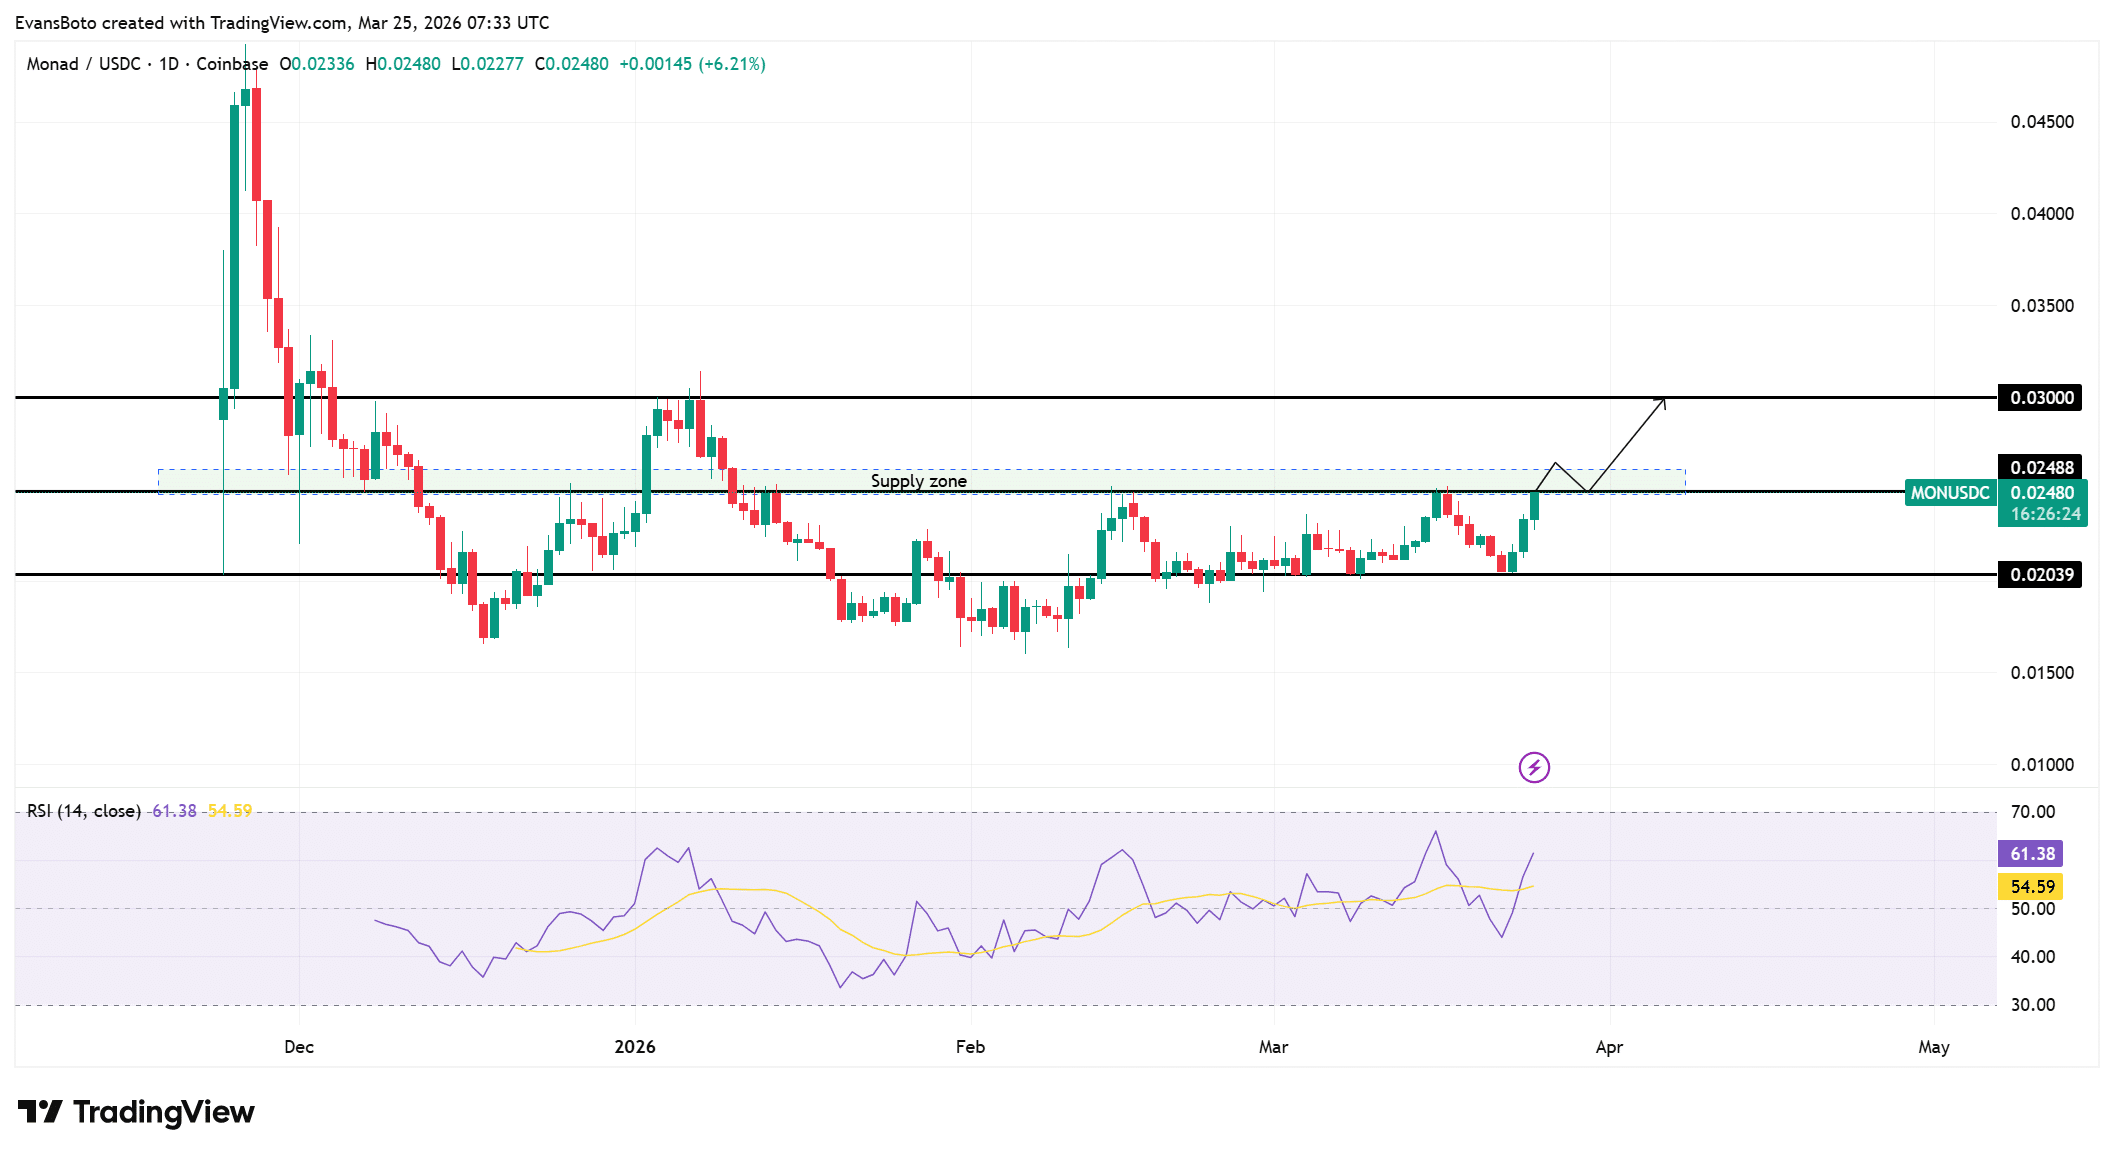
Monad [MON] подорожал на 15%, в то время как объем торгов вырос более чем на 75%, что отражает активное участие по мере роста цены к сопротивлению. Monad торговался около $0,02512 после отскока от недавних минимумов, демонстрируя явное намерение к росту.
Это движение последовало за стабильным восстановлением от консолидации вблизи $0,02039, где покупатели неоднократно вступали в игру. В результате, движение цены теперь отражает усиление спроса, а не случайные скачки.
Однако, рост теперь встречает ключевую зону реакции, где ранее возникало давление продавцов. Такое позиционирование создает критический момент, так как растущая активность совпадает с тестированием MON сопротивления.
Текущая структура предполагает силу, однако реакция в этой зоне определит, продолжится ли движение или остановится.
Сможет ли MON пробить эту зону предложения?
MON вернул поддержку на уровне $0,02039 и продолжает формировать более высокие минимумы, сигнализируя о контролируемом накоплении.
Сейчас он напрямую давит на зону предложения $0,0248, где ранее происходил отскок. Эта структура показывает сжатие под сопротивлением, что часто предшествует расширению, если покупатели сохранят давление.
Однако, повторные тесты без пробоя могут ослабить покупателей. Чистый выход выше $0,0248 откроет путь к уровню $0,0300, который является следующим видимым сопротивлением.
Пока этого не произойдет, цена остается внутри оспорной зоны. То, как ведет себя цена здесь, важнее, чем само движение.
Устойчивое закрытие выше этой зоны подтвердило бы силу, в то время как колебания могли бы спровоцировать возобновление давления продавцов с этого уровня.
RSI на момент написания составлял около 61,38, уверенно удерживаясь выше средней линии и отражая устойчивый контроль покупателей.
Он сохранял эту позицию после постепенного подъема с более низких уровней, демонстрируя структурированную силу, а не резкие скачки.
Такое поведение предполагает, что покупатели продолжают поддерживать цену во время незначительных откатов. Однако, RSI остается ниже зоны перекупленности, что оставляет пространство для дальнейших попыток роста.

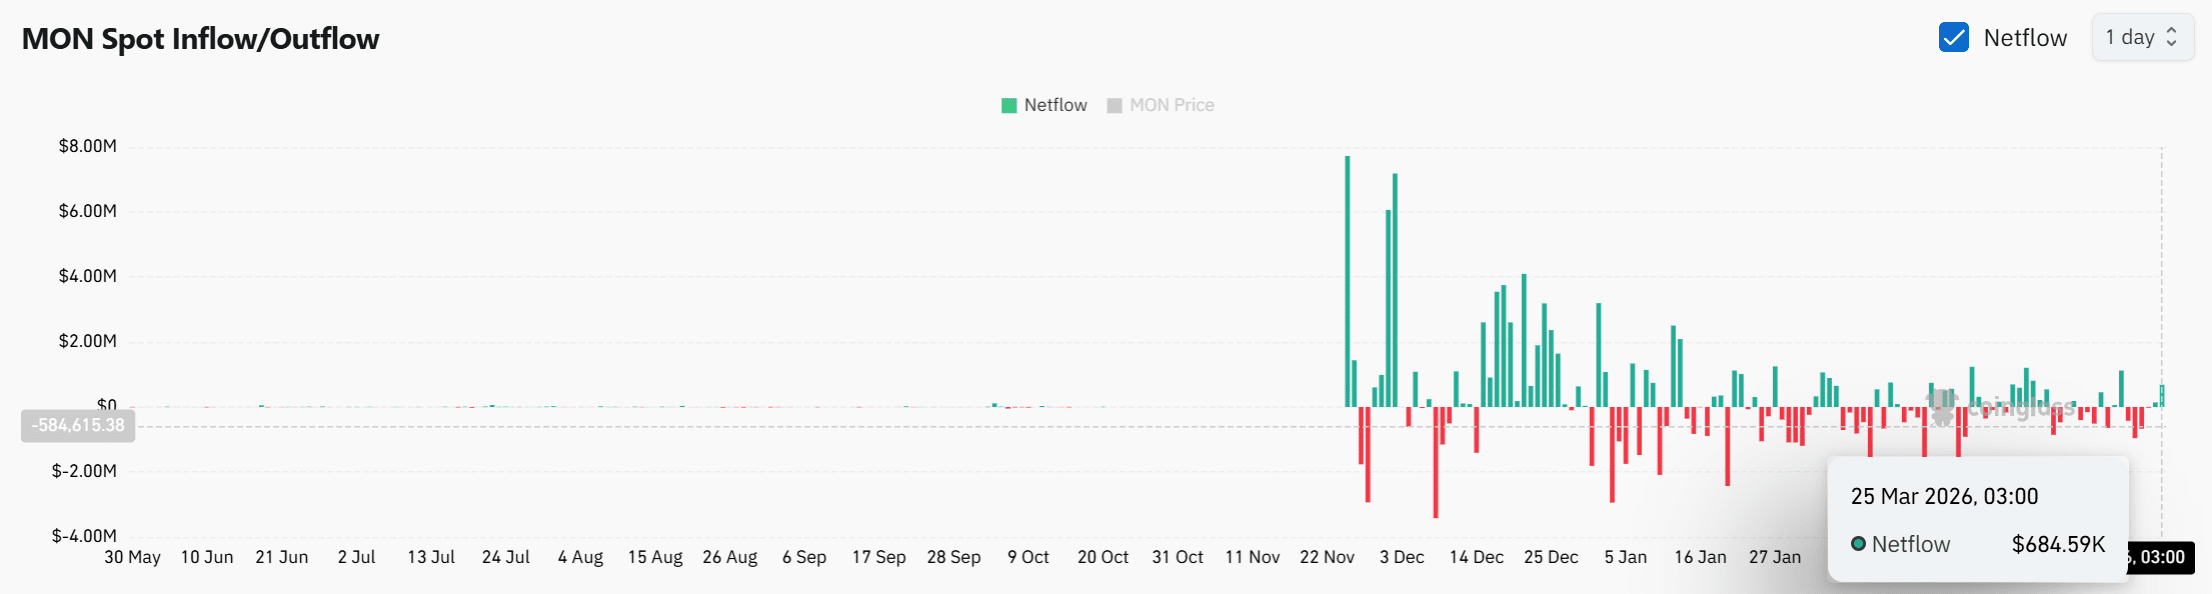
Приток на биржи растет по мере того, как нетто-потоки становятся положительными
Недавние данные о нетто-потоках показывают приток в +$684K, что указывает на возврат токенов на биржи. Этот сдвиг вводит иную динамику по сравнению с более ранними фазами, где доминировали оттоки.
По мере приближения цены к сопротивлению, растущие притоки предполагают, что участники могут готовиться к распределению своих активов.
Такое поведение часто появляется near ключевых уровней, где трейдеры переоценивают позиции. Однако, одни только притоки не подтверждают давление продавцов, если не сохраняются с течением времени.
Время этого притока имеет значение, так как оно совпадает с тестированием предложения ценой. Если притоки продолжат расти, доступность для продажи увеличится.
Если они стабилизируются, воздействие может остаться ограниченным. На данный момент, нетто-потоки отражают осторожный сдвиг, а не прямое распределение.
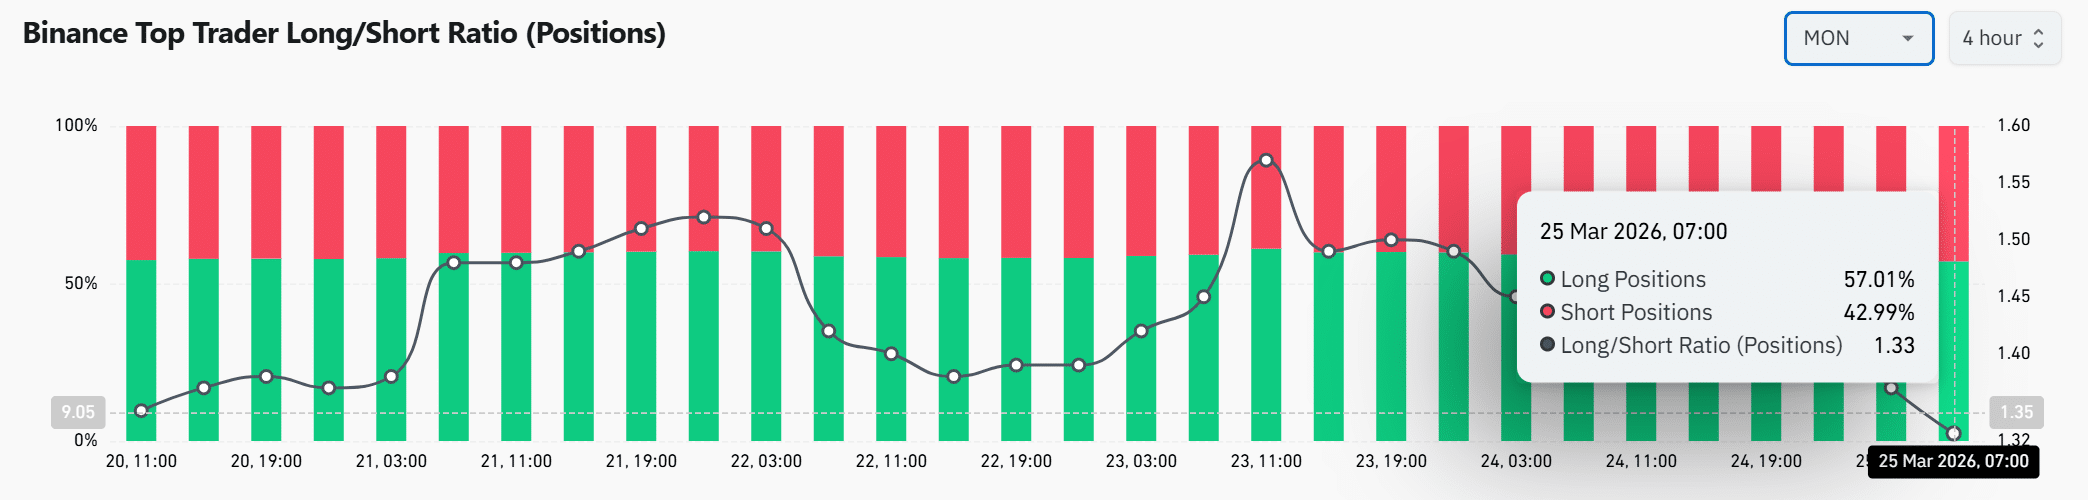
Лонговый уклон сохраняется, поскольку трейдеры агрессивно занимают позиции
Топ-трейдеры Binance сохраняют явный лонговый уклон, с лонговыми позициями на 57,01% и соотношением Long/Short около 1,33.
Такое позиционирование отражает сильную уверенность в направлении продолжения роста. Это показывает, что трейдеры продолжают наращивать экспозицию, даже несмотря на то, что цена тестирует сопротивление.
Однако, повышенное лонговое позиционирование вводит чувствительность к внезапным разворотам. Если цена не сможет пробиться выше, эти позиции могут быстро закрыться. Эта динамика создает leveraged среду, где движения цены могут ускоряться в любом направлении.
Совпадение силы спота и позиционирования на деривативах поддерживает текущий подъем.
Тем не менее, перегруженное позиционирование увеличивает риск в случае смены настроений. На данном этапе трейдеры остаются уверенными, однако setup требует подтверждения от движения цены.
Сможет ли MON поддержать это движение вверх?
MON сможет поддержать это движение вверх только в том случае, если он закрепится выше зоны предложения $0,0248 при продолжающейся поддержке покупателей.
Сила RSI и доминирующее лонговое позиционирование поддерживают продолжение. Однако, растущие притоки на биржи вносят краткосрочный риск продаж.
Если покупатели сохранят контроль и поглотят предложение, цена, вероятно, двинется к $0,0300; в противном случае, отскок спровоцирует контролируемый откат к поддержке $0,02039.
Итоговое резюме
- Устойчивая сила выше сопротивления подтвердила бы продолжение, но растущие притоки на биржи могут нарушить бычью структуру в краткосрочной перспективе.
- Позиционирование трейдеров остается сильно лонговым, что может ускорить рост при подтверждении или спровоцировать резкое падение при инвалидации.


