Latest Stablecoin Report: Real Distribution and Flow Are Far More Important Than Supply

marsbitОпубликовано 2026-02-27Обновлено 2026-02-27

Введение

A new report on stablecoins emphasizes that real-world distribution, holder concentration, and on-chain activity are more meaningful than total supply figures. While the total supply of the top 15 stablecoins reached $304 billion in January 2026, a 49% year-on-year increase, the data reveals deeper insights. USDT and USDC dominate with 89% market share. However, challenger stablecoins like USDS, PYUSD, and RLUSD saw explosive growth. On-chain analysis shows 800 billion held on centralized platforms, while whale wallets hold $39 billion. Concentration is extreme for newer stablecoins; for example, the top 10 wallets hold 90% of USDS and 99% of USDF. Monthly transfer volume hit $10.3 trillion in January 2026, with USDC processing nearly five times more volume than USDT despite a smaller supply. Activity is heavily concentrated in DeFi: $5.9 trillion in DEX liquidity operations and $1.3 trillion in flash loans. Velocity varies widely: USDC on Base moves 14x daily, while large portions of USDT on Ethereum remain idle. The data shows stablecoins are primarily used for trading, leverage, and liquidity, not just as passive holdings.

Author | @Dune

Compiled by | Odaily Planet Daily (@OdailyChina)

Translator | DingDang (@XiaMiPP)

Editor's Note: While the market is still accustomed to using "total supply" to summarize the stablecoin world, a set of more granular data is revealing another layer of reality. A single supply figure can only answer "how much," but it cannot explain "who holds it," "how it flows," or "why it stays." When we observe supply scale, holding concentration, on-chain circulation velocity, and specific activity categories on the same map, what we see is no longer a static stock but a dynamic structure of how capital migrates, settles, leverages, and reprices on-chain.

This perspective is important because it may correct our intuitive judgments about the past year. The crypto market's weakness and the strong performance of U.S. stocks form a stark contrast. The panic amplified by whales selling and price retracements easily gives the impression that capital is fleeing the crypto world. However, the on-chain data presented in this article, along with signals released by Circle's recent financial report, suggest that the funds may not have disappeared; they may have just temporarily withdrawn from high-volatility risk assets. At the very least, on-chain data proves they are entering incentive-based activities rather than being used for trading demand.
Everyone quotes that supply number. It appears in every report, every earnings call, and every policy hearing. But beyond "a circulating scale of over $300 billion," how much do we really know about stablecoins?

Who holds them? How concentrated are the holdings? How fast do they circulate, and on which chains are they mainly active? What are they actually used for—as DeFi liquidity, payment tools, or simply "cash equivalents" for parking funds?

Meta just announced plans to integrate third-party stablecoin payments into its platform; the OCC (Office of the Comptroller of the Currency) approved a national trust bank charter for Stablecoin; Payoneer announced stablecoin functionality for 2 million businesses; Anchorage Digital launched compliant stablecoin services for non-U.S. banks. Institutions and regulators are accelerating their entry, and the answers they need clearly go beyond just a supply number.

We used the latest stablecoin dataset released by Dune—developed in collaboration with Steakhouse Financial—to answer some of these questions. Here are the results revealed by the data.

Supply Overview

As of January 2026, the fully diluted supply of the top 15 stablecoins on EVM, Solana, and Tron reached $304 billion, a year-on-year increase of 49%. Tether's USDT ($197 billion) and Circle's USDC ($73 billion) still dominate with an 89% market share.

Looking at chain distribution, Ethereum carries $176 billion (58%), Tron $84 billion (28%), Solana $15 billion (5%), and BNB Chain $13 billion (4%). Even though the total supply has nearly doubled, this on-chain distribution structure has seen almost no significant change over the past year.
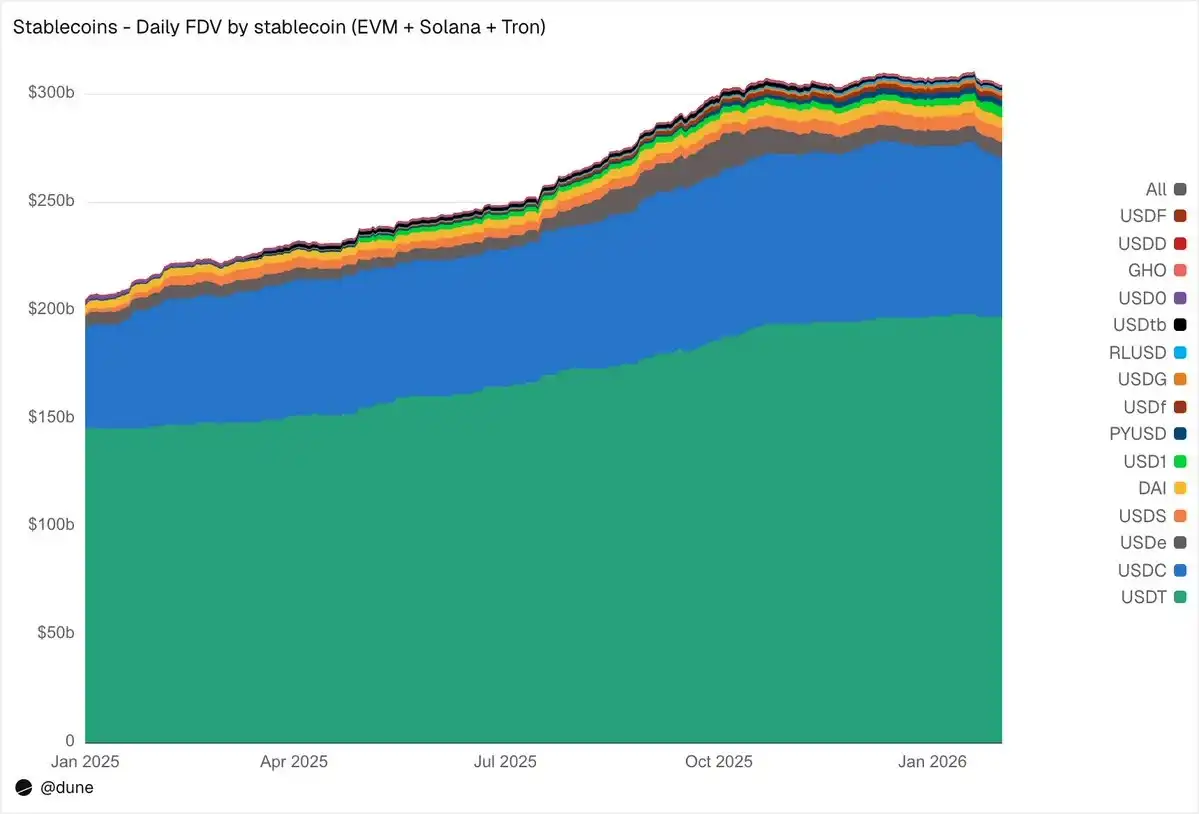
But beneath the top two stablecoins, 2025 was a year of challenger rise. USDS (Sky/MakerDAO) grew 376% to $6.3 billion; PYUSD (PayPal) grew 753% to $2.8 billion; RLUSD (Ripple) jumped from $58 million to $1.1 billion, a staggering increase of 1803%; USDG expanded 52 times; USD1 grew from zero to $5.1 billion.

Of course, not all challengers moved in the same direction. USD0 fell 66%; Ethena's USDe nearly tripled at its October peak, ending the year up 23%. Even so, the competitive layer beneath USDT and USDC has seen a significant increase in the number of competitors.

Who Holds Them?

Most stablecoin datasets can only tell you the total supply. Because our dataset tracks balances at the wallet level and incorporates address labels, we can answer a more critical question: Who is holding these stablecoins?
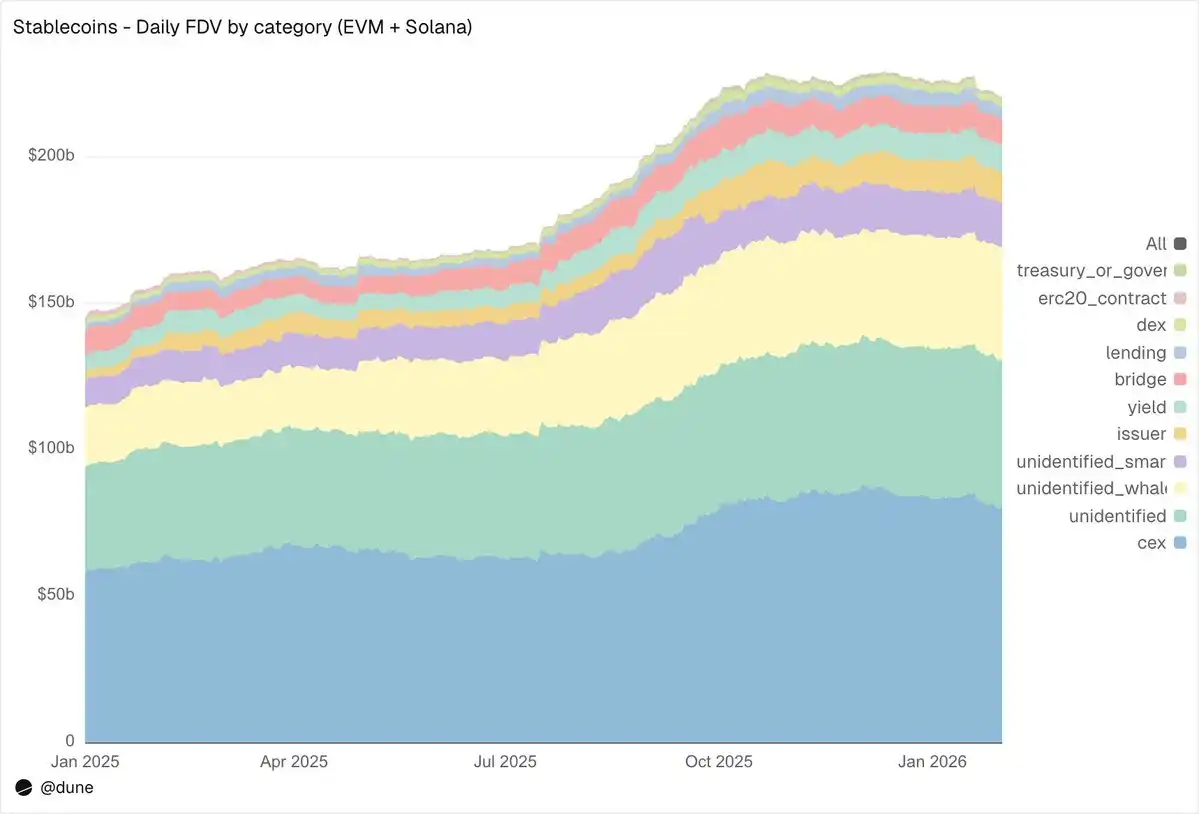
In the EVM and Solana ecosystems, centralized exchanges are currently the largest identified category, holding $80 billion, up from $58 billion a year ago. Stablecoins are, first and foremost, the infrastructure for exchange trading and settlement.

Whale wallets hold $39 billion; holdings in yield protocols almost doubled to $9.3 billion, reflecting the growth of on-chain yield strategies; issuer addresses—including treasuries and minting/burning contracts—jumped from $2.2 billion to $10.2 billion, a 4.6x increase, directly reflecting the scale of new supply entering the market.

Regarding label quality: Only 23% of the supply is in completely unidentified addresses. For on-chain data, this is a fairly high identification rate—and it is crucial for understanding where stablecoin risk is actually distributed.

172 Million Holders, But Extremely Concentrated

As of February 2026, a total of 172 million unique addresses held at least one of these 15 stablecoins. USDT accounts for 136 million, USDC for 36 million, and DAI for 4.7 million. The distribution of these three stablecoins is very wide: The top 10 wallets hold only 23%–26% of the supply, with an HHI (Herfindahl-Hirschman Index, where 0 represents perfect dispersion and 1 represents a single holder) below 0.03.
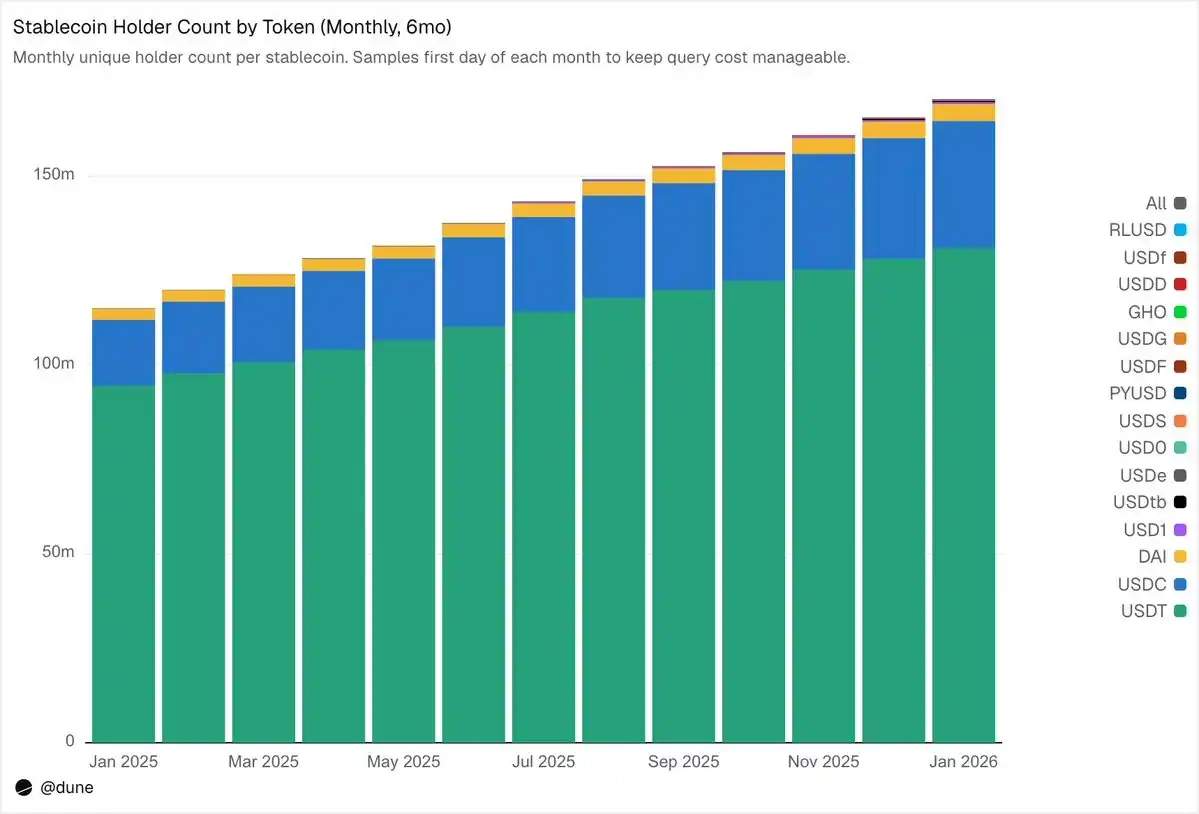
Other stablecoins present a completely different picture. The top 10 wallets often control 60% to 99% of the supply. Taking USDS as an example, although its circulating scale is $6.9 billion, 90% of it is concentrated in 10 wallets (HHI 0.48). USDF's concentration is even higher, with the top 10 addresses holding 99% of the supply (HHI 0.54). As for USD0, it almost reaches an extreme: again, 99% is concentrated in the top 10 wallets, but the HHI is as high as 0.84, meaning even within these top ten, the supply is dominated by one or two addresses.

This does not mean these stablecoins are inherently flawed—some projects are relatively new, and some are designed for institutional clients from the start. But it does mean their "supply" numbers cannot be interpreted in the same way as USDT or USDC. Holding concentration directly impacts de-pegging risk, liquidity depth, and whether the so-called "supply scale" represents real organic demand or merely reflects the allocation behavior of a few large holders. This kind of analysis is only possible when you have the balance data of every holder, not just the aggregate supply derived from minting/burning events.

January 2026: Transfer Volume $10.3 Trillion

In January 2026, the total transfer volume of stablecoins within the EVM, Solana, and TRON ecosystems reached $10.3 trillion, more than double that of January 2025.

The on-chain distribution contrasts sharply with the supply structure: Base led with $5.9 trillion, despite having a supply of only $4.4 billion; Ethereum had $2.4 trillion; Tron had $682 billion; Solana had $544 billion; BNB Chain had $406 billion.
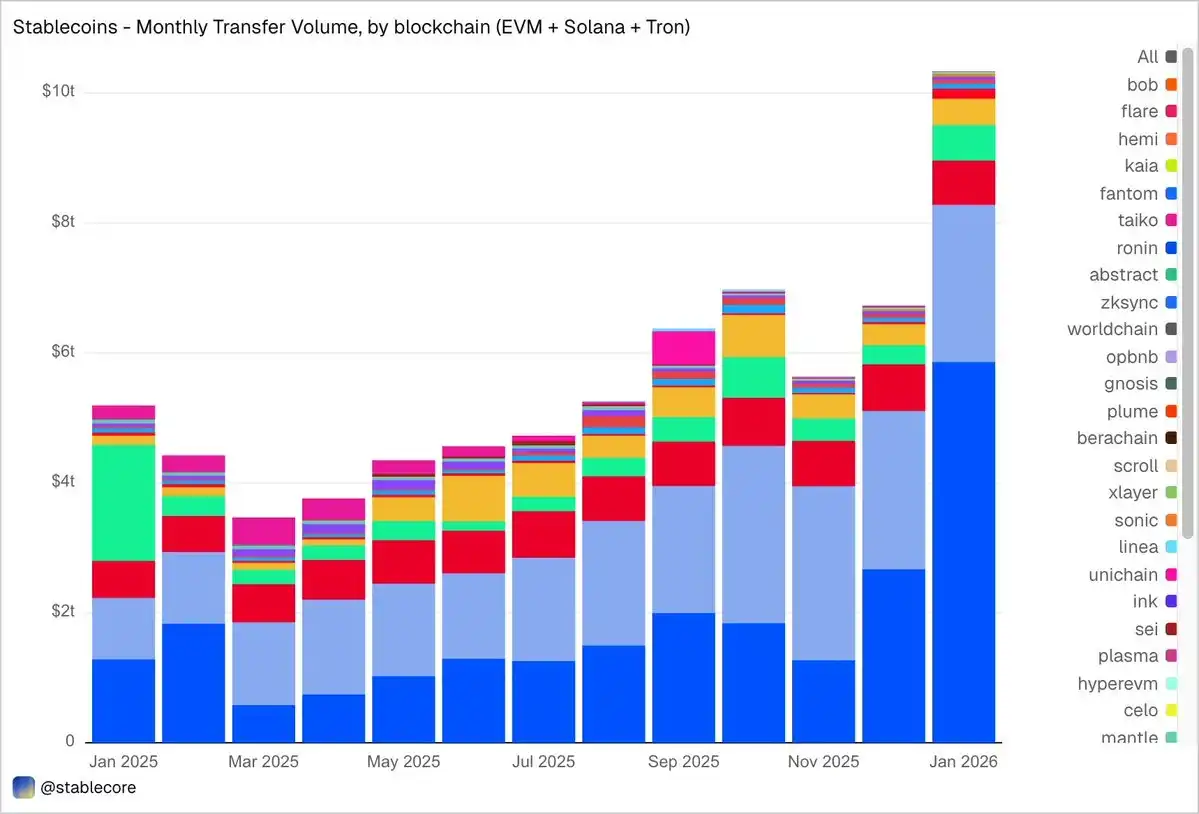
By token, USDC dominated with $8.3 trillion—almost 5 times that of USDT ($1.7 trillion)—even though its supply is only about 1/2.7 of the latter. USDC clearly circulates faster and more frequently. DAI had $138 billion, USDS had $92 billion, and USD1 had $43 billion.

It's important to emphasize that this data is deliberately objective and neutral. The dataset does not pre-filter "real" economic activity based on a fixed standard, so the total volume may include flows generated by automated behaviors like arbitrage, bots, and internal routing. We don't hardcode judgment into the data but provide an objective perspective, allowing users to choose their own filtering methods—whether to exclude bot transactions, identify organic usage, or define transaction activity metrics that better reflect the actual situation.

What Are Stablecoins Actually Doing?

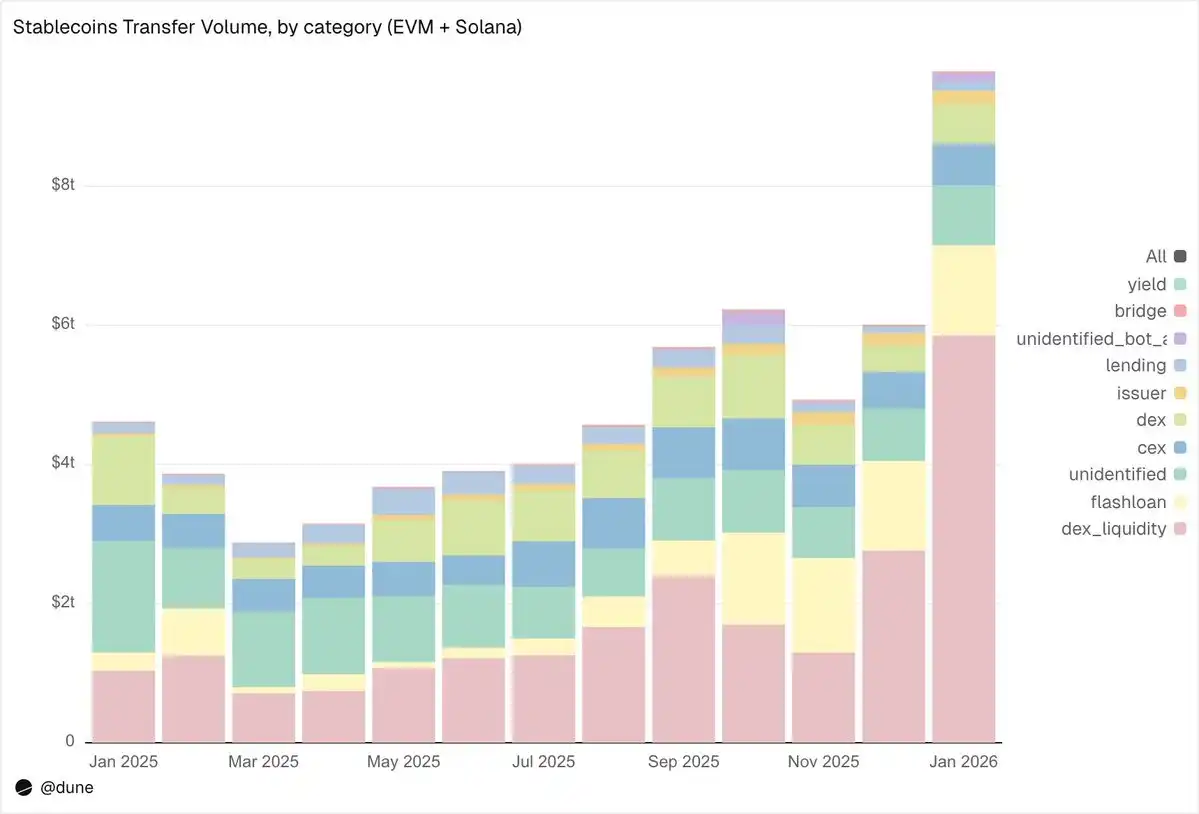
This is where the granularity advantage of this dataset truly shines. Transfers are not simply labeled as "amount" but are categorized into different activity types based on the on-chain triggering mechanism. This means we not only know "$10 trillion flowed" but also "why it flowed."
1. Market Infrastructure (DEX Trading & Liquidity)

  • DEX Liquidity Supply & Withdrawal: $5.9 trillion—The largest application, reflecting the role of stablecoins as base assets for on-chain market making.
  • DEX Swaps: $376 billion—Direct trading activity on automated market makers.

Together, they indicate that stablecoins are primarily trading collateral and liquidity infrastructure. Interestingly, the volume is more concentrated in incentive-driven liquidity mining and active capital optimization activities rather than pure trading demand.

2. Leverage & Capital Efficiency (Lending + Flash Loans)

  • Flash Loans (Borrow and Repay): $1.3 trillion—Automated arbitrage and liquidation loops.
  • Lending Activities (Deposit, Lend, Repay, Withdraw): $137 billion—Represents the on-chain short-term capital efficiency and structured credit layer.

3. On/Off Ramps (CEX & Bridges)

  • CEX Flows—Deposits ($224 billion), Withdrawals ($224 billion), Internal Transfers ($151 billion): Total $599 billion.
  • Bridge Deposits/Withdrawals: $28 billion—Shows the function of stablecoins as settlement channels between cross-chain and centralized platforms.

4. Issuance Layer (Monetary Operations)

  • Issuer Operations—Minting ($28 billion), Burning ($20 billion), Peg Rebalancing ($23 billion), and other operations: Total $106 billion, nearly 5 times the $42 billion a year ago.

5. Yield Protocols

  • Yield Protocol Activity: $2.7 billion—Small in scale but significant in structured strategies and on-chain asset management.

Overall, 90% of the transfer volume flows through identified activity categories, providing us with a fine-grained view across all layers of the entire on-chain stack.

Velocity of Circulation: Same Coin, Different Worlds

Daily Velocity of Circulation (Volume divided by Supply) is perhaps the most overlooked metric in stablecoin analysis. It reveals whether a stablecoin is actively used as a medium of exchange or merely held.

Among the tokens we analyzed, USDC and USDT stand out again, but exhibit different characteristics.
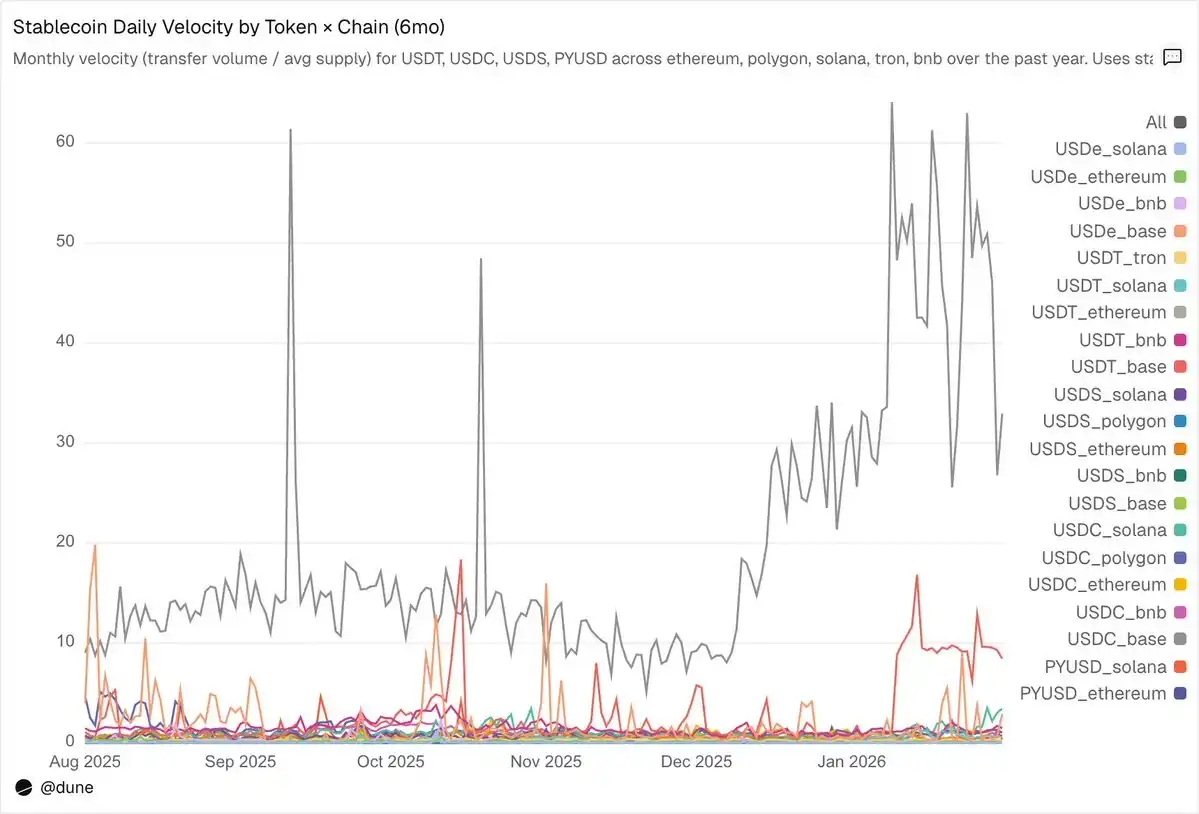
USDC circulates fastest on L2 and Solana. On Base, USDC's average daily velocity reaches 14x—an astonishing figure driven by high-frequency DeFi activity; on Solana and Polygon, it's about 1x; on Ethereum, it also reaches 0.9x, meaning almost the entire supply turns over daily.

USDT is fastest on BNB Chain and Tron. It reaches 1.4x on BNB Chain, reflecting active trading; on Tron, it's 0.3x, the volume is lower but exceptionally stable, consistent with its role as a main channel for cross-border payments. On Ethereum, however, USDT is only 0.2x, with over $100 billion of supply mostly sitting idle.

USDe and USDS are slower, but by design. USDe's average daily velocity on Ethereum is only 0.09x; USDS is 0.5x. Both are yield-bearing stablecoins: USDe is often staked as sUSDe to capture收益 from Ethena's delta-neutral strategy; USDS is deposited into Sky's savings rate mechanism to obtain protocol-subsidized yields. Therefore, a large portion of the supply remains in savings contracts, lending markets like Aave, or structured yield loops. Low velocity here is not a flaw but a feature—these assets are designed to accumulate yield, not to circulate frequently.

Chain differences are often more important than the token itself. The same PYUSD has a daily velocity of 0.6x on Solana, four times its velocity on Ethereum (0.1x). The same token exhibits completely different usage patterns in different ecosystems.

Supply and transfer volume each tell part of the story, while velocity connects the two—it reveals whether the stablecoin on a given chain is active infrastructure or sleeping capital.


Трендовые криптовалюты

Связанные с этим вопросы

QWhat is the total fully diluted supply of the top 15 stablecoins as of January 2026, and which two dominate the market?

AThe total fully diluted supply of the top 15 stablecoins is $304 billion. Tether's USDT ($197 billion) and Circle's USDC ($73 billion) dominate the market with an 89% combined share.

QAccording to the data, which blockchain hosts the largest portion of stablecoin supply and what is its share?

AEthereum hosts the largest portion of stablecoin supply at $176 billion, representing 58% of the total.

QWhat does the data reveal about the concentration of holdings for stablecoins other than USDT and USDC?

AFor stablecoins other than USDT and USDC, holdings are extremely concentrated. The top 10 wallets often hold 60% to 99% of the supply, with some like USDF and USD0 having 99% concentration and a very high HHI index, indicating dominance by just one or two addresses.

QWhat was the total stablecoin transfer volume in January 2026, and which stablecoin accounted for the majority of this volume despite having a smaller supply?

AThe total stablecoin transfer volume in January 2026 was $10.3 trillion. USDC accounted for the majority of this volume at $8.3 trillion, which is nearly 5 times that of USDT ($1.7 trillion), even though its supply is only about 1/2.7 that of USDT.

QWhat is the significance of the velocity metric in stablecoin usage, and how does USDC's velocity on Base compare to USDT's on Ethereum?

AThe velocity metric (transfer volume divided by supply) reveals whether a stablecoin is actively used as a medium of exchange or simply held. USDC on Base has an extremely high daily velocity of 14x, driven by high-frequency DeFi activity. In contrast, USDT on Ethereum has a much lower velocity of 0.2x, indicating that over $100 billion of its supply is largely idle.

Похожее

В результате взлома Coldcard, одного из крупнейших взломов биткоин-кошельков за последнее время, началась новая волна убытков! Убытки растут

В результате взлома Coldcard, одного из крупнейших взломов биткоин-кошельков за последнее время, произошла третья волна атак. Исследовательская компания Galaxy Research сообщает, что из кошельков, созданных на этих устройствах, было выведено еще 207,73 BTC. Общие потери теперь составляют около 1367 BTC (примерно 88,6 млн долларов США) по 4585 адресам. Первые две волны атак демонстрировали схожие черты, что указывало на одного злоумышленника. Однако третья волна отличается по методам: используются отдельные адреса для каждой жертвы, адреса P2WSH вместо P2WPKH, и атака нацелена на стандартный путь генерации. Это может означать либо модификацию инструментов первоначальным взломщиком, либо появление нового. Похищенные биткоины, общая стоимость которых оценивается в 88,6 млн долларов, пока не были потрачены злоумышленниками. Анализ показывает, что потери в основном пришлись на кошельки с небольшим балансом, что характерно для индивидуальных пользователей, а не институциональных сервисов. Уязвимое ПО Coldcard было выпущено 17 марта 2021 года, и все украденные средства были созданы после этой даты.

cryptonews.ru42 мин. назад

В результате взлома Coldcard, одного из крупнейших взломов биткоин-кошельков за последнее время, началась новая волна убытков! Убытки растут

cryptonews.ru42 мин. назад

Trump Media продаёт ещё 2628 BTC, запасы снижаются до 4261 BTC

Компания Trump Media & Technology Group (TMTG), стоящая за социальной сетью Truth Social, продолжает сокращать свои вложения в Bitcoin. По данным аналитической платформы Lookonchain, компания продала ещё 2628 BTC на сумму около 165 миллионов долларов через платформу Crypto.com. Это продолжение серии продаж, начавшихся семь месяцев назад. Всего за этот период TMTG продала 7281 BTC на общую сумму примерно 545 миллионов долларов по средней цене 74 855 долларов за монету. Первоначально компания приобрела 11542 BTC по средней цене 118 522 доллара. После последних транзакций её резервы сократились до 4261 BTC (около 269,8 миллиона долларов), что на 63% меньше изначальных холдингов. Эти продажи происходят на фоне усиленного внимания законодателей к криптовалютным интересам, связанным с Дональдом Трампом. В Конгрессе идут дебаты по закону CLARITY Act, который касается этических норм, владения цифровыми активами и потенциальных конфликтов интересов государственных лиц. Критики указывают на такие проекты, как мемкойны TRUMP и MELANIA, а также на токены World Liberty Financial, связывая политическое влияние с частными криптоинтересами.

cointelegraph1 ч. назад

Trump Media продаёт ещё 2628 BTC, запасы снижаются до 4261 BTC

cointelegraph1 ч. назад

Фуцзянь, Цзиньцзян: супер-единорог в сфере памяти тихо делает своё дело

В провинции Фуцзянь в городе Цзиньцзян, известном производством спортивной обуви, находится перспективная компания в области производства чипов памяти — Fujian Jinhua Integrated Circuit Co. (Jinhua). Основанная в 2016 году как часть национального плана по развитию полупроводниковой промышленности, компания столкнулась с серьёзными вызовами. В 2018 году она была внесена в санкционный список Министерства торговли США по обвинению в промышленном шпионаже в пользу американской компании Micron, что привело к остановке производственной линии. После пяти лет судебных разбирательств в феврале 2024 года федеральный суд в Сан-Франциско полностью оправдал Jinhua, сняв все обвинения. Несмотря на правовую победу, компания всё ещё остаётся в санкционном списке, а годы задержек серьёзно замедлили её развитие. Под руководством своего ключевого инженера Чэнь Чжэнкуня, известного как «мастер эффективности», компания сумела адаптировать производство, увеличив долю отечественного оборудования. В отличие от ChangXin Memory Technologies (CXMT) и Yangtze Memory Technologies (YMTC), которые продвинулись дальше в производстве DRAM и NAND-памяти соответственно, Jinhua сосредоточена на специализированной (нишевой) DRAM-памяти для потребительской электроники. Её текущая производственная мощность составляет около 40 000 пластин в месяц. Хотя её доход в 2023 году оценивался примерно в 2 млрд юаней, что значительно меньше, чем у конкурентов, компания остаётся важным игроком. История Jinhua тесно связана с амбициозной промышленной трансформацией города Цзиньцзян. Местные власти оказали компании полную поддержку, включая финансовые гарантии и создание кластера, что демонстрирует стратегическую важность проекта для региона. Несмотря на то, что Jinhua упустила первые годы бума на рынке памяти, её устойчивость в условиях санкций показывает потенциал для восстановления в новом цикле роста, движимом развитием искусственного интеллекта.

marsbit1 ч. назад

Фуцзянь, Цзиньцзян: супер-единорог в сфере памяти тихо делает своё дело

marsbit1 ч. назад

Почему биткойн-фермы внезапно стали новым входом для вычислительных мощностей ИИ на фоне дефицита электроэнергии в 38 ГВт?

Заголовок: Почему майнинговые фермы для биткоина внезапно стали новым входом для вычислительных мощностей ИИ на фоне дефицита электроэнергии в 38 ГВт? Краткое содержание: Когда конкуренция между центрами обработки данных ИИ сместилась с вопроса «кто купит больше GPU» к «кто раньше получит электроэнергию», некоторые майнинговые фермы для биткоина, ранее считавшиеся волатильными активами, начали трансформироваться в центры обработки данных для облачных провайдеров, используя свои готовые возможности подключения к сети, землю и трансформаторные подстанции. По расчетам Morgan Stanley, в период 2026-2028 годов в США может возникнуть дефицит электроэнергии для ЦОДов около 38 ГВт, и модернизация старых майнинговых ферм может обеспечить от 10 до 19 ГВт. Такие компании, как TeraWulf и Hut 8, переориентируются с добычи криптовалют на предоставление инфраструктуры («Powered Shell Provider»), предлагая клиентам из сферы ИИ критически важный ресурс — возможность быстрее конкурентов развернуть значительные вычислительные мощности. Ключевой ценностью становится не вычислительная мощность для майнинга, а дефицитный доступ к электросетям, получение которого «с нуля» в некоторых регионах США теперь может занять 5-7 лет.

华尔街日报1 ч. назад

Почему биткойн-фермы внезапно стали новым входом для вычислительных мощностей ИИ на фоне дефицита электроэнергии в 38 ГВт?

华尔街日报1 ч. назад

Майкл Сэйлор: «Мы никогда не говорили, что никогда не будем продавать биткоины»

Председатель стратегической комиссии Майкл Сэйлор прокомментировал сообщения о новом разрешении компании Strategy на продажу биткоинов. Он заявил, что данное разрешение не является новым — оно было объявлено ещё 29 июня в рамках системы управления капиталом компании. Соглашение позволяет продавать BTC на сумму до 5 миллиардов долларов для определённых целей, но не обязывает компанию к продаже. Сэйлор подчеркнул, что Strategy никогда официально не брала на себя обязательство никогда не продавать свои биткоины, хотя и рассчитывает оставаться чистым покупателем BTC в долгосрочной перспективе. Он назвал текущие новости «старыми», переподанными как новые, и подтвердил, что программа монетизации биткоинов компании не предполагает обязательной продажи её активов.

cryptonews.ru2 ч. назад

Майкл Сэйлор: «Мы никогда не говорили, что никогда не будем продавать биткоины»

cryptonews.ru2 ч. назад

Торговля

Спот

Популярные статьи

Как купить FLOW

Добро пожаловать на HTX.com! Мы сделали приобретение Flow (FLOW) простым и удобным. Следуйте нашему пошаговому руководству и отправляйтесь в свое крипто-путешествие.Шаг 1: Создайте аккаунт на HTXИспользуйте свой адрес электронной почты или номер телефона, чтобы зарегистрироваться и бесплатно создать аккаунт на HTX. Пройдите удобную регистрацию и откройте для себя весь функционал.Создать аккаунтШаг 2: Перейдите в Купить криптовалюту и выберите свой способ оплатыКредитная/Дебетовая Карта: Используйте свою карту Visa или Mastercard для мгновенной покупки Flow (FLOW).Баланс: Используйте средства с баланса вашего аккаунта HTX для простой торговли.Третьи Лица: Мы добавили популярные способы оплаты, такие как Google Pay и Apple Pay, для повышения удобства.P2P: Торгуйте напрямую с другими пользователями на HTX.Внебиржевая Торговля (OTC): Мы предлагаем индивидуальные услуги и конкурентоспособные обменные курсы для трейдеров.Шаг 3: Хранение Flow (FLOW)После приобретения вами Flow (FLOW) храните их в своем аккаунте на HTX. В качестве альтернативы вы можете отправить их куда-либо с помощью перевода в блокчейне или использовать для торговли с другими криптовалютами.Шаг 4: Торговля Flow (FLOW)С легкостью торгуйте Flow (FLOW) на спотовом рынке HTX. Просто зайдите в свой аккаунт, выберите торговую пару, совершайте сделки и следите за ними в режиме реального времени. Мы предлагаем удобный интерфейс как для начинающих, так и для опытных трейдеров.

853 просмотров всегоОпубликовано 2024.03.29Обновлено 2026.06.02

Как купить FLOW

Обсуждения

Добро пожаловать в Сообщество HTX. Здесь вы сможете быть в курсе последних новостей о развитии платформы и получить доступ к профессиональной аналитической информации о рынке. Мнения пользователей о цене на FLOW (FLOW) представлены ниже.

活动图片