Поскольку Bitcoin (BTC) продолжает торговаться ниже ключевой отметки в $90 000 без признаков восстановления, перспектива медвежьего рынка становится все более актуальной. Аналитик Woominkyu из CryptoQuant поделился инсайтами, предполагающими, что текущая рыночная динамика указывает на переход, а не просто на временный откат.
Может ли Bitcoin переходить в медвежью фазу?
В недавно выпущенном отчете Woominkyu изучил Индикатор Моментума Цикла Bitcoin (BCMI), отметив, что его возвращение в зону 0.5 21 октября было истолковано как фаза охлаждения, а не как признак рыночного пика.
В течение недель после этого наблюдения цена Bitcoin заметно снизилась наряду с аналогичным падением BCMI, что позволяет предположить, что рынок не только переживает период охлаждения, но также перезагрузился с точки зрения цены и ончейн-моментума.
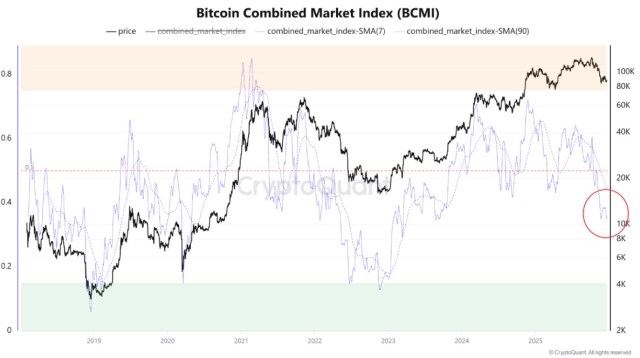
Исторически значимые дна цикла для Bitcoin в 2019 и 2023 годах происходили, когда уровни BCMI падали в диапазон от 0.25 до 0.35. Эти уровни часто ассоциируются с полным сжатием настроений и структурной перезагрузкой на рынке.
В настоящее время, хотя BCMI остается ниже равновесия, как видно на графике выше, он все еще выше исторических зон дна. Эти данные позволяют предположить, что Bitcoin может переходить в медвежью фазу, а не восстанавливаться после простого отката.
По словам Woominkyu, более стабильное дно может сформироваться только в том случае, если BCMI вернется к уровням, наблюдавшимся в предыдущих циклах с 2019 по 2023 год.
Условия медвежьего рынка
В отдельном анализе CryptoQuant указал, что спрос на Bitcoin резко снизился, что подтверждает идею медвежьего рынка. В отчете отмечается значительное падение роста спроса на Bitcoin, которое произошло с начала октября 2025 года.
Более того, в отчете подчеркивается, что спрос со стороны институциональных инвесторов и крупных держателей сокращается, а не расширяется. Спотовые биржевые фонды (ETF) Bitcoin в США превратились в чистых продавцов в четвертом квартале 2025 года, распродав примерно 24 000 BTC.
Кроме того, количество адресов, содержащих от 100 до 1000 BTC, которые обычно представляют ETF и казначейские компании, также увеличивается темпами ниже тренда, что отражает ухудшение спроса, которое предшествовало медвежьему рынку 2022 года.
Состояние рынков деривативов further corroborates the weakening appetite for risk. Фандинговые ставки на перпетуальные фьючерсы упали до самых низких уровней с декабря 2023 года.
Исторически такое снижение фандинговых ставок указывает на снижение готовности удерживать длинные позиции, явление, обычно ассоциирующееся с условиями медвежьего рынка , а не с бычьими трендами.
Технический анализ также выявляет ухудшение ценовой структуры Bitcoin, при этом криптовалюта упала ниже своей 365-дневной скользящей средней — ключевого долгосрочного уровня поддержки, который исторически разграничивал бычьи и медвежьи рынки.
Если смотреть вперед, исторические данные позволяют предположить, что дна медвежьего рынка Bitcoin обычно совпадают с его реализованной ценой, которая в настоящее время оценивается примерно в $56 000. Это подразумевает потенциальное снижение примерно на 55% от недавнего исторического максимума.
Промежуточная поддержка ожидается около уровня $70 000, что suggests a relatively shallow bear market compared to previous cycles.

На момент написания BTC торговался на уровне $87 635. Это представляет собой убытки с начала года в размере 10%, а также отставание на 30,5% по сравнению с историческими максимумами чуть выше $126 000.
Featured image from DALL-E, chart from TradingView.com