From Transaction Fees to Stablecoins: The Revenue Drivers and Economic Moats Behind Web3 Business Models

marsbitОпубликовано 2026-07-11Обновлено 2026-07-11

Введение

"From Transaction Fees to Stablecoins: Revenue Drivers and Moats in Verified Web3 Business Models" This analysis explores five established Web3 revenue models, examining their drivers and long-term sustainability. 1. **Transaction Fees**: This model is highly cyclical, with income tied to market activity and user risk appetite (formula: volume × fee rate). Growth depends on expanding the market, gaining market share, and maintaining stable fees amid intense competition. 2. **Stablecoin Reserve Yield**: Revenue stems from the scale of issued stablecoins and the interest earned on their underlying reserves (like US Treasuries). While predictable with strong moats (high user migration costs), growth is tied to adoption as on-chain dollar infrastructure and is sensitive to interest rate cycles. 3. **Funding Rate Arbitrage & Lending Spreads**: Protocols like Aave and Ethena profit from capital supply-demand imbalances. Similar to transaction fees, this model is cyclical and driven by user leverage demand during bullish market phases. 4. **Block Space Sales**: Chains sell computational resources (formula: demand × gas price). A key challenge is the ongoing decline in gas fees due to technological advances and competition among L1s and L2s. Future viability hinges on whether demand growth can offset falling unit prices. 5. **Protocol-Level Service Fees**: Similar to SaaS, this model involves charging other protocols for essential services (e.g., oracles like Chainlink). Revenu...

Author: Eric SJ

Web3 is transitioning from the “user growth era” to the “business model validation era.” In a previous article, I discussed five already-validated Web3 business models:

  • Transaction Fees

  • Stablecoin Reserve Yield

  • Funding Rate Spread

  • Block Space Sales

  • Protocol-Level Service Fees

These models answer the question: How do they make money? But two more critical questions remain:

  • Some revenue streams look “sexy,” but may not be sustainable long-term.

  • Some revenue streams appear slow but may hold greater business value.

A formula to explain: Revenue = User Demand × Usage Scale × Pricing Power × Market Environment

For example, a protocol earning $100 million a year might represent a genuine commercial loop, or it might just be riding a market cycle. The question is the sustainability of that cycle (e.g., the previous Pump).

Money earned during a casino's peak season and money earned from infrastructure rent might both be revenue, but their future prospects differ.

This article will deconstruct these five validated Web3 business models from the perspectives of their revenue drivers and long-term economic moats.

1. Transaction Fee Revenue: Looking at Trading Volume and User Activity

Transaction fees are the easiest-to-understand business model in Web3. The logic is simple: Trading Revenue = Trading Volume × Fee Rate

Thus, the factors influencing revenue are easy to break down.

Trading volume and market activity show a positive correlation, the most obvious variable in the transaction fee model.

In bull markets, asset prices rise, users' willingness to trade increases, leverage demand grows, and trading volume naturally rises. Therefore, revenue for CEXs, DEXs, and Perp DEXs grows rapidly.

But in bear markets, user trading and leverage demand decline simultaneously, and fee revenue also drops significantly.

  • This is why the transaction fee model's revenue is the most cyclical.

At the same time, an increase in trading volume doesn't necessarily mean the business model and its loop are stronger. What's more important is whether your volume comes from genuine user growth or just short-term incentive-driven traffic.

Take Hyperliquid @HyperliquidX as an example. Its future revenue growth depends not only on the overall perpetual contract market size but also on whether it can continue to attract: on-chain traders and market makers, which are the foundation of liquidity.

Because what trading platforms are truly competing for is not the product, but the liquidity network.

Next is the fee rate.

Trading platforms cannot raise fees indefinitely because the fee itself is a competitive tool. When competition intensifies: reducing fees, rebating fees, and increasing user incentives all affect the final revenue.

Therefore, the long-term growth of the transaction fee model requires simultaneously satisfying: market expansion, increasing market share, and stable fee rates.

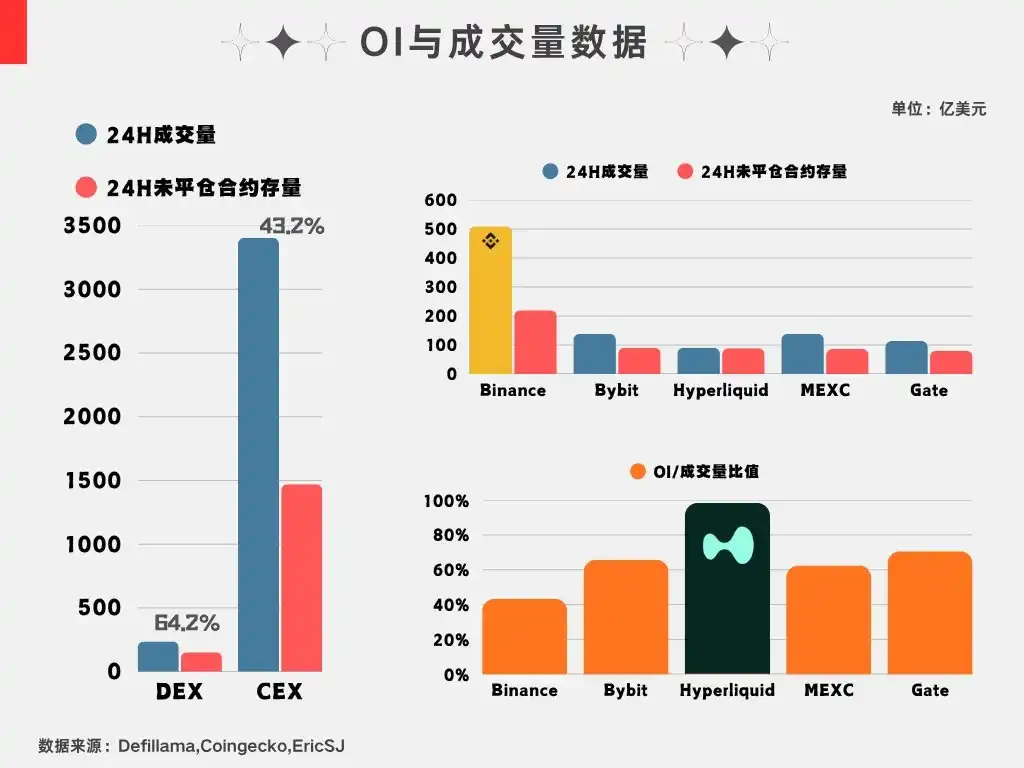
Early DEXs and current Perp DEXs, to compete, have attracted funds into their protocols for trading through 0% fees to increase their market share. But this raises a question worth pondering: When fees return to normal levels, are those funds still willing to stay in the protocol?

The OI indicator is a good parameter. The chart below shows OI data I compiled last month. In the current environment with no major overall changes, this to some extent reflects the willingness of funds to keep their risk exposure in a particular place.
2. Stablecoin Revenue: Primarily Looking at Scale and Interest Rate Environment

The stablecoin reserve yield model is essentially: Revenue = Stablecoin Scale × Reserve Asset Yield Rate. Therefore, the influencing factors are these two.

First, scale, the most critical variable. USDT and USDC revenue come from how much dollar-denominated assets are deposited on-chain.

If the stablecoin supply grows, reserve scale expands, and revenue naturally increases; conversely, if the scale decreases, revenue is also affected.

  • The chart below shows Tether's scale for Q1 2026, achieving approximately $1.04 billion in net profit at such scale.
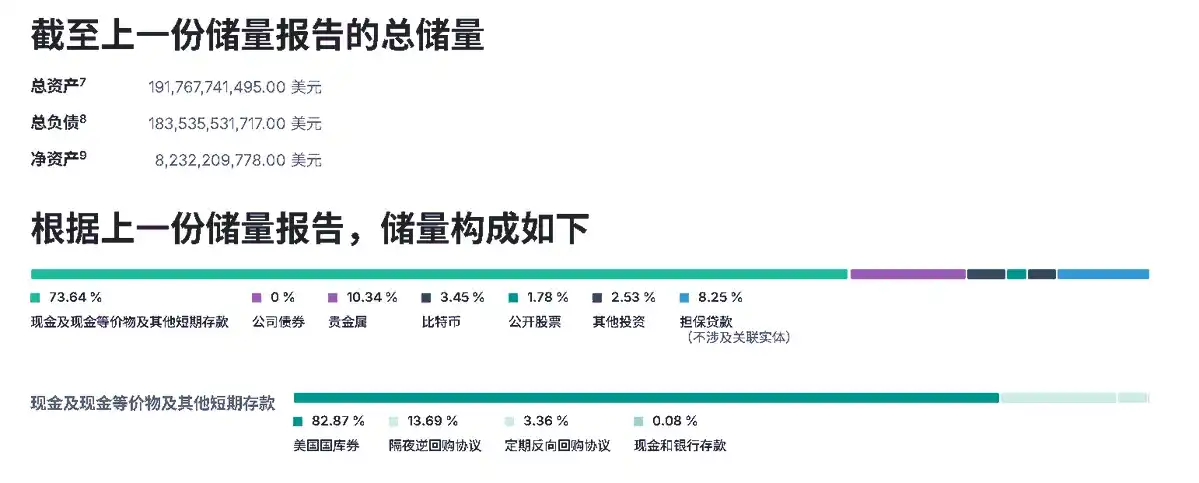
Therefore, the core competition for stablecoins is not just issuing more tokens, but which one can become the dollar infrastructure on-chain. In other words, in the current compliance context, which stablecoin can become the issuance entry point determines the thickness of its future economic moat.

The second factor is the interest rate environment.

Stablecoin issuers typically allocate to: US Treasuries, money market funds, and cash equivalents. Thus, their revenue is highly dependent on the risk-free interest rate. Reserve yield increases in a high-rate environment; it decreases in a low-rate environment.

Therefore, even if stablecoin scale continues to grow, issuer revenue can still be affected by interest rate cycles. However, this model has a remarkable point: it doesn't experience huge volatility, growth is predictable (the flip side is a lack of imagination), and once funds enter, they are not easily moved in the short term.

Moreover, large funds tend to gravitate towards time-tested “brands.” That is, the longer something exists, the thicker its moat becomes, which is why it's increasingly difficult for new stablecoins to capture market share.

And this market is slowly opening up new incremental channels. Once a project is adopted as a traditional entry point onto the chain, it becomes a stable cash cow.

3. Funding Rate Spread Revenue: Looking at Capital Demand and Risk Management

In the funding rate spread model, I previously gave two examples: Aave lending and Ethena funding rate arbitrage.

Their essence is profiting from the supply-demand imbalance of capital.

Take Aave as an example. Revenue comes from borrowing demand. In an uptrend cycle, user risk appetite increases, using loans to amplify leverage further. This is the source of demand, driving capital utilization and protocol revenue growth. The logic is the same as the transaction fee cycle, both stemming from risk appetite.

4. Block Space Revenue: Primarily Looking at On-Chain Activity

The block space sales model is also clear: Revenue = Block Space Demand × Gas Unit Price.

The structure is simple, but it's worth discussing because this model has some revenue expectation issues (in my opinion).

Theoretically, the more on-chain users, transactions, and applications, the higher the block space demand, and revenue naturally increases, because an unused highway has no fee-collecting value.

However, the Gas unit price is a hard constraint. Looking at industry trends, Gas has been on a declining trend, which actually impacts revenue.

Add competition between different chains—Ethereum, Solana, L2s, DA layers all form competitive relationships—and Gas fees become even more competitive. Many chains frequently launch 0-Gas activities to attract liquidity and boost on-chain activity.

This involves a game between demand growth and unit price decline.

Take Ethereum. Two cycles ago, Ethereum's logic was simple: Limited block space → users compete for transaction ordering → demand increases → Gas rises → network revenue increases;
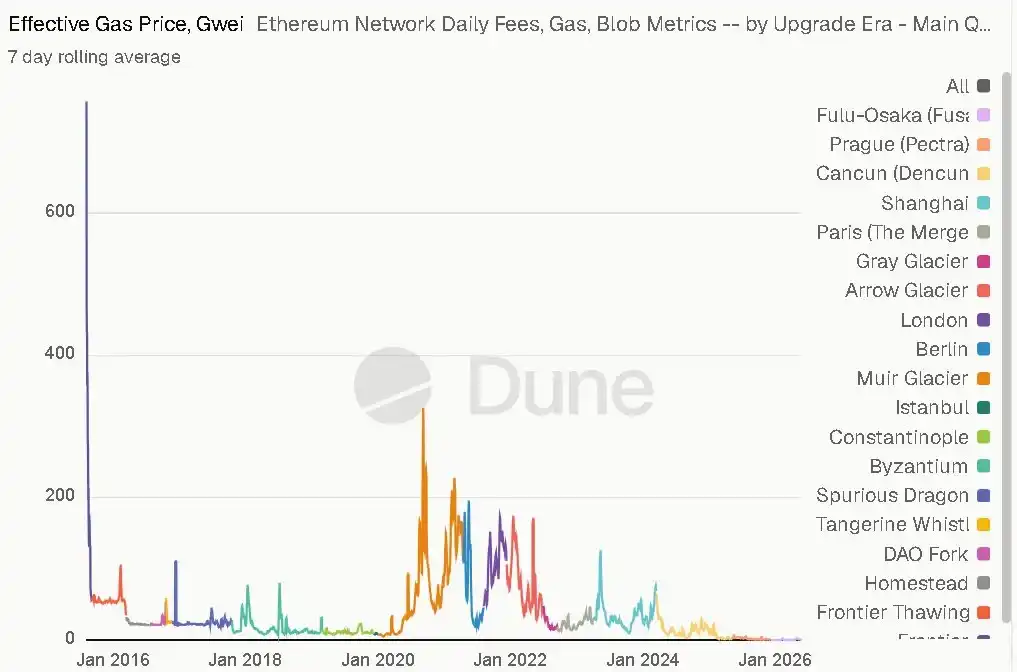
But with the emergence of more chains, improved transaction execution efficiency, and more alternative options in the market, Gas has been driven down. This creates a commercial contradiction:

  • On one hand: More users and applications need block space;

  • On the other hand: Technological advancements continuously reduce block space costs.

For users, this is good because transactions become cheaper. But for chains acting as “block space suppliers”: unit revenue declines.

This is somewhat similar to internet infrastructure development. Early on, bandwidth was scarce and expensive. Later, as bandwidth continually expanded, prices kept falling. Ultimately, market value doesn't solely belong to those providing underlying resources, but concentrates more on those with users, ecosystems, and platform capabilities.

Therefore, the core question for the future block space business model isn't just: “Is there demand?”

But rather: Can demand growth offset the decline in unit price?

5. Protocol-Level Service Fees: Looking at Usage Scale and Positioning

Infrastructure service fees are more like the Web3 version of SaaS. Oracles are a typical example.

Its revenue mainly comes from the B-side: continuous usage by project teams.

The more projects using the protocol, the larger the revenue scale, and migration costs become significant. Once integrated, the cost to replace is high.
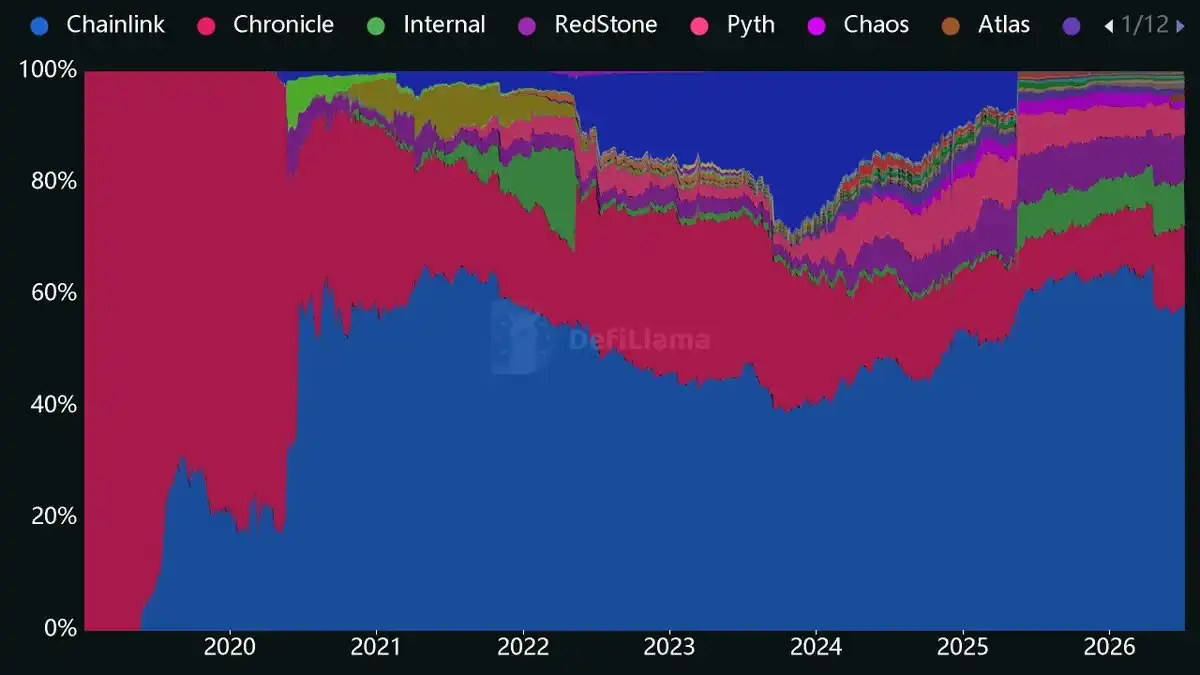
However, there's a prerequisite: it must become the industry standard itself. For example, the current Chainlink occupies well over half of the oracle market share. As a result, other projects in this sector have little competitive space; the moat is very thick. Even if a cheaper product appears, it's difficult to easily displace existing B-side integrations.

This type of infrastructure sells not a one-time product, but rather: an ecosystem position. Therefore, its long-term value depends on: whether more and more projects build around it.

Summary

Comparing the five business models together:

1. Both the transaction fee and funding rate spread models are highly cyclical, driven fundamentally by the risk appetite of on-chain capital.

2. Both the stablecoin reserve yield and protocol-level service fee models, once established, have very thick moats, rooted in the high migration costs on the supply side.

3. The block space sales model faces the persistent issue of declining unit prices. It requires consideration of the trade-off between scale and unit price. Valuing it purely based on revenue is quite unreasonable (at least currently).


Трендовые криптовалюты

Связанные с этим вопросы

QWhat are the main drivers of revenue for the transaction fee model in Web3?

AThe main drivers are trading volume and user activity, which are highly correlated with market cycles. The formula is Transaction Revenue = Trading Volume × Fee Rate. The model is highly cyclical, as trading volume and user leverage demand increase during bull markets and decrease during bear markets.

QWhat are the two core variables that determine the revenue of the stablecoin reserve model?

AThe two core variables are stablecoin scale (circulating supply) and the interest rate environment. Revenue = Stablecoin Scale × Reserve Asset Yield Rate. The model's growth is predictable but lacks high volatility, and it benefits from high switching costs for large capital, creating a thick moat for established players.

QWhat is the central contradiction or business challenge faced by the 'block space selling' revenue model?

AThe central contradiction is the tension between increasing demand for block space and the continuous decline in Gas unit prices due to technological progress (e.g., scaling solutions) and intense competition among different chains. The key question is whether demand growth can outpace the drop in unit price to sustain and grow revenue.

QHow does the moat for a 'protocol-level service fee' model, like an oracle, form?

AThe moat forms by becoming the industry standard. When many projects integrate the service (e.g., Chainlink for oracles), the switching costs for these B2B clients become very high. The revenue depends on the number of projects using it, and its long-term value is tied to its entrenched position in the ecosystem.

QAccording to the article, which revenue models share a similar cyclical nature and underlying driver?

AThe Transaction Fee model and the Funding Spread model (e.g., Aave lending, Ethena) share a strong cyclical nature. Their underlying driver is the risk appetite of on-chain capital, which increases leverage and demand during bullish cycles and decreases during bearish ones.

Похожее

MORPHO тестирует ключевое сопротивление после запуска на Solana — продержится ли прорыв?

Официальный запуск токена Morpho (MORPHO) в сети Solana состоялся 9 июля. На фоне этой новости цена токена выросла на 8,34% за 24 часа при увеличении объема торгов на 105% и открытого интереса на 18%. Ранее Standard Chartered прогнозировал для MORPHO цель в $60. Технический анализ показывает, что с апреля токен торговался в диапазоне $1,64–$2,28. Недавний импульсный рост на 43% начался 23 июня, и RSI подтверждает восходящую динамику. Однако индикатор Accumulation/Distribution остается на низких уровнях, сигнализируя о сохраняющемся давлении продаж. В мае уже дважды происходил ложный пробой верхней границы диапазона с последующим откатом к $1,60. Текущая попытка быков закрепиться выше ключевой зоны сопротивления $2,20–$2,42 пока не подтверждена. Для уверенного сигнала к покупке необходима устойчивая цена выше отметки $2,42 (максимум конца мая). Трейдерам рекомендуется дождаться четкого подтверждения пробоя и иметь план действий на случай повторного разворота.

ambcrypto10 мин. назад

MORPHO тестирует ключевое сопротивление после запуска на Solana — продержится ли прорыв?

ambcrypto10 мин. назад

Первыми, кто почувствовал горячую волну Robinhood Chain, стал Arbitrum, выросший почти на 20%

Автор: Angelilu, Foresight News Токен ARB вырос почти на 20% за неделю, став одним из лучших среди основных L2-токенов. Этот рост вызван запуском «Robinhood Chain» — созданного на базе технологии Arbitrum Layer 2 для RWA (реальных активов), чья основная сеть стартовала 1 июля. Ключевой причиной является активация правила «Программы расширения Arbitrum» (AEP), принятого в январе 2024 года. Согласно ему, независимые цепи, построенные на Arbitrum Orbit, но не использующие Arbitrum One/Nova для финального расчета (например, расчет в Ethereum или Base), должны перечислять 10% своего чистого дохода от протокола в экосистему Arbitrum (8% — в казну DAO, 2% — гильдии разработчиков). Ранее мелкие цепи, такие как Degen Chain, уже платили этот сбор, но из-за их малого масштаба это оставалось незамеченным. Robinhood Chain — первый крупный игрок, который может придать этому механизму реальный вес. Данные Robinhood Chain впечатляют: за первую неделю более 35 млн транзакций, 350 тыс. адресов, TVL около $2.5 млрд и объем DEX свыше $10 млрд. Однако текущий чистый доход протокола для распределения пока невелик — около $146 тыс., из которых в казну Arbitrum DAO может поступить лишь около $14.6 тыс. Рост ARB отражает рыночные ожидания от будущего потенциала AEP, учитывая огромные активы Robinhood ($324 млрд под управлением), которые могут постепенно переходить в блокчейн. Ситуация напоминает историю Optimism и Base. Optimism долго собирал «арендную плату» со своих Superchain, но после объявления Base о выходе из OP Stack его доходы упали. Теперь Arbitrum, благодаря Robinhood, запускает свой «арендный» бизнес. Однако некоторые аналитики задаются вопросом, сможет ли Arbitrum удержать такого крупного «арендатора», как Robinhood Chain, или тот, подобно Base, в будущем может перейти на прямую работу с Ethereum, особенно учитывая, что его ежедневный доход от секвенсоров уже почти в три раза превышает доход материнской цепи Arbitrum и способствует сжиганию ETH.

marsbit51 мин. назад

Первыми, кто почувствовал горячую волну Robinhood Chain, стал Arbitrum, выросший почти на 20%

marsbit51 мин. назад

Акции США находятся в состоянии «крайней уязвимости», когда начинается сезон отчетности

Американский фондовый рынок вступил в сезон отчетности в состоянии «крайней хрупкости», при этом внутреннее давление нарастает под влиянием геополитики, ожиданий монетарной политики и сигналов кредитного рынка. Индикатор уязвимости рынка «Turbu-lens» от стратегов по деривативам UBS достиг максимума с середины сентября 2025 года, что исторически предшествует резкому росту индекса волатильности VIX. Высокие ожидания прибыли корпораций (рост на 24% для S&P 500) усиливают риск негативной реакции на разочаровывающие результаты. Кажущееся затишье волатильности на уровне индексов обманчиво, поскольку волатильность отдельных акций в три раза выше. Эксперты прогнозируют, что начало отчетности, колебания цен на нефть (около $80 за баррель Brent) и рост доходности 10-летних гособлигаций США (близко к 4,6%) могут спровоцировать всплеск волатильности. Кредитные рынки (спреды CDS) не подтверждают бычий настрой акций. UBS рекомендует инвесторам ориентироваться на волатильность отдельных акций и использовать парные корреляционные сделки, особенно в технологическом, энергетическом и финансовом секторах США, а также в энергетике, технологиях и товарах широкого потребления в Европе.

marsbit54 мин. назад

Акции США находятся в состоянии «крайней уязвимости», когда начинается сезон отчетности

marsbit54 мин. назад

Акции США находятся в «чрезвычайно уязвимом» состоянии, открывается сезон отчетности

Индекс волатильности американского фондового рынка кажется спокойным, но внутреннее давление нарастает. На фоне геополитической напряженности, неопределенности в отношении монетарной политики и сигналов кредитного рынка уязвимость рынка достигла рекордного уровня. Показатель рыночной хрупкости "Turbu-lens" команды стратегов по деривативам UBS достиг 0.9 — самого высокого значения с середины сентября 2025 года. Это указывает на "крайнюю рыночную хрупкость" и совпадает с началом сезона корпоративной отчетности. Ожидания рынка высоки: прогнозируется рост прибыли компаний индекса S&P 500 во втором квартале на 24%. Если результаты окажутся слабее, это может привести к резкой коррекции. Несмотря на низкий уровень индекса волатильности VIX, это состояние может быть недолгим — публикация отчетов способна снова его поднять. Важно отметить, что волатильность отдельных акций значительно превышает волатильность индекса, что указывает на сильную внутреннюю дивергенцию. Рост цен на нефть (Brent около $80) поддерживает инфляционные ожидания и может вынудить ФРС сохранять осторожность. Рост доходности 10-летних казначейских облигаций до 4,6% и волатильность рынка облигаций также создают давление на акции. Европейский рынок считается особенно уязвимым к росту цен на энергоносители. Кредитный рынок также не подтверждает уверенный бычий тренд акций: сужение спредов CDS было ограниченным. Для поддержания роста акций необходимы более явные сигналы укрепления на кредитном рынке. В этих условиях UBS рекомендует инвесторам рассматривать тактические возможности через опционы на отдельные акции и парные корреляционные сделки (pair-wise correlations trades), особенно в технологическом, энергетическом и финансовом секторах США.

链捕手56 мин. назад

Акции США находятся в «чрезвычайно уязвимом» состоянии, открывается сезон отчетности

链捕手56 мин. назад

Продолжит ли Maple Finance [SYRUP] рост по мере достижения TVL $2,2 млрд? Вот что говорят показатели...

Токен Maple Finance (SYRUP) вырос на 14% за сутки на фоне укрепления фундаментальных показателей протокола. В первой половине 2026 года объем активов под управлением (AUM) достиг $4,6 млрд (рост на 81% в годовом исчислении), а объем выданных кредитов обновил исторический максимум в $1,9 млрд. Общая стоимость заблокированных средств (TVL) резко увеличилась более чем на $220 млн за день, достигнув $2,265 млрд. Значительный приток связан с ростом популярности токена syrupUSDG, запущенного на Robinhood, чей AUM превысил $200 млн. Спрос на syrupUSDG стимулирует активность в экосистеме Maple и увеличивает спрос на нативный токен SYRUP. Около 18% рыночной капитализации SYRUP уже размещено в стейкинге, что сокращает доступное предложение. Протокол также демонстрирует высокую доходность (APY 4,765%), превышающую среднерыночный показатель. В долгосрочной перспективе ценность SYRUP может быть поддержана предложением о выкупе токенов, привязанном к выручке. Согласно плану, если ежемесячная выручка превысит $2 млн, на выкуп может направляться до 30% от ее объема. Это достижимая цель, учитывая, что протокол уже генерирует около $1,5 млн выручки в месяц.

ambcrypto1 ч. назад

Продолжит ли Maple Finance [SYRUP] рост по мере достижения TVL $2,2 млрд? Вот что говорят показатели...

ambcrypto1 ч. назад

Торговля

Спот

Популярные статьи

Как купить ERA

Добро пожаловать на HTX.com! Мы сделали приобретение Caldera (ERA) простым и удобным. Следуйте нашему пошаговому руководству и отправляйтесь в свое крипто-путешествие.Шаг 1: Создайте аккаунт на HTXИспользуйте свой адрес электронной почты или номер телефона, чтобы зарегистрироваться и бесплатно создать аккаунт на HTX. Пройдите удобную регистрацию и откройте для себя весь функционал.Создать аккаунтШаг 2: Перейдите в Купить криптовалюту и выберите свой способ оплатыКредитная/Дебетовая Карта: Используйте свою карту Visa или Mastercard для мгновенной покупки Caldera (ERA).Баланс: Используйте средства с баланса вашего аккаунта HTX для простой торговли.Третьи Лица: Мы добавили популярные способы оплаты, такие как Google Pay и Apple Pay, для повышения удобства.P2P: Торгуйте напрямую с другими пользователями на HTX.Внебиржевая Торговля (OTC): Мы предлагаем индивидуальные услуги и конкурентоспособные обменные курсы для трейдеров.Шаг 3: Хранение Caldera (ERA)После приобретения вами Caldera (ERA) храните их в своем аккаунте на HTX. В качестве альтернативы вы можете отправить их куда-либо с помощью перевода в блокчейне или использовать для торговли с другими криптовалютами.Шаг 4: Торговля Caldera (ERA)С легкостью торгуйте Caldera (ERA) на спотовом рынке HTX. Просто зайдите в свой аккаунт, выберите торговую пару, совершайте сделки и следите за ними в режиме реального времени. Мы предлагаем удобный интерфейс как для начинающих, так и для опытных трейдеров.

786 просмотров всегоОпубликовано 2025.07.17Обновлено 2026.06.02

Как купить ERA

Обсуждения

Добро пожаловать в Сообщество HTX. Здесь вы сможете быть в курсе последних новостей о развитии платформы и получить доступ к профессиональной аналитической информации о рынке. Мнения пользователей о цене на ERA (ERA) представлены ниже.

活动图片