Stellar (XLM) price prediction – Here’s why another 14% hike may be next

ambcryptoОпубликовано 2026-03-26Обновлено 2026-03-26

Введение

Stellar (XLM) surged over 9% in 24 hours, outperforming major cryptocurrencies like Bitcoin and Ethereum, with its trading volume jumping 49% to $217 million. This indicates strong market interest. XLM broke the key $0.18 resistance level, a point it had struggled to sustain since February 2026. A daily close above $0.18 could trigger a further 14% rally toward $0.21, but failure may lead to a decline. The RSI at 61.01 suggests it's nearing overbought territory. Derivatives data shows bullish sentiment, with open interest up 35.97% to $120.55 million and significant long positions, indicating growing bullish conviction and whale activity.

Stellar (XLM) surged by over 9% and emerged as among the top gainers after the wider crypto market recovered over the last 24 hours. This price jump has not only helped it outperform major assets like Bitcoin (BTC), Ethereum (ETH), and Solana (SOL), but it has also opened the door for further upside potential in XLM.

At the time of writing, XLM was trading at $0.1802. Not only has the price increased, but strong market participation has also been seen, as reflected by XLM’s trading volume. It surged by over 49% to $217 million over the same period.

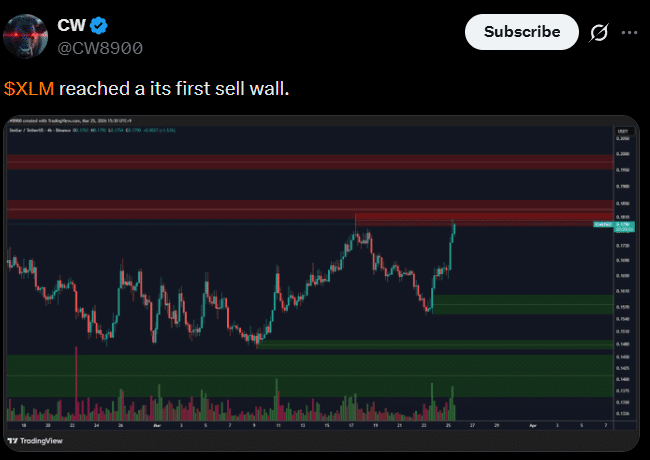
This hike in volume might reinforce XLM’s latest upside since it suggested that investors and traders may be interested in the prevailing trend. It is in this context that recently, a popular crypto expert, shared a post on X stating – “XLM has reached its first sell wall.” As expected, this post has raised questions about the crypto’s recent gains.

Source: X/CW8900

XLM price action and key levels to watch

On the daily chart, XLM appeared to be bullish as it broke out of the key resistance level of $0.18 – A level that had been holding firm since 1 February 2026. In the past, the crypto has previously attempted to breach this level. However, it failed to sustain the move, resulting in sharp declines across the board.

Source: TradingView

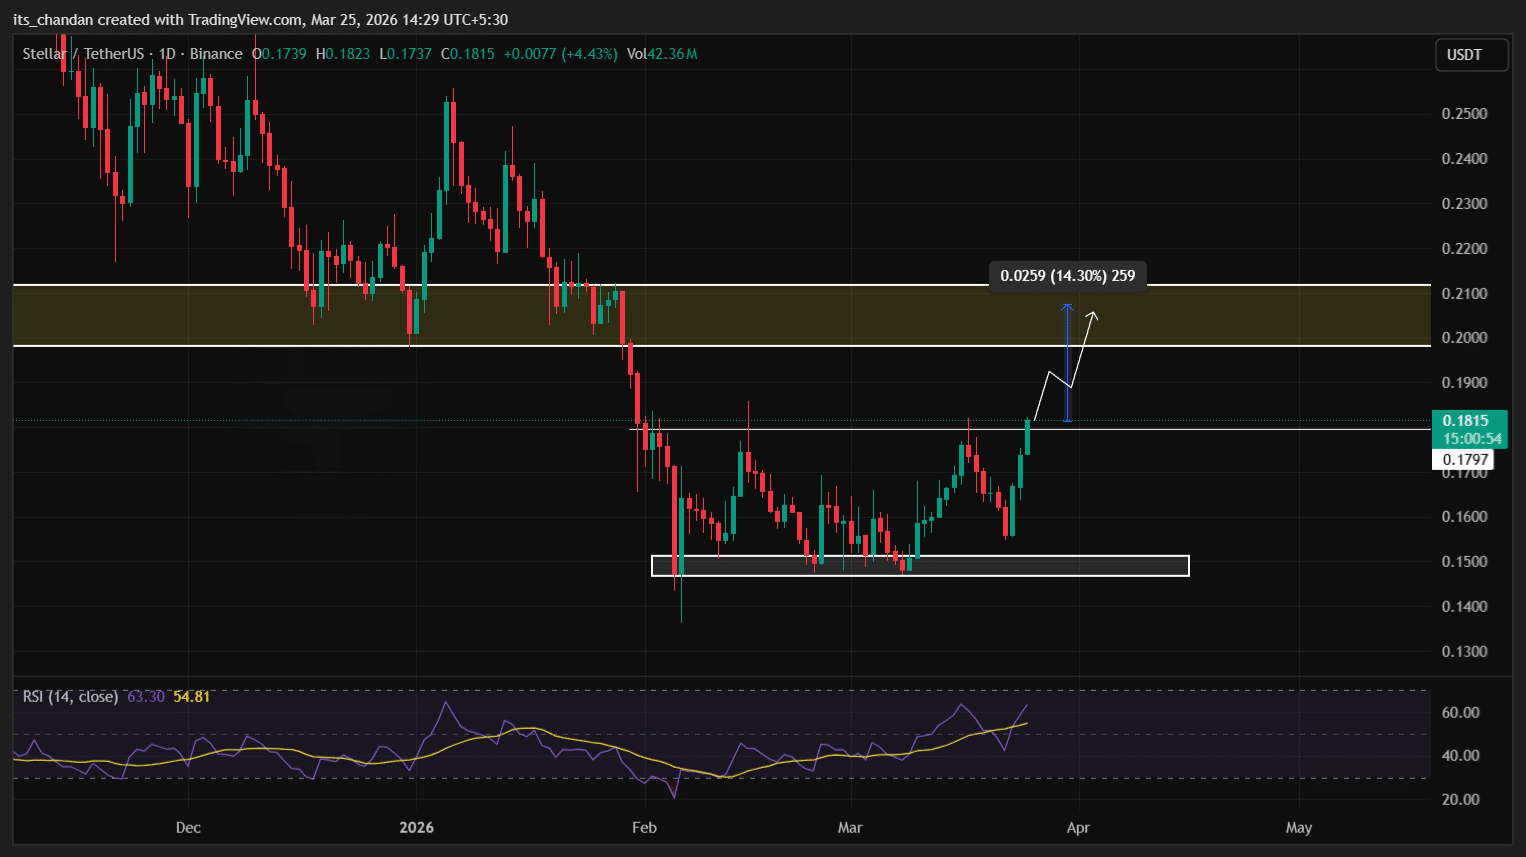
The altcoin’s press time price action suggested that XLM’s breakout can only be confirmed if it closes a daily candle above the $0.18-level. If this happens, the asset could see a price uptick of 14% and may reach the $0.21 level in the coming days. However, if it fails to close a daily candle above this key level, history may repeat itself, and a downside move could occur.

Meanwhile, the technical indicator Relative Strength Index (RSI) stood at 61.01, indicating that XLM may be approaching the overbought zone.

Are derivative tools turning bullish?

Finally, despite the price being at a make-or-break level, intraday traders seemed to be placing bullish bets.

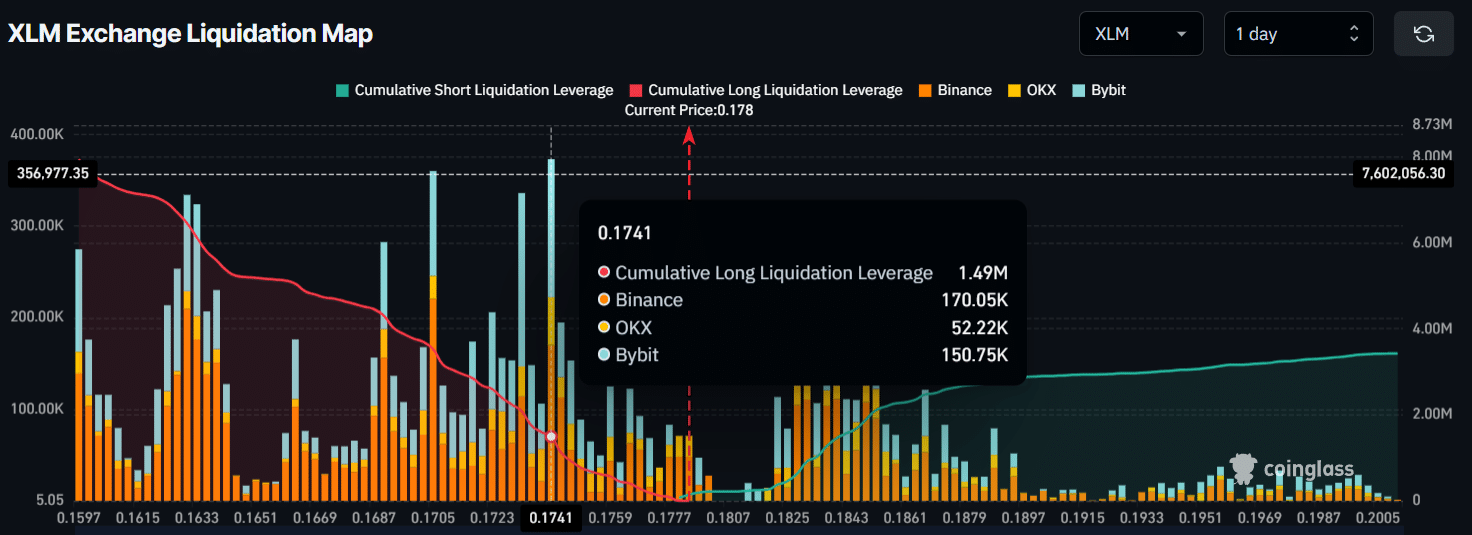
Data showed that $0.1741 and $0.1831 were two major liquidation levels on either side, where traders built $1.49 million worth of long-leveraged positions and $917.85K worth of short-leveraged positions. These bets hinted at the dominance of XLM bulls in the face of bears possibly losing momentum.

Source: Coinglass

The data further showed that traders have been increasingly taking long positions, with XLM’s Open Interest (OI) surging by 35.97% in 24 hours to $120.55 million. This alluded to a significant buildup of leveraged long positions and growing bullish conviction.

Also, CryptoQuant revealed that the average order size in the spot market has been trending upwards over the past few days – A sign of consistent participation from whales and large investors.


Final Thoughts

  • Stellar (XLM) jumped by 9.25% in 24 hours, outperforming major assets like BTC, ETH, and SOL.
  • Price action at a make-or-break level, and a daily candle close above $0.18 could trigger a further 14% price rally.

Связанные с этим вопросы

QWhat was the percentage increase in Stellar (XLM) price over the last 24 hours mentioned in the article?

AStellar (XLM) surged by over 9% in the last 24 hours.

QWhat is the key resistance level that XLM needs to close a daily candle above to confirm a breakout?

AThe key resistance level is $0.18.

QAccording to the article, what potential price target could XLM reach if it successfully breaks above the $0.18 level?

AXLM could see a price uptick of 14% and may reach the $0.21 level.

QWhat does the RSI value of 61.01 indicate about XLM's market condition?

AAn RSI of 61.01 indicates that XLM may be approaching the overbought zone.

QHow much did XLM's Open Interest (OI) increase in 24 hours, and what does this suggest?

AXLM's Open Interest surged by 35.97% to $120.55 million, indicating a significant buildup of leveraged long positions and growing bullish conviction.

Похожее

Fed's Internal Doves Flock to Hawkish Stance, Warsh's Debut "Between a Rock and a Hard Place"

U.S. Federal Reserve officials who previously advocated for rate cuts, including Governor Christopher Waller, have recently shifted their stance, with many now not ruling out the possibility of future rate hikes. This sets a challenging stage for new Fed Chair Kevin Warsh's first policy meeting. Appointed by President Trump based on his dovish views, Warsh now faces a committee where the debate has pivoted from "when to cut" to "whether to hike," driven by persistent inflation above 3%, a strong labor market, and supply-side pressures from AI infrastructure demands and geopolitical tensions. Key figures illustrate the shift. Governor Waller, once concerned about employment, now says data has pushed him toward considering rate increases. Even moderate voices like Governor Lisa Cook, while expecting inflation to ease, have indicated readiness to hike if it fails to do so. Long-time hawks such as regional Fed presidents Beth Hammack, Lorie Logan, and Neel Kashkari have grown more vocal, arguing that the real policy rate is effectively falling and that action may soon be needed. The upcoming Fed meeting is expected to keep rates steady but will likely remove the "easing bias" from its statement, signaling a neutral stance between cuts and hikes. The quarterly "dot plot" is anticipated to show most officials projecting no cuts this year, with some potentially indicating hikes. Chair Warsh, a critic of the Fed's reliance on forward guidance like the dot plot, must navigate communicating this pivot using tools he has questioned, all while steering policy in a direction counter to the preferences of the president who appointed him. The consensus suggests the Fed's next move could well be a rate increase.

marsbit11 мин. назад

Fed's Internal Doves Flock to Hawkish Stance, Warsh's Debut "Between a Rock and a Hard Place"

marsbit11 мин. назад

The Trillion-Yuan Market Cap 'Yi Zhong Tian': Who is the True Value King?

The article analyzes the three leading Chinese optical module companies, collectively nicknamed "Yi Zhong Tian": Xinyisheng, Zhongji Innolight, and TFC Optical Communication. It evaluates their "cost-performance" not by current stock price, but through three lenses: PEG ratio (growth vs. valuation), earnings quality, and premium/discount for certainty. Xinyisheng shows the most attractive PEG ratio and high profitability, but its valuation reflects discounts for risks like high customer concentration and reliance on overseas markets. Zhongji Innolight, the most expensive, commands a premium for its market leadership, dominant share in key products like 800G/1.6T modules, and higher earnings certainty, though it faces geopolitical risks. TFC Optical, as an upstream component supplier ("water seller"), has the highest gross margin and bets on the long-term CPO/NPO architecture trend, but trades at a high valuation with more stable, less explosive growth. The core argument is that while these companies dominate module assembly, the true profit pool and technological moat lie upstream in laser and switch chips, currently controlled by U.S. firms like Lumentum and Coherent. The long-term "cost-performance" for these Chinese leaders hinges on whether the domestic industry, exemplified by companies like Yuanjie Technology, can successfully move up the value chain into high-power laser chips. Otherwise, their high growth may remain confined to the lower-margin assembly segment.

marsbit21 мин. назад

The Trillion-Yuan Market Cap 'Yi Zhong Tian': Who is the True Value King?

marsbit21 мин. назад

Has the Crypto Market Bottomed? Here's What Institutions Think

The crypto market is in a period of significant debate, with leading institutions offering differing views on whether a bottom has been reached. Three prominent firms have published detailed analyses: * **Galaxy Digital** argues Bitcoin has **not yet bottomed**. Their analysis of 13 historical indicators across six dimensions (valuation, profit-taking, miner pressure, etc.) shows only four are fully met. They project a potential bottom range between $30k and $54k. * **NYDIG** states a bottom is **possible but not likely**. While metrics are close to historic bear market extremes, they note the absence of a classic panic-selling event. They also suggest increased institutional adoption may have structurally altered the market cycle, potentially leading to a shallower downturn. * **Standard Chartered Bank** asserts the **bottom has already occurred** at around $59k. They cite two key factors: potential US-Iran diplomatic progress and the anticipated SpaceX IPO, which they believe absorbed capital and caused ETF selling pressure that is now subsiding. They forecast a year-end price target of $100k. Despite the surface-level disagreement, the reports share critical common ground more valuable for long-term investors: 1. All three believe the market bottom will form **within this year**. 2. All agree the current price is **closer to the bottom than to previous highs**. 3. All maintain a **bullish long-term outlook** for Bitcoin and a new cycle. The core takeaway is that while the exact bottom price ($40k, $50k, or $60k) is debated, the consensus is that a bottom is imminent. For long-term holders, the primary focus should not be pinpointing the absolute low, but on the future potential for prices to reach $100k, $200k, or higher. The fundamental thesis for Bitcoin—sovereign debt accumulation, inflation, declining trust in centralized institutions, global digitization, and improved accessibility—remains intact and is arguably strengthening. The overall landscape is viewed as more favorable than in previous crypto winters.

marsbit32 мин. назад

Has the Crypto Market Bottomed? Here's What Institutions Think

marsbit32 мин. назад

The 'Chip' Challenge and Breakthroughs in China's Optical Industry Chain

China's Photonics Industry: Bottlenecks and Breakthroughs In the global AI race, computing chips dominate the narrative, but the underlying bottleneck increasingly defining the scale of AI clusters is light—or more specifically, optical connectivity. Optical modules, which translate electrical signals to light and vice versa, are crucial for connecting thousands of GPUs in AI data centers, preventing data congestion and ensuring efficient model training. High-speed modules (800G, 1.6T) are now standard, with performance hinging on advanced DSP (Digital Signal Processor) chips. This is where a critical dependency lies. Two US giants—Marvell and Broadcom—collectively dominate over 90% of the high-end DSP chip market. Chinese optical module leaders like Zhongji Innolight and Eoptolink rely on these chips to manufacture modules for overseas AI customers, primarily in North America. While this creates a supply chain vulnerability, complete decoupling is difficult. Marvell derives over half its revenue from Greater China, and the US firms depend on Chinese partners for chip packaging and optical components. The risk from laser chips (e.g., from Lumentum), another key component, is considered more manageable due to multiple global suppliers and faster progress in domestic alternatives from companies like YOFC and Accelink. To mitigate risks, China's industry is pursuing a multi-pronged strategy: diversifying supply chains and locking in long-term orders; fostering a domestic market ecosystem to adopt homegrown DSPs from firms like Huawei HiSilicon and CETC; accelerating R&D in high-speed DSPs and advanced packaging; and investing in next-gen technologies like silicon photonics and Co-Packaged Optics (CPO) to reduce reliance on discrete DSPs. The ultimate solution lies not in short-term博弈 but in persistent advancement of domestic high-end chip R&D and manufacturing. While challenges remain in performance, certification, and ecosystem building, China's vast domestic market and manufacturing base provide a crucial buffer, buying time for the industry to achieve greater technological independence.

marsbit45 мин. назад

The 'Chip' Challenge and Breakthroughs in China's Optical Industry Chain

marsbit45 мин. назад

Behind SpaceX's $2 Trillion Market Cap: Why Does Musk Always Have the Next Move Planned?

On June 12th, SpaceX debuted on the Nasdaq, reaching a valuation that briefly touched $2 trillion. This marked the culmination of a 24-year journey from its founding in 2002, driven by Elon Musk's frustration at the high cost of buying rockets. The company's path was defined by early failures, with its first three Falcon 1 launches ending in explosions before a successful 2008 flight opened the era of commercial spaceflight. Key to its model was a fixed-price NASA contract, incentivizing cost reduction. SpaceX mastered rocket reusability, first achieving a Falcon 9 landing in 2015, which drastically cut launch costs. This enabled its profitable Starlink satellite internet constellation, envisioned years before reusability was proven, to create an internal market for frequent launches. Similarly, the next-generation Starship rocket was in development long before its first flight, with its business case evolving from Mars colonization to supporting the emerging concept of in-orbit data centers for AI—a story now central to its valuation. The company's recent IPO, a reversal of its long-standing "no IPO" stance, is funding this ambitious "space-based compute" vision. While major tech players like Google, Blue Origin, and others are investing heavily, significant technical and cost hurdles remain. Ultimately, SpaceX's history is one of creating its own demand: first with Starlink and now with space-based AI compute, betting that its next rocket will enable its next giant market.

marsbit48 мин. назад

Behind SpaceX's $2 Trillion Market Cap: Why Does Musk Always Have the Next Move Planned?

marsbit48 мин. назад

Торговля

Спот
Фьючерсы

Популярные статьи

Как купить XLM

Добро пожаловать на HTX.com! Мы сделали приобретение Stellar (XLM) простым и удобным. Следуйте нашему пошаговому руководству и отправляйтесь в свое крипто-путешествие.Шаг 1: Создайте аккаунт на HTXИспользуйте свой адрес электронной почты или номер телефона, чтобы зарегистрироваться и бесплатно создать аккаунт на HTX. Пройдите удобную регистрацию и откройте для себя весь функционал.Создать аккаунтШаг 2: Перейдите в Купить криптовалюту и выберите свой способ оплатыКредитная/Дебетовая Карта: Используйте свою карту Visa или Mastercard для мгновенной покупки Stellar (XLM).Баланс: Используйте средства с баланса вашего аккаунта HTX для простой торговли.Третьи Лица: Мы добавили популярные способы оплаты, такие как Google Pay и Apple Pay, для повышения удобства.P2P: Торгуйте напрямую с другими пользователями на HTX.Внебиржевая Торговля (OTC): Мы предлагаем индивидуальные услуги и конкурентоспособные обменные курсы для трейдеров.Шаг 3: Хранение Stellar (XLM)После приобретения вами Stellar (XLM) храните их в своем аккаунте на HTX. В качестве альтернативы вы можете отправить их куда-либо с помощью перевода в блокчейне или использовать для торговли с другими криптовалютами.Шаг 4: Торговля Stellar (XLM)С легкостью торгуйте Stellar (XLM) на спотовом рынке HTX. Просто зайдите в свой аккаунт, выберите торговую пару, совершайте сделки и следите за ними в режиме реального времени. Мы предлагаем удобный интерфейс как для начинающих, так и для опытных трейдеров.

613 просмотров всегоОпубликовано 2024.04.12Обновлено 2026.06.02

Как купить XLM

Обсуждения

Добро пожаловать в Сообщество HTX. Здесь вы сможете быть в курсе последних новостей о развитии платформы и получить доступ к профессиональной аналитической информации о рынке. Мнения пользователей о цене на XLM (XLM) представлены ниже.

活动图片