Executive Summary
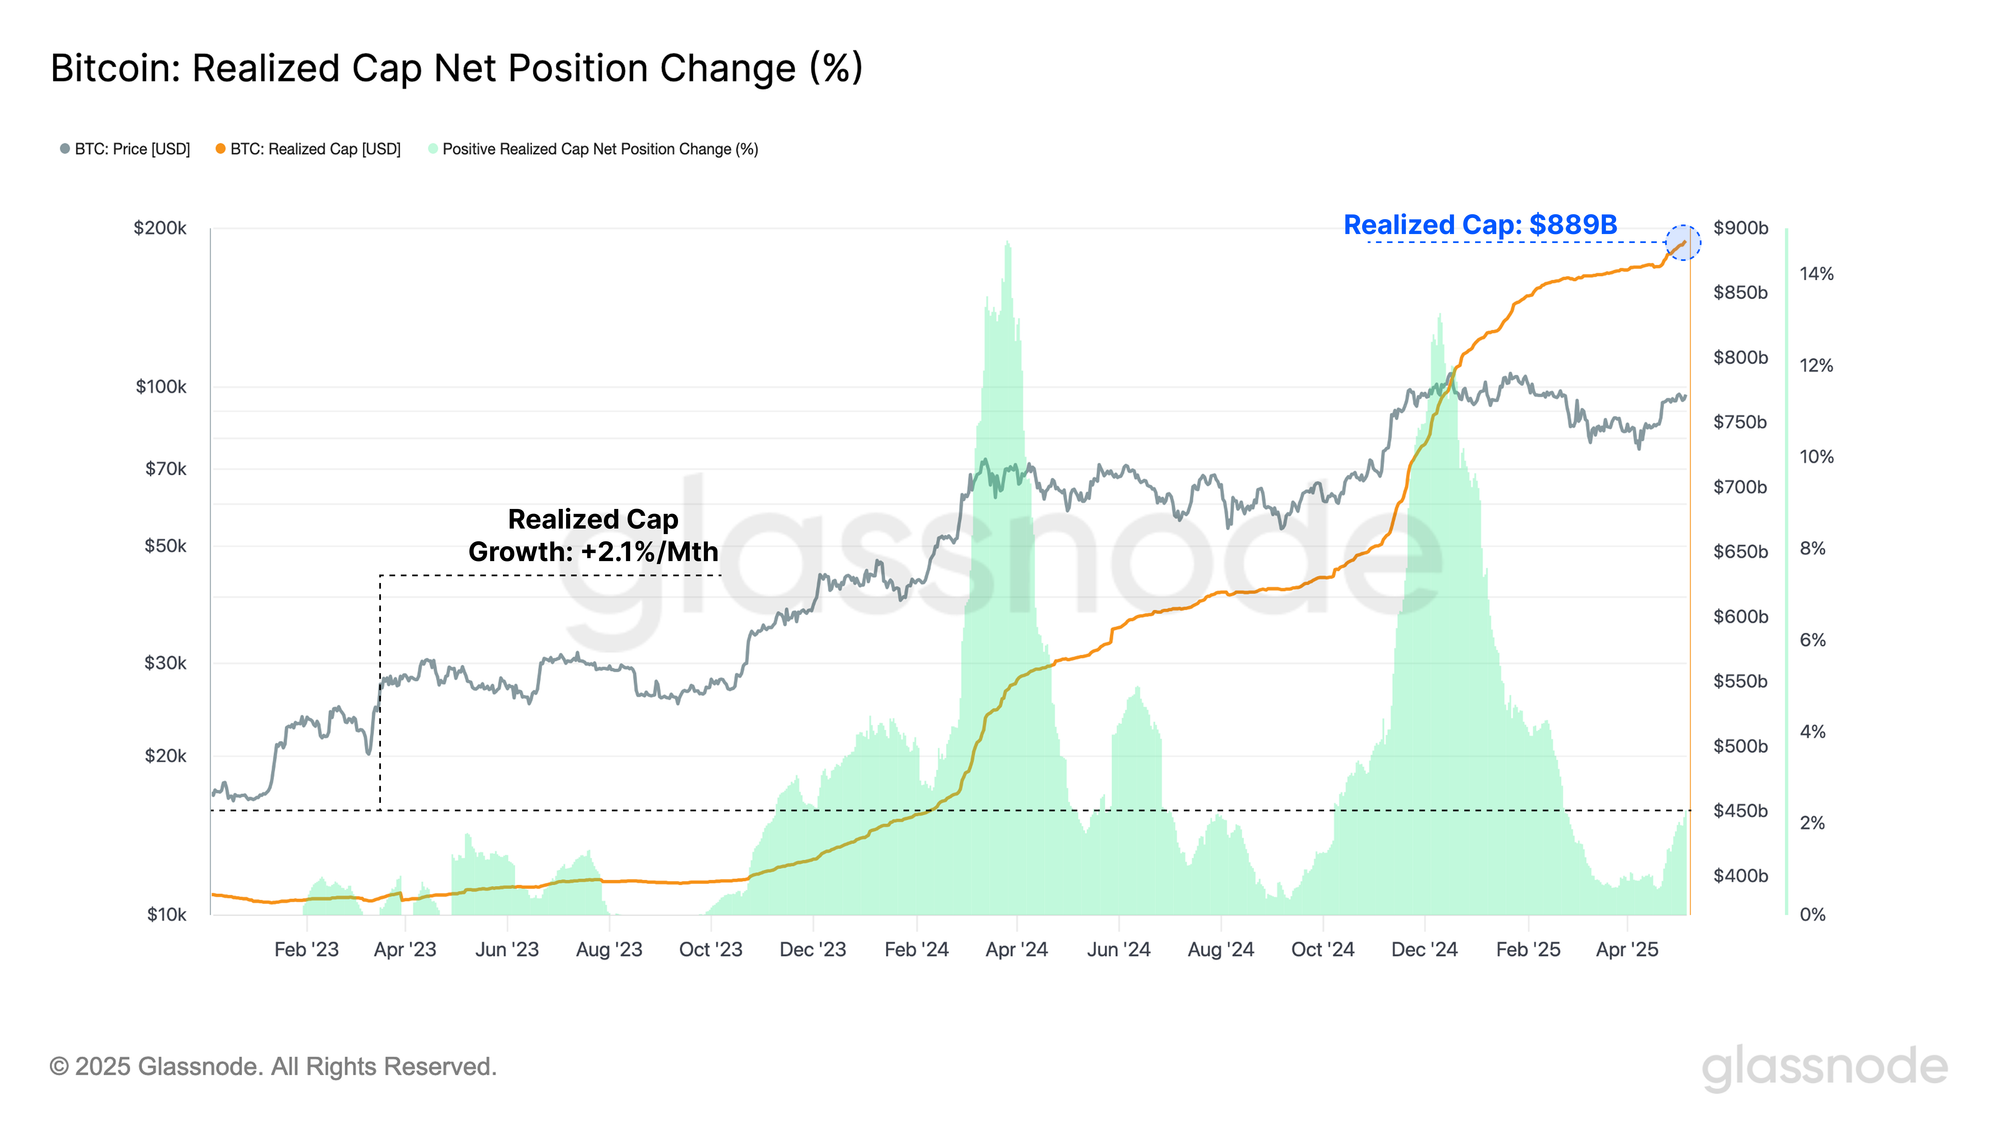
- With the BTC price climbing to a high of $97.9k, the renewed market strength has sparked a wave of capital inflows, with the realized cap climbing to an ATH value of $889B.
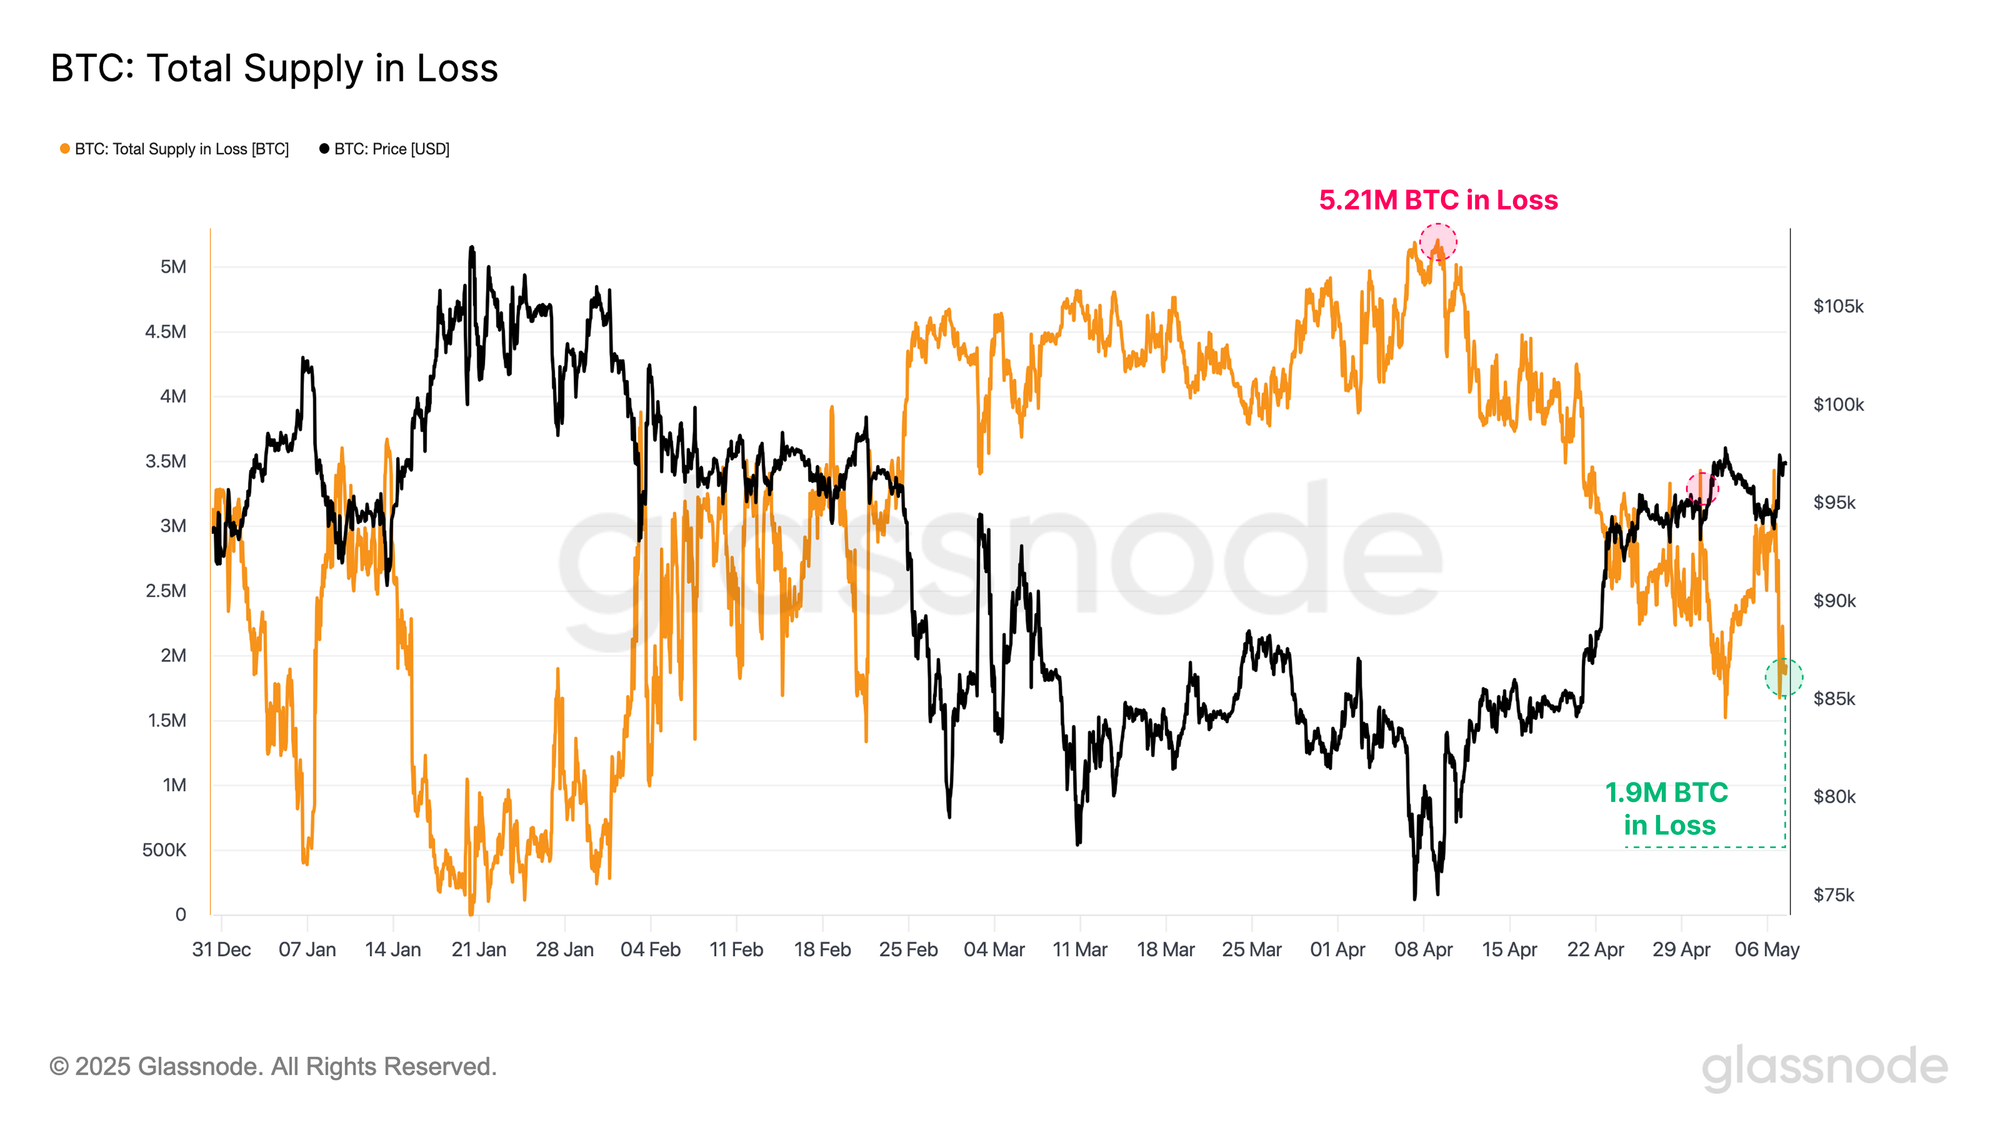
- The rebound in price has provided significant financial relief to market participants. At the recent low of $74k, over +5M BTC were held in an underwater position. This has collapsed to just +2M BTC, with over +3M BTC having returned to a state of profit.
- Demand from institutional investors across recent months has been lackluster, with the ETF complex experiencing its largest period of sustained outflows on record. This has markedly reversed in the wake of the recent market strength, with the ETFs recording over +$4.6B of inflows across the last two weeks.
- The market remains at a critical decision point, hovering just above the Short-Term Holder cost-basis. Additionally, a large cluster of coins resides around the spot price. Historically, this had led to increased market sensitivity and, by extension, elevated volatility potential.
- A broad-based contraction in volatility premium across all contract maturities is occurring, indicates that volatility expectations are quite subdued, reinforcing the view that the market may be undervaluing future volatility.
Liquidity Rises
Last week, the Bitcoin market experienced a sharp rally, with the BTC price climbing to a high of $97.9k, its highest in over two months. Since then, it has pulled back slightly to trade at around $94.0k, before rallying back to $97.0k.
This market strength has sparked a renewed wave of capital inflows, and an uptick in liquidity flowing into Bitcoin. We can also see some investors opting to de-risk and take profit, distributing into the upward momentum.
One way we can quantify the change in network liquidity is via the realized cap metric, which calculates the cumulative net capital flows into a digital asset. The Bitcoin realized cap is now trading at an ATH value of $889B. The rate of capital growth has seen the realized cap increase by +2.1% over the last month.
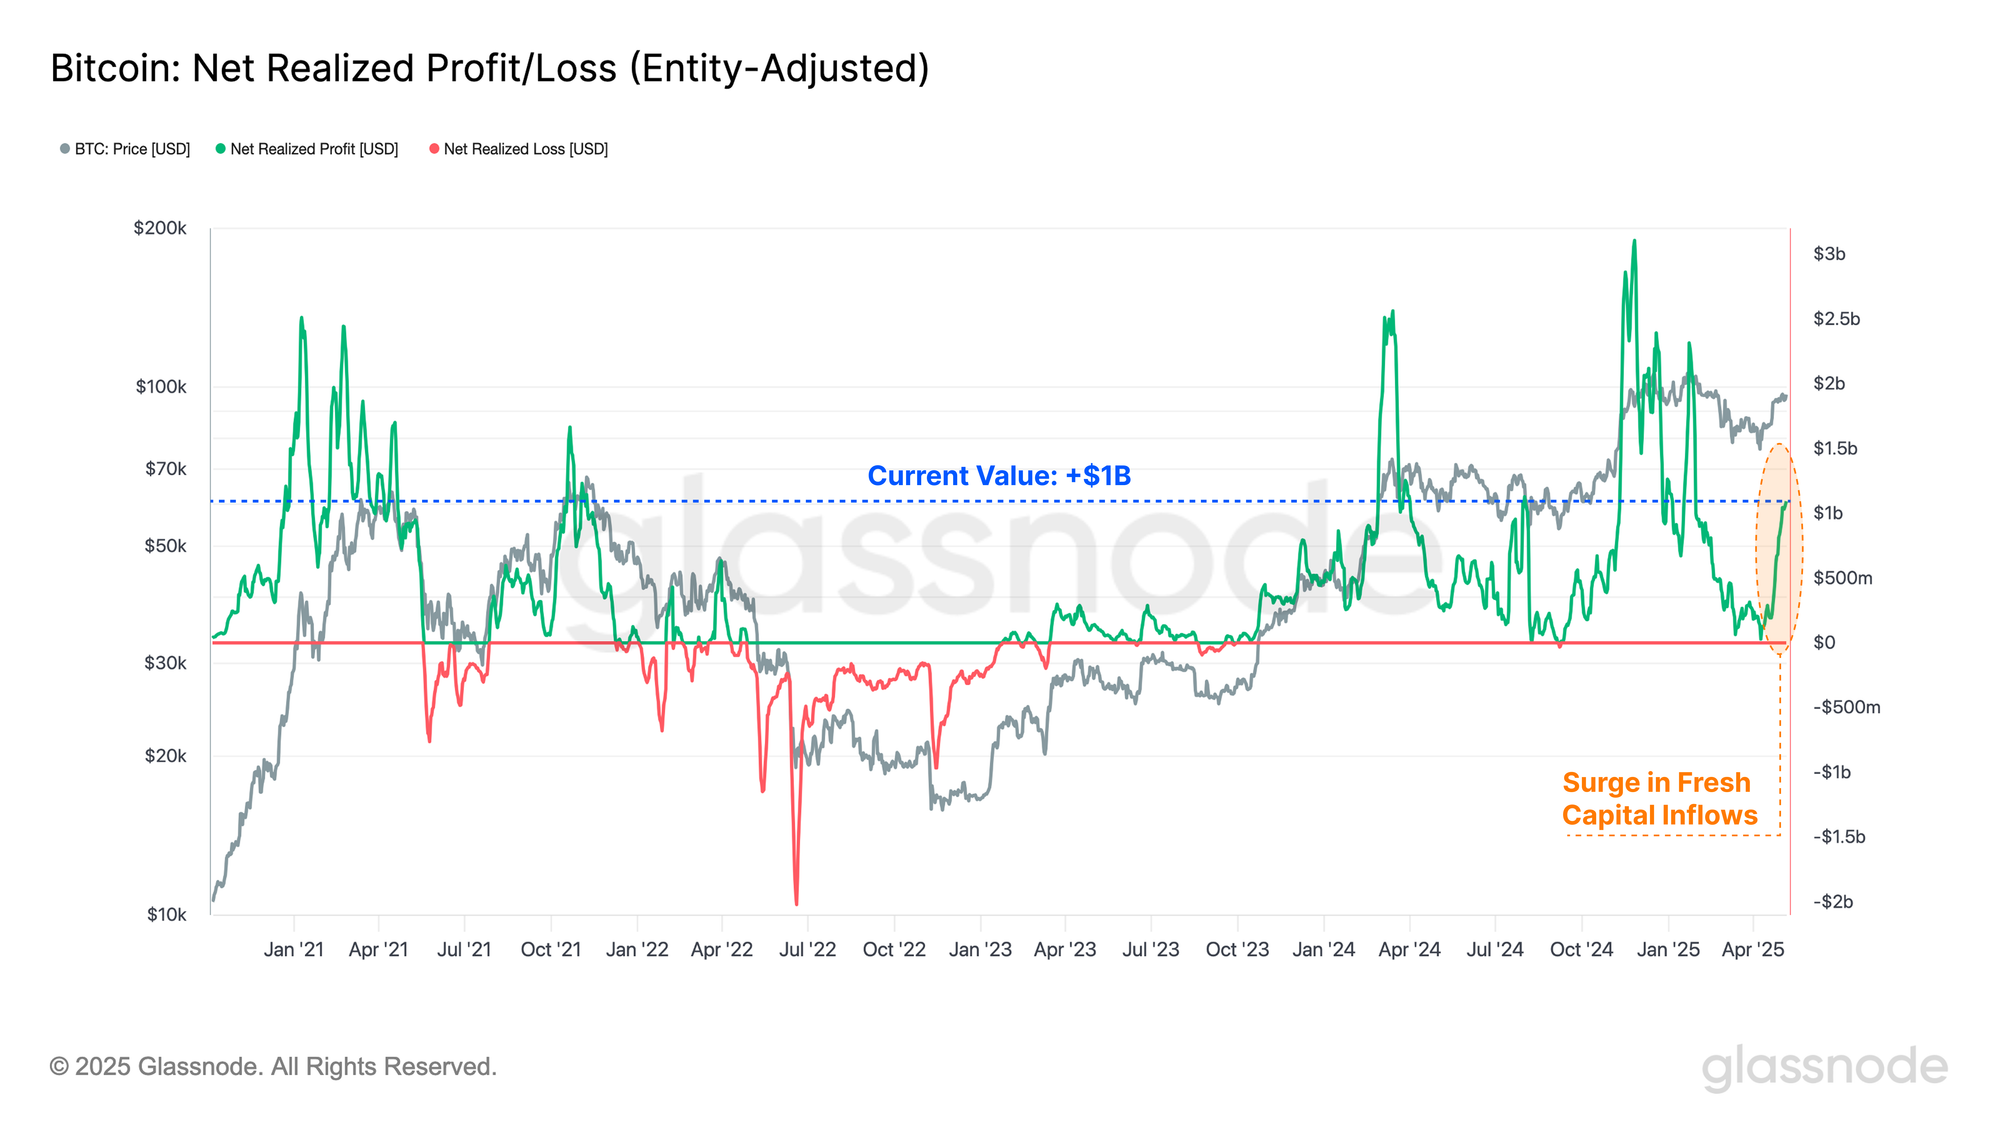
The Net Realized Profit/Loss metric is calculated as the first derivative of the Realized Cap, allowing us to observe the magnitude of net USD denominated capital flows occurring each day.
A surge in profit taking can be observed in recent weeks, with the recent rally drawing in over $1B/day in net capital inflows. This points to initial indicators of a return of demand-side strength, allowing sellers to lock in profits, and speaking to buyers willing to pick up coins at the current market price. Generally speaking, this points to a wave of demand which is absorbing the incoming supply.
Notably, the market has sustained a profit-driven regime since October 2023, with capital inflows consistently exceeding outflows. This steady influx of fresh capital serves as an overall constructive signal.
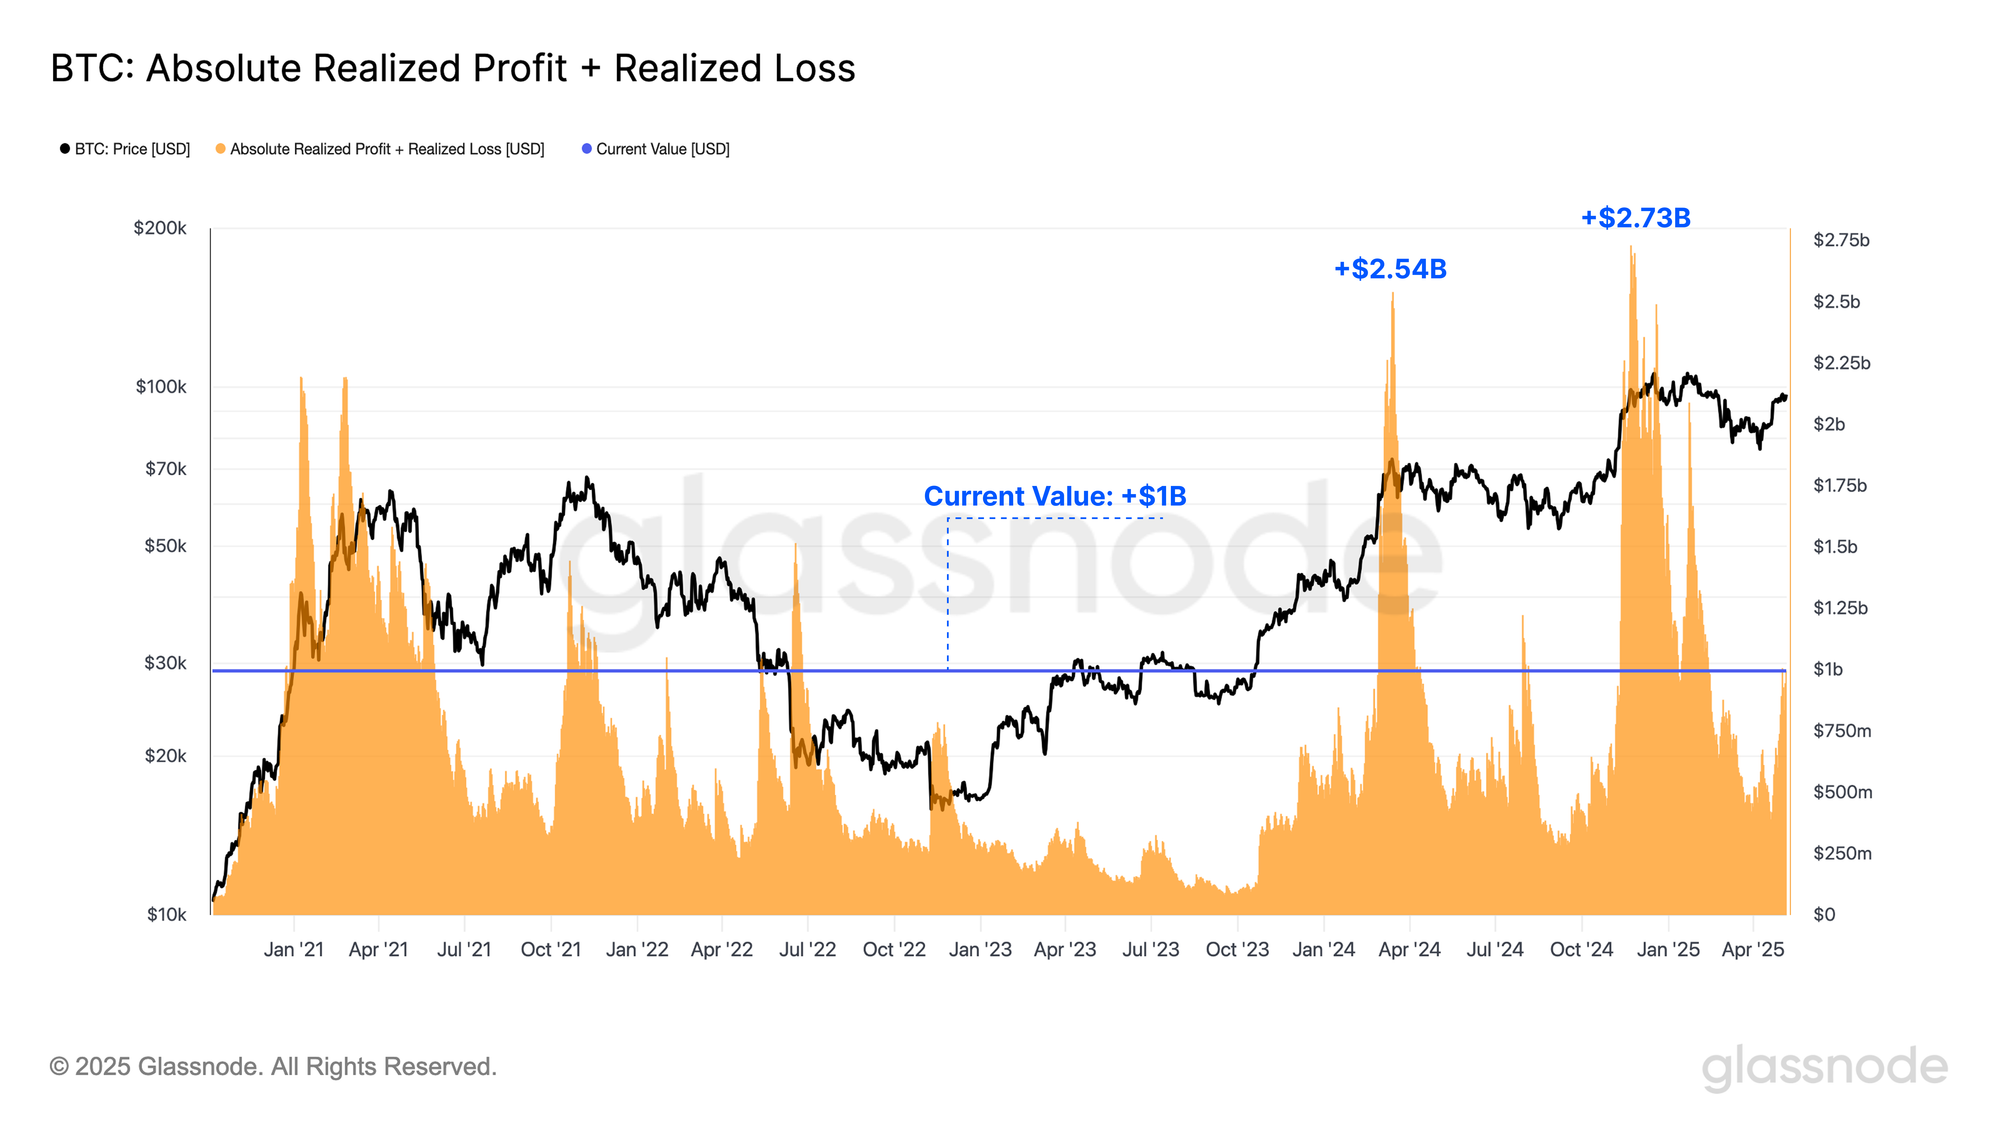
If we combine both Realized Profit and Loss taking volumes on-chain, we can better gauge the willingness of investors to transact within the current market conditions.
Combined profit and loss volumes have risen to a value of $1B/day, with only 15% of trading days this cycle recording a larger value. This suggests an increase in investor activity and demand.
Of note, the component of Realized Loss accounts for only 1-2% of the total, suggesting the majority of investors with coins acquired above $96k are sitting tight for the time being.
Financial Pressure Eases
We have established that there are signs of renewed market strength, and the market is trading within a profit-dominated regime. We can now turn towards evaluating the degree of financial relief which the price bounce has provided to market participants.
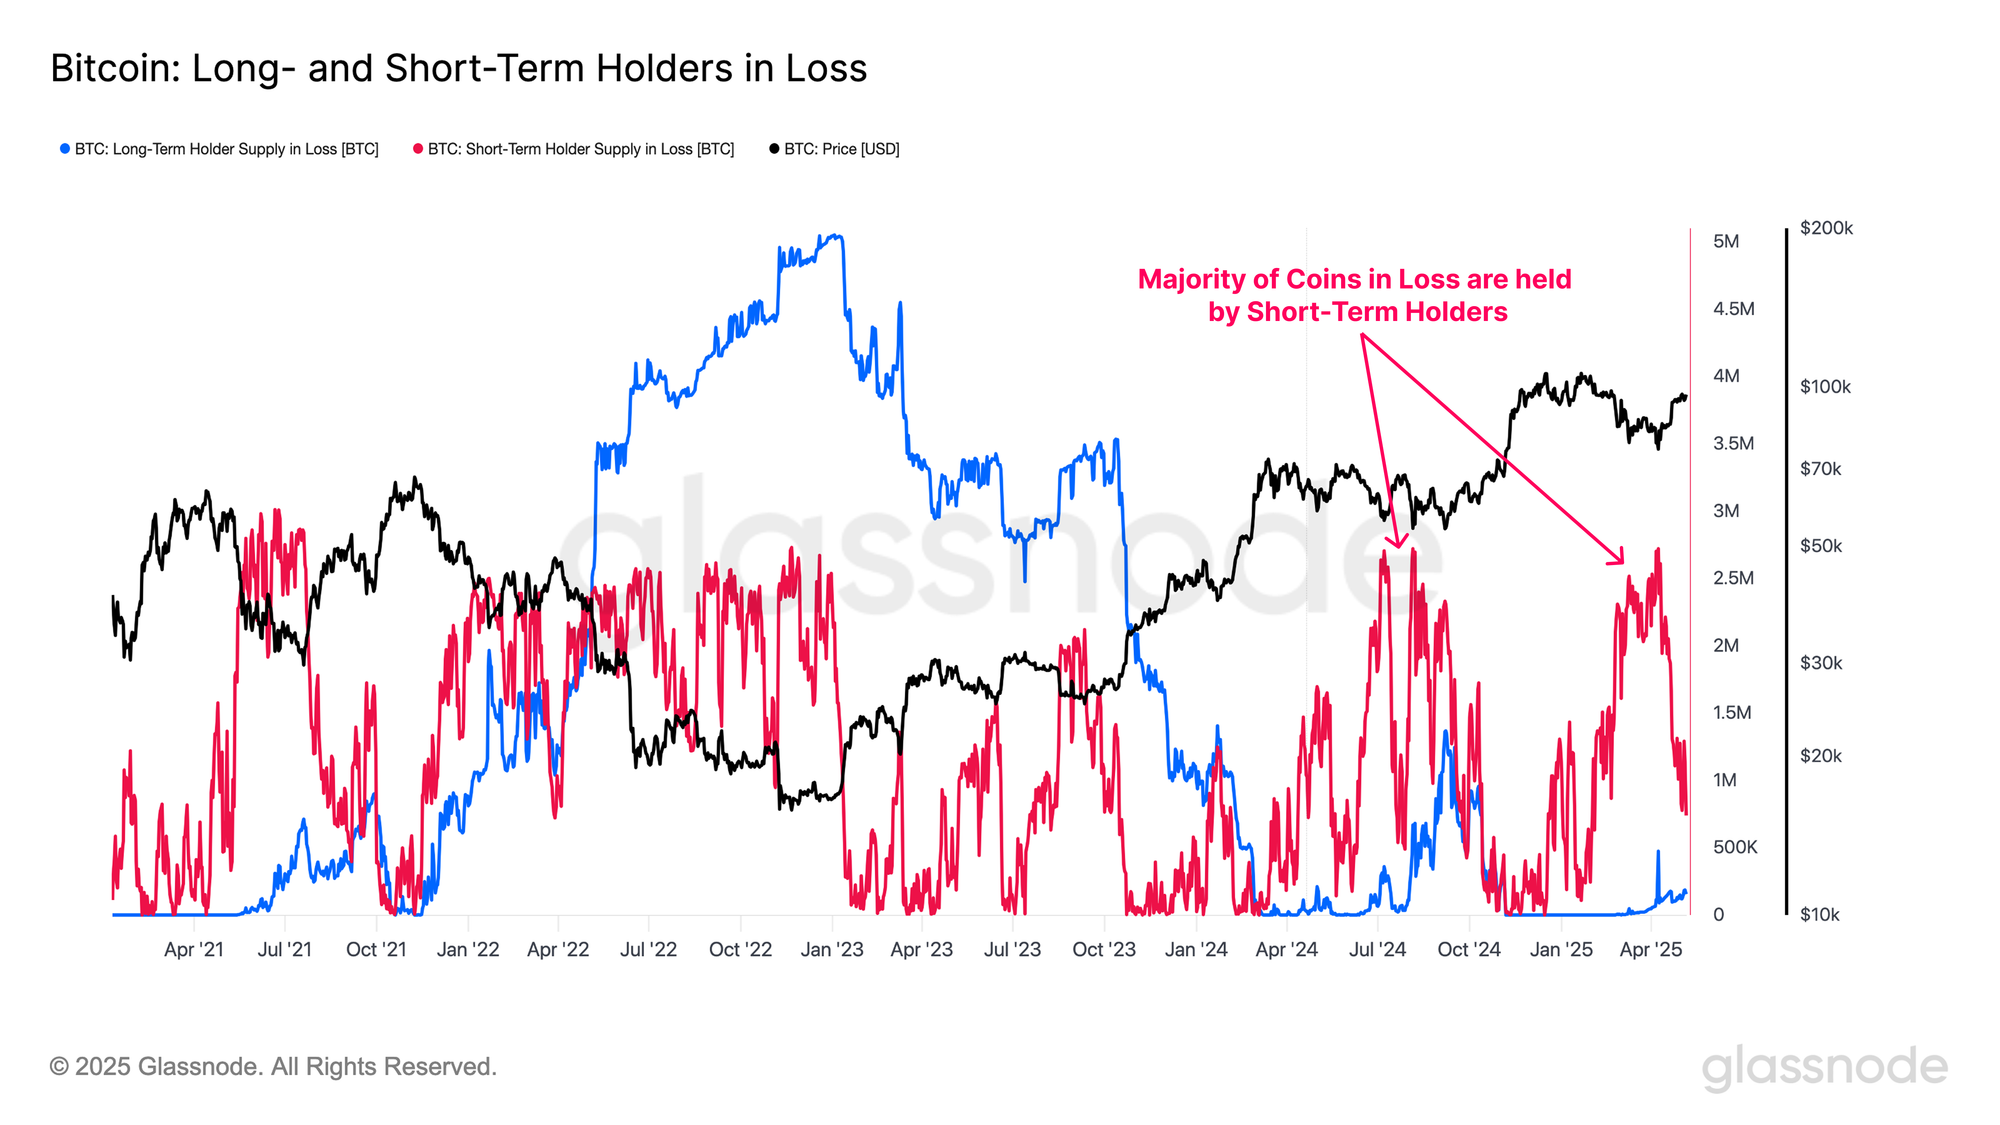
As the market approached the current local low of $74k, more than 5M BTC were held in an underwater position. However, as the market recovery has taken place, this number has fallen to around 1.9M BTC, indicating that over 3M BTC have returned to a state of profit. This generally works towards bolstering investor sentiment.
We flagged a similar occurrence in the previous WoC edition, showing that a significant number of Short-Term Holder coins had returned to a profitable position as the market rallied back above $95k. It is likely that this cohort will be a key driver of the aforementioned profit taking events, as local dip buyers take profits into market strength.
If we inspect the breakdown of coins held in in loss between Long and Short-Term Holders, we can see that the STH cohort still represent the lions share of underwater positions (83% of Long and Short-Term Holder losses).
With the majority of the financial burden placed upon the shoulders of recent buyers, the next phase of our our analysis will focus in on this cohort as the primary indicator for how sentiment has shifted as the market attempts to recover.
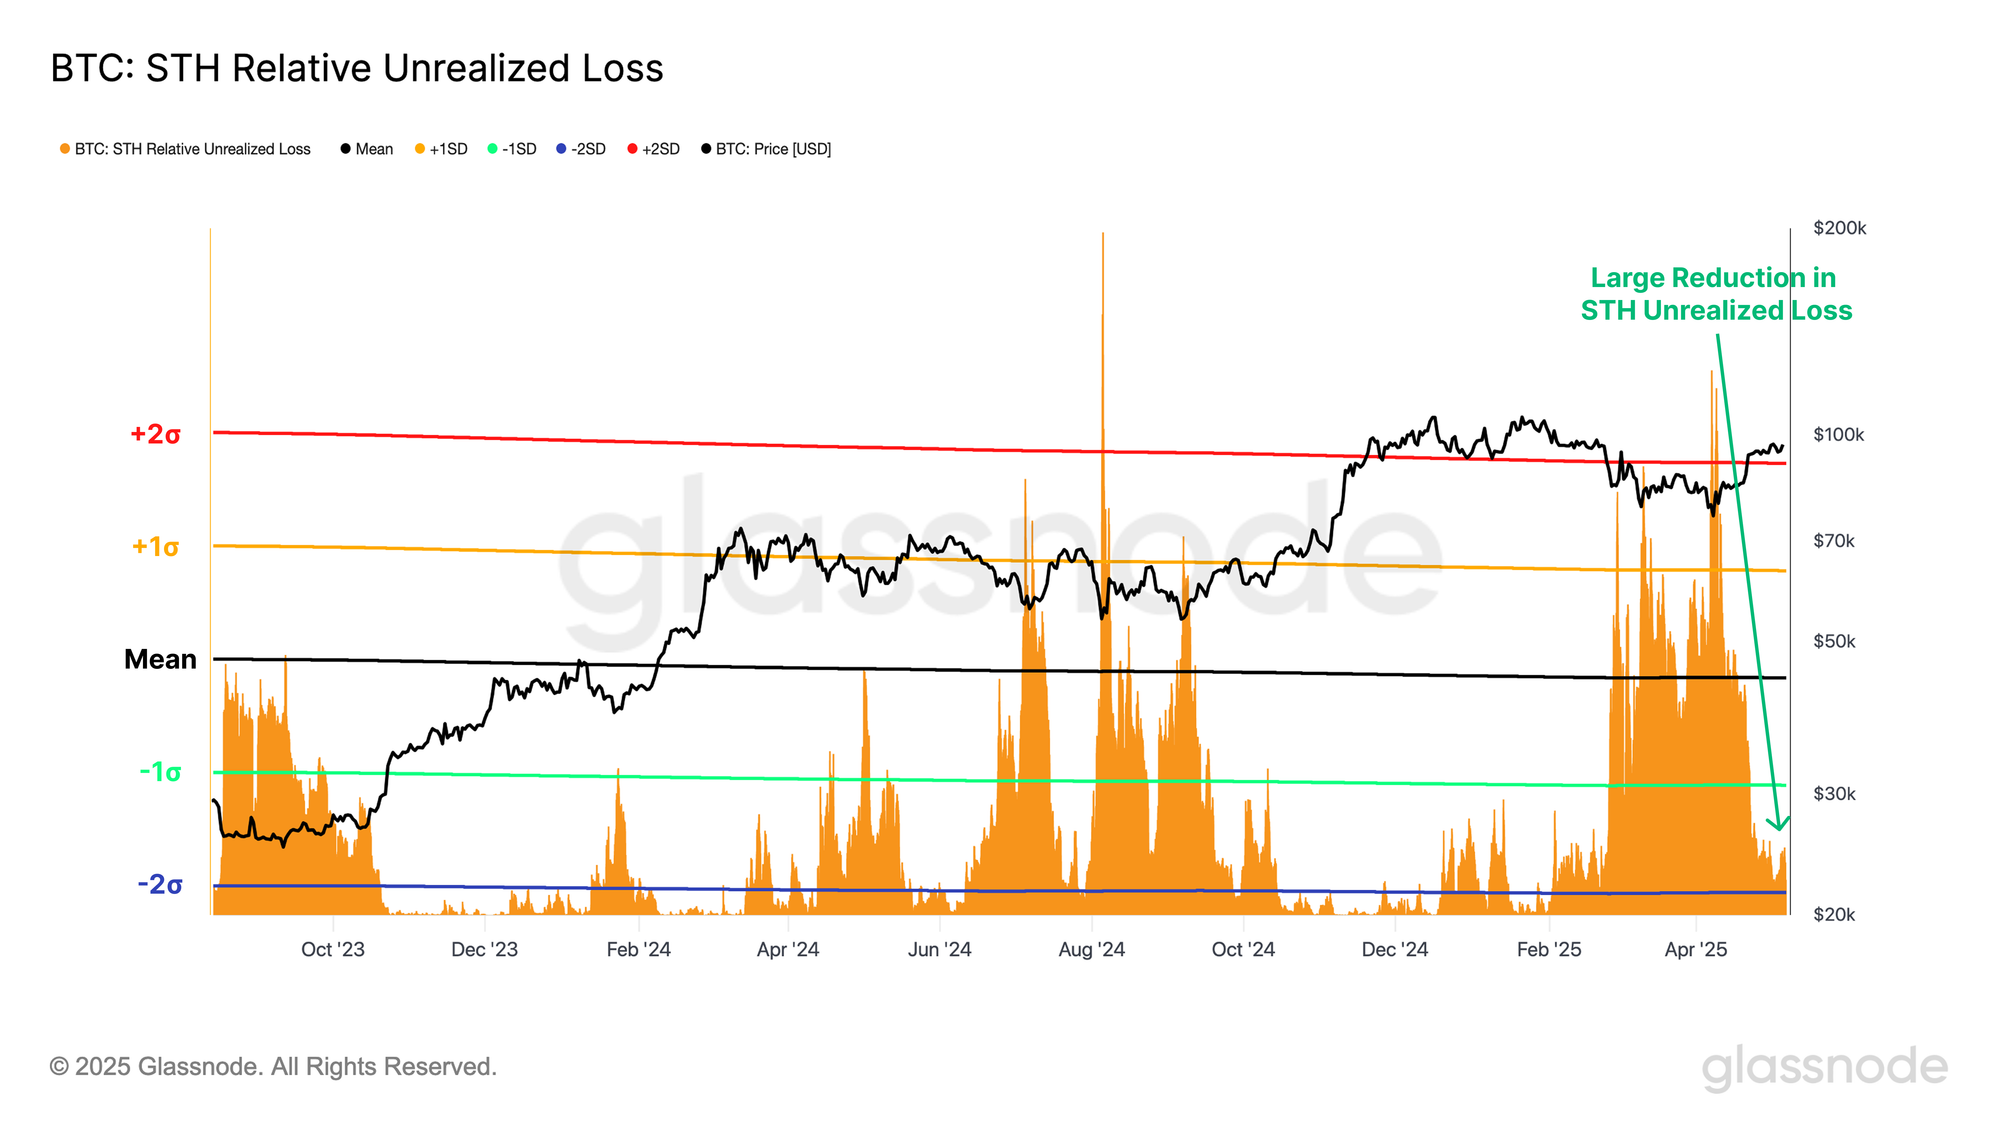
A powerful tool for assessing investor stress is the unrealized loss metric, which reflects the dollar value of paper losses held by investors. Applying this to the Short-Term Holder cohort, we can see two significant periods of elevated stress amongst the new investors:
- The Yen-Carry-Trade unwind in August 2024, which saw STH Relative Unrealized Losses surge above the +2σ band.
- The market downturn in 2025 placed investors into a similar degree of financial stress, with relative unrealized losses surging back above the +2σ. band.
By this measure, this rally has made for a substantial improvement to the portfolio value of new investors, with unrealized losses collapsing from a value above the +2σ band, back towards neutral values.
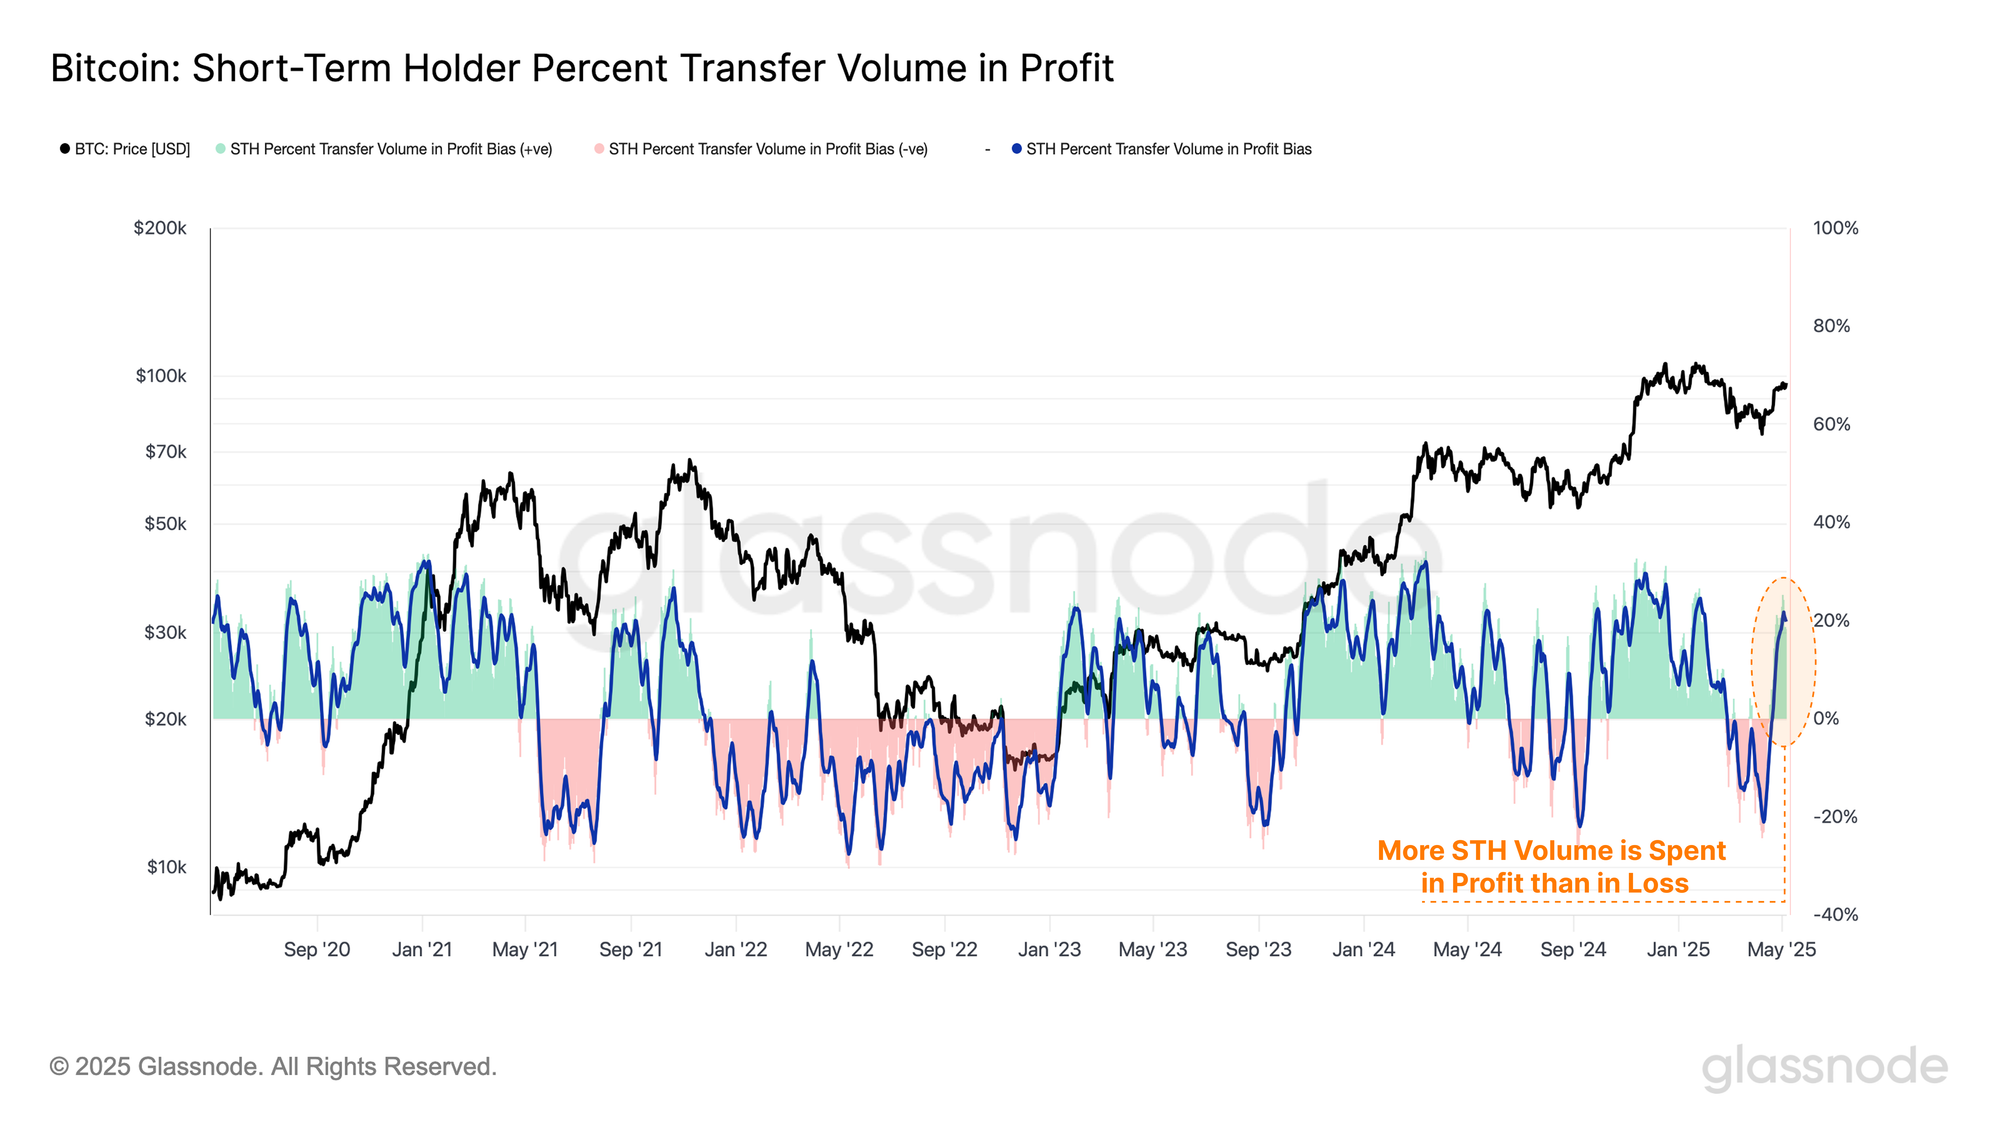
This improvement in these investors portfolios is directly transferring into their spending behavior. The metric below shows the dominance between STH volume spent in profit and in loss, which shows a sharp transition out of the loss-driven regime of just a few weeks ago.
This can potentially be considered as a sort of pivot point, signalling that a critical mass of Short-Term Holder supply has just returned to a state of profit.
ETF Inflows Intensify
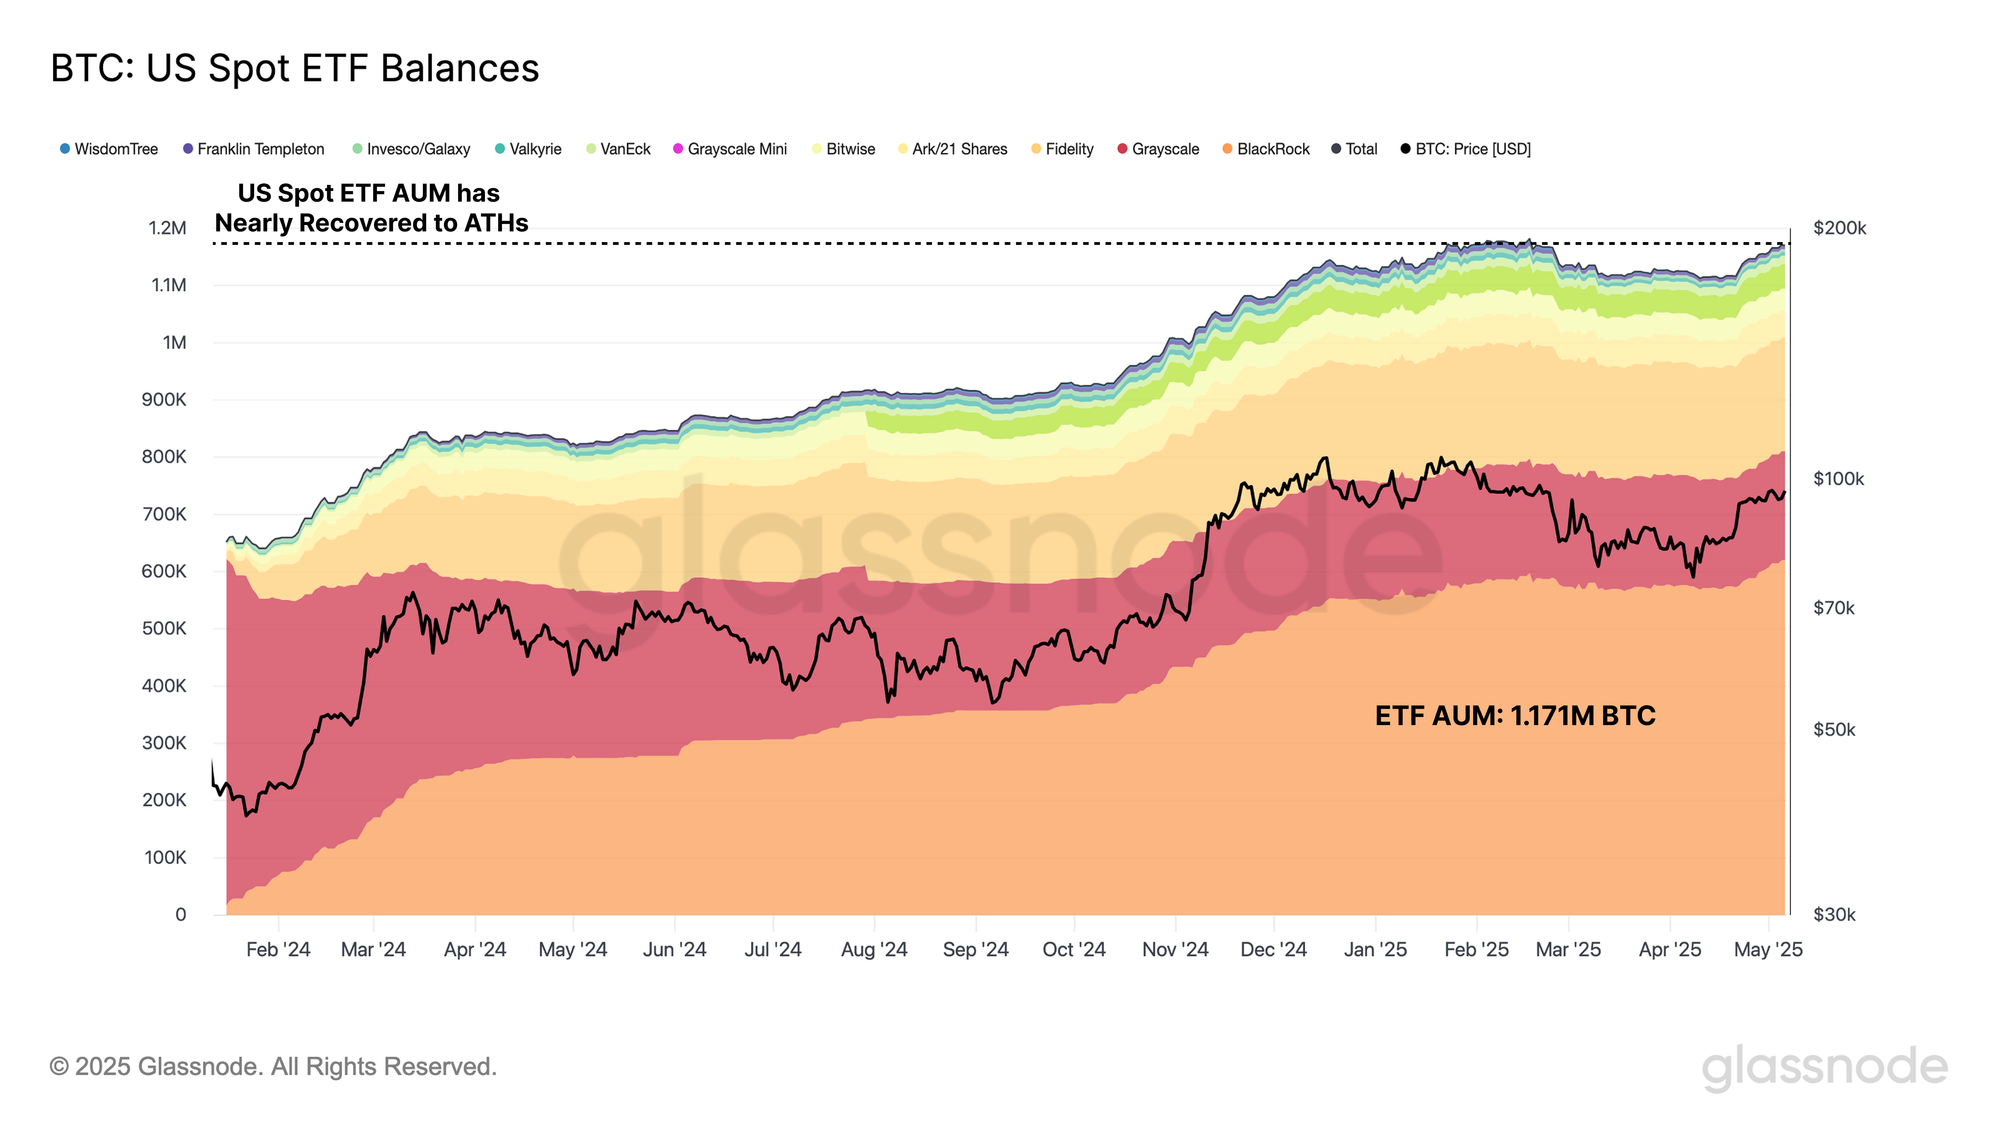
As the BTC price languished during recent months, demand from institutional investors appeared to slow down as well. The ETF complex saw the largest period of sustained outflows on record, with around 70k BTC in net outflows. However, the recent price rebound has sparked renewed confidence amongst these investors, with more than $4.6B flowing into the ETFs over the last two weeks alone.
Strong ETF inflows, alongside improved investor confidence helps to paint a picture of stronger tailwinds supporting the Bitcoin market.
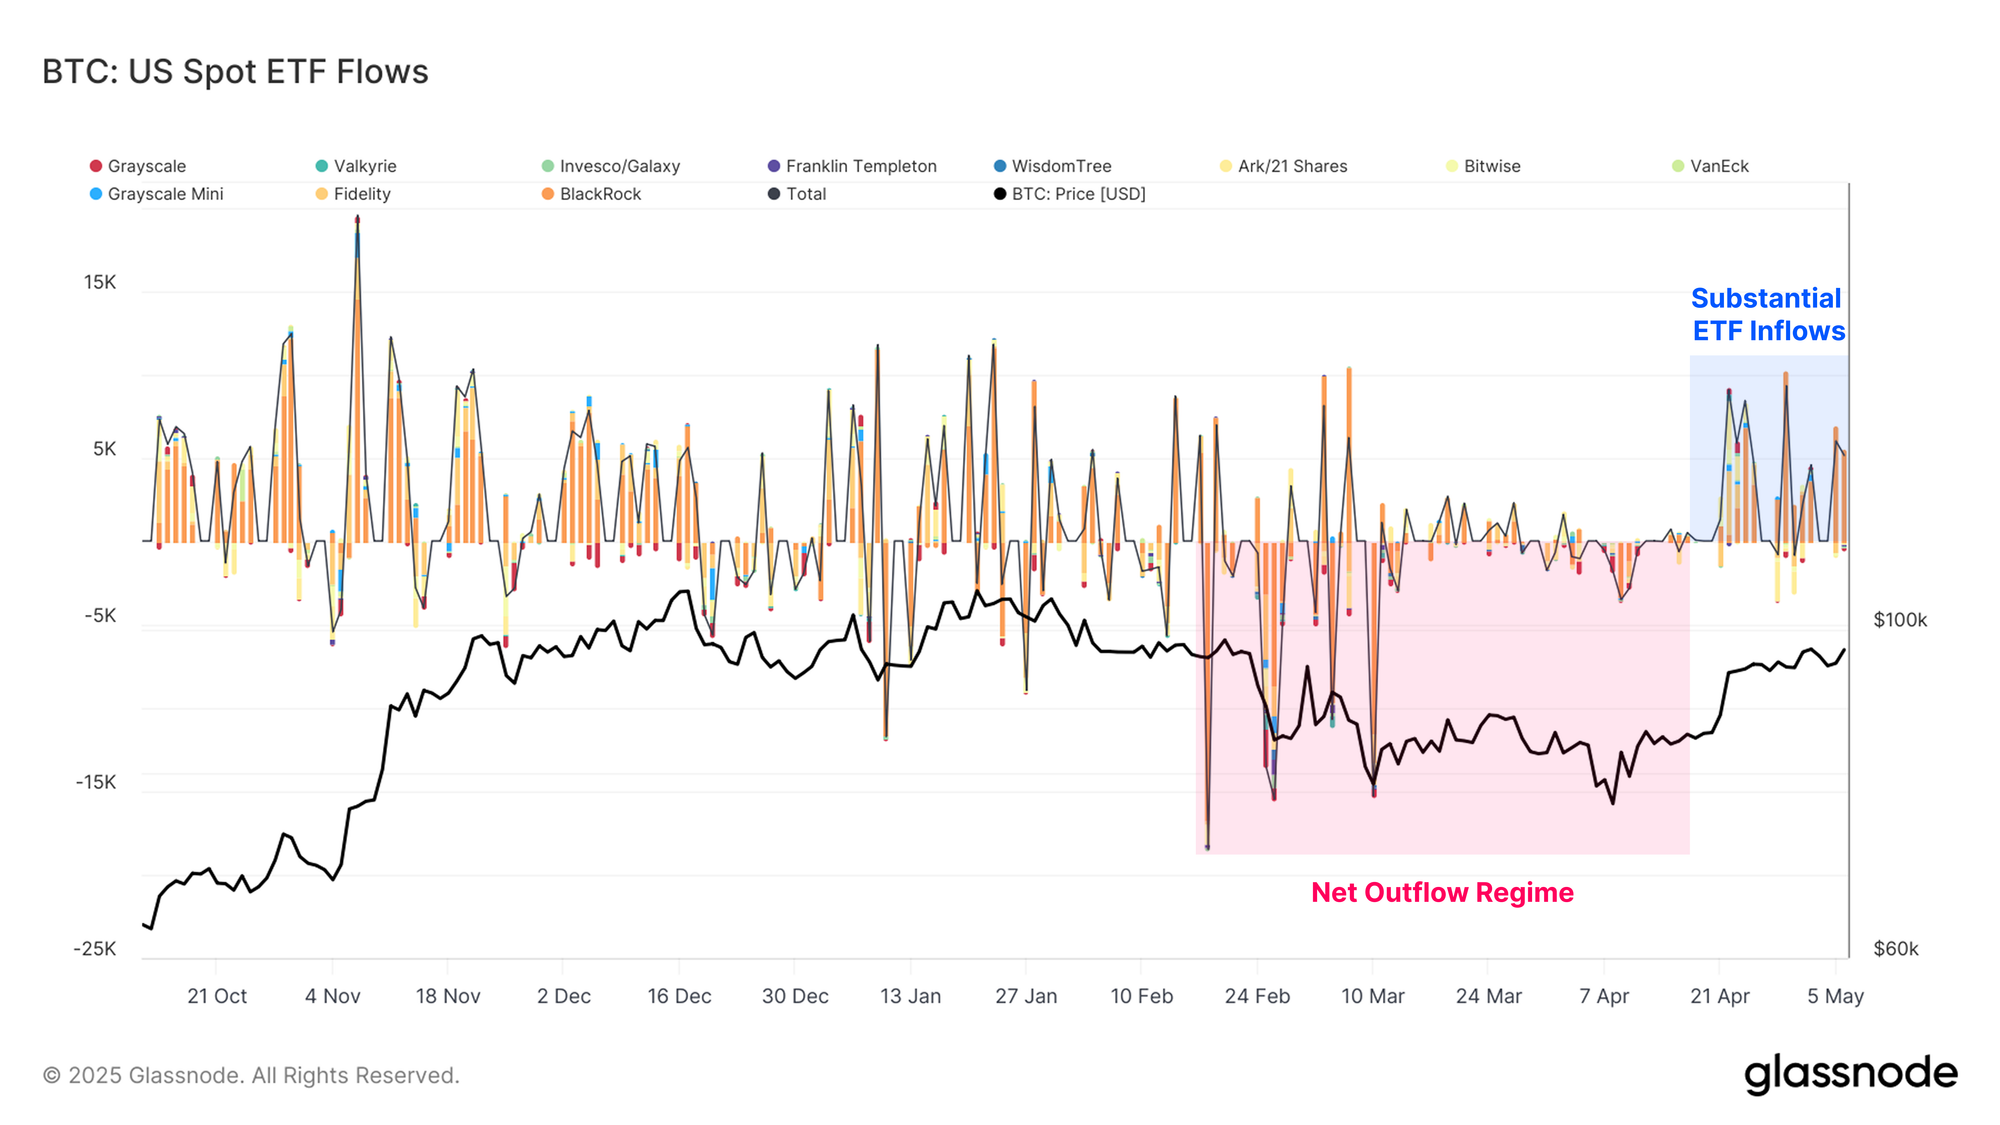
The total AUM held within the US spot ETFs has now climbed to over 1.171M BTC, which is just 11k BTC shy of the 1.182M BTC ATH. The recent wave of inflows has now largely offset the period of outflows we mentioned before, which is another healthy signal for Bitcoin demand.
Volatility Brewing
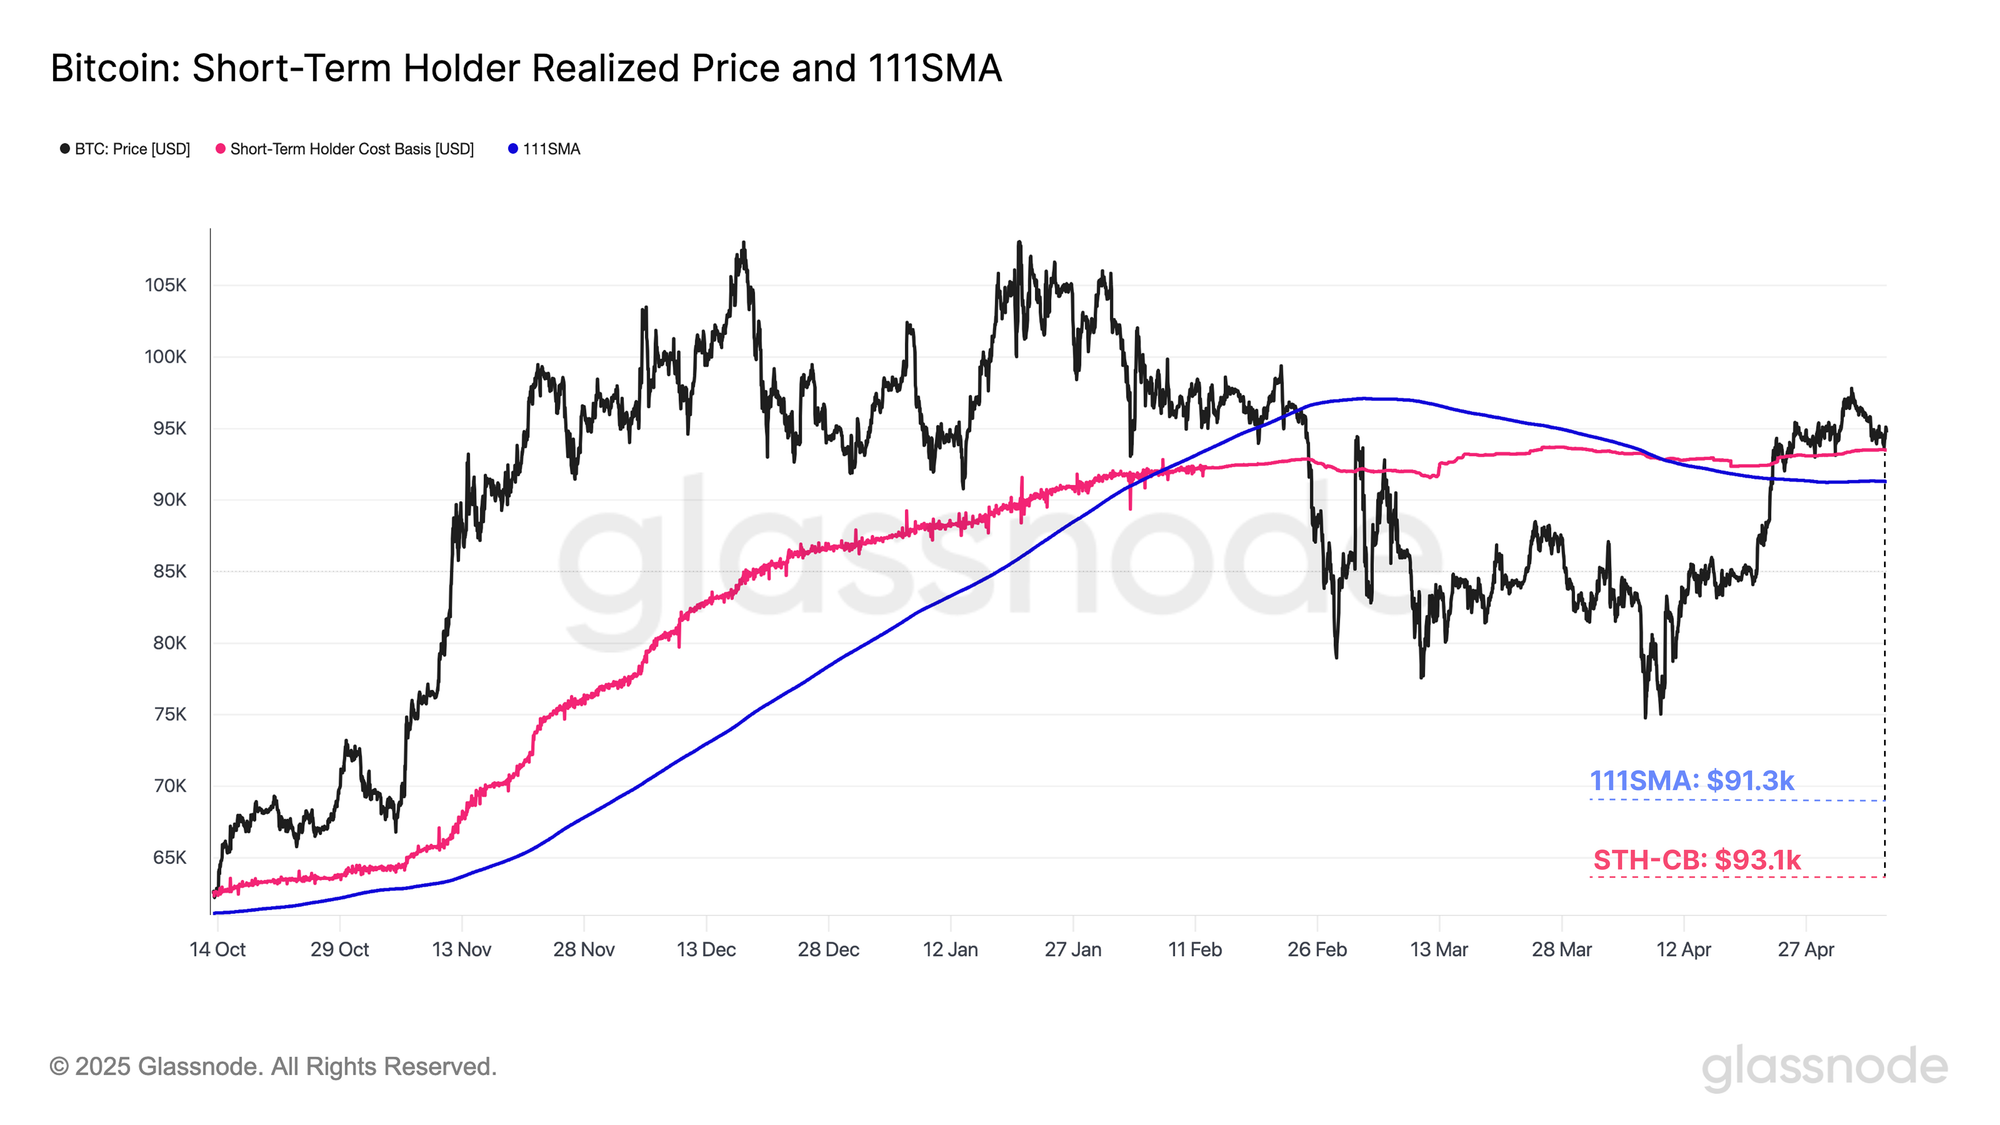
As mentioned in the prior WoC edition, the 111DMA and the Short-Term Holder cost-basis are two critical levels to hold in order for the market to sustain positive price momentum. The recent rally managed to clear both of these price levels, and has since pulled-back to retest demand in that region.
On the daily time-frame, the price has set a higher high, and the market is now attempting to consolidate at these key levels. It is key to hold above these models, as a break back below would bring the recent positive market momentum back into question.
With the market positioned at a critical decision point, assessing volatility expectations becomes an important factor.
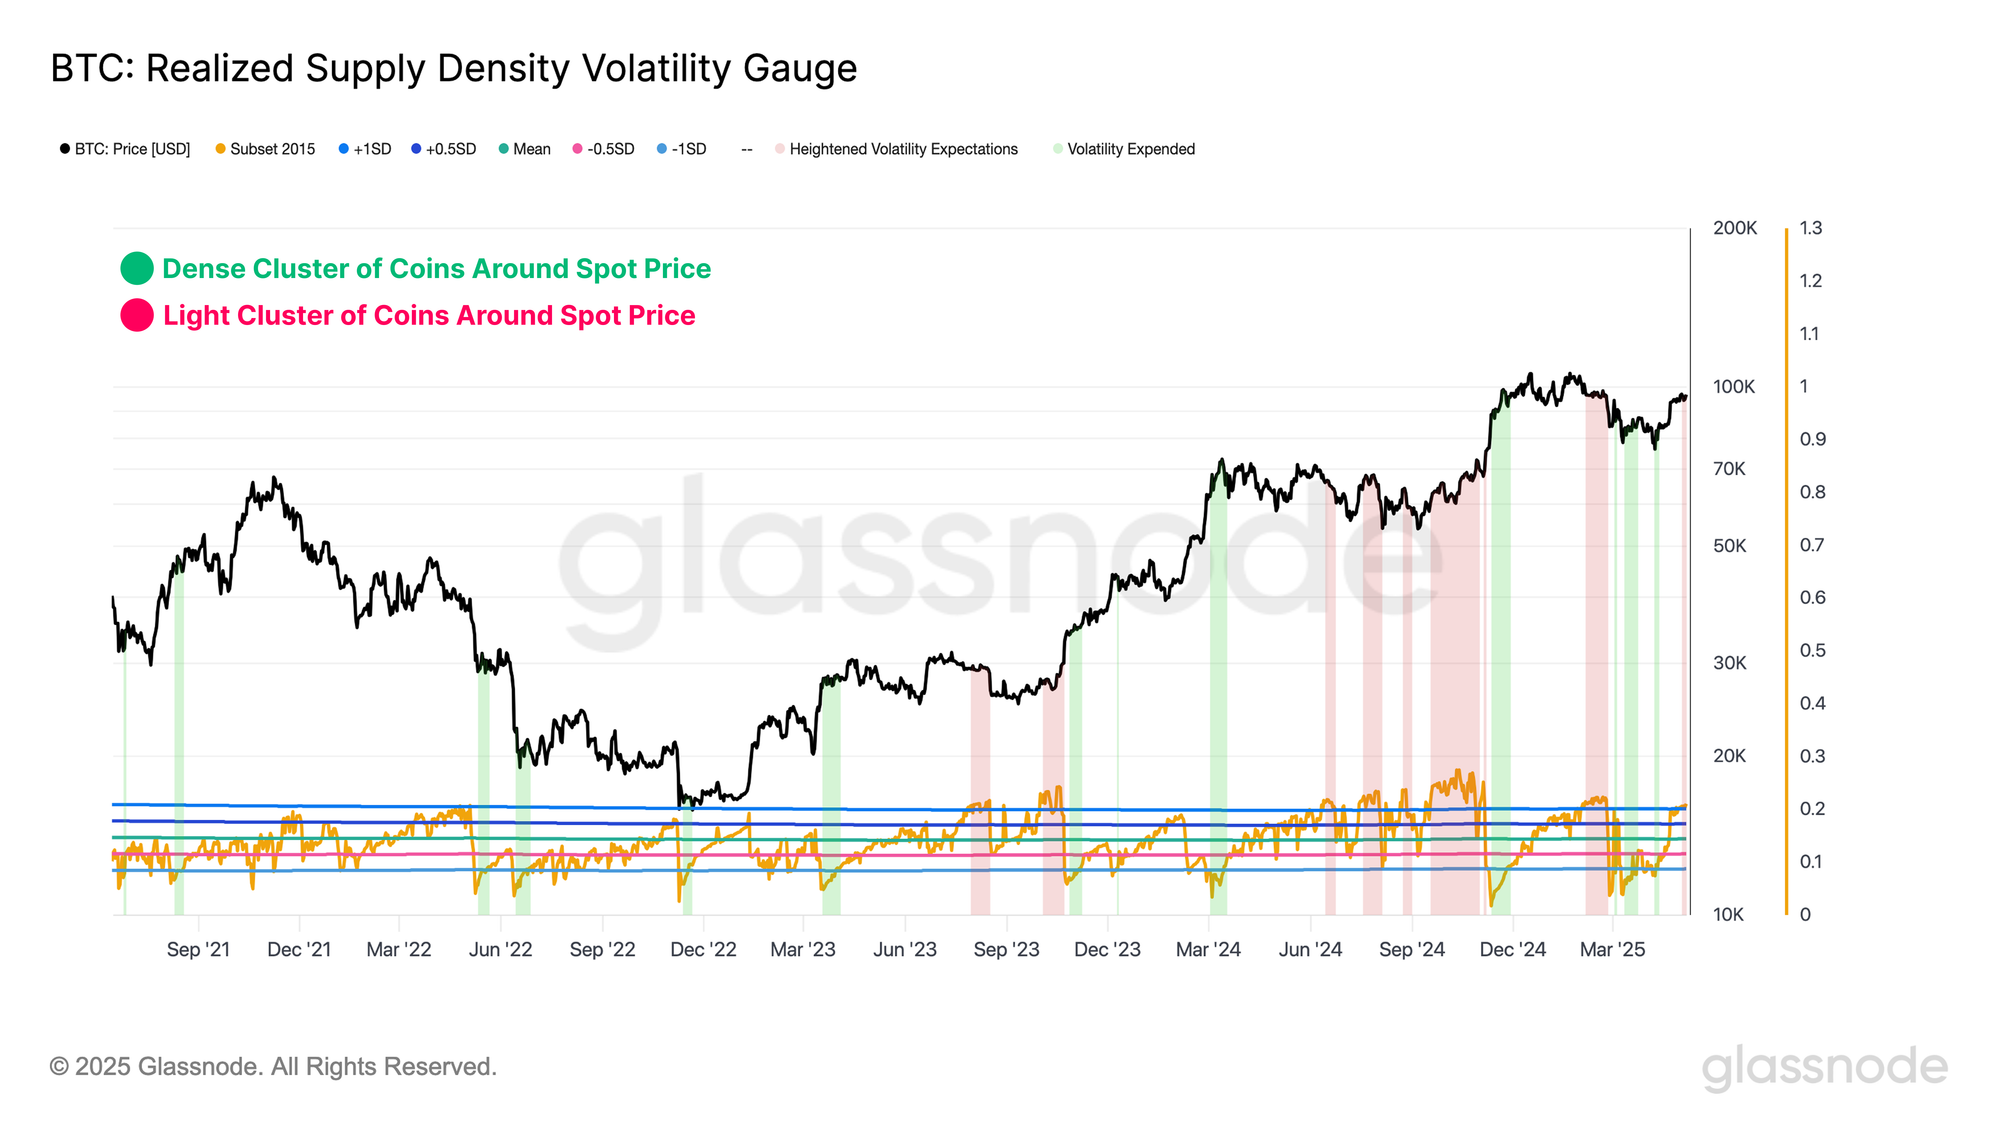
The Realized Supply Density is a useful tool for evaluating the concentration of supply with a cost basis close to the current spot price. Whenever this metric reached high levels, it means a dense cluster of coins have a cost basis close to the price. In such circumstances, small price movements can have an out-sized impact on a broad base of investors. This tends to heighten market sensitivity and by extension, leads to elevated volatility potential.
The Realized Supply Density metric has increased significantly during this rally, which is an interesting phenomena. Generally speaking, we see this metric rise during periods of lengthy consolidation, as more coins change hands in a narrow price range.
In this instance, the rally has actually moved the market back towards an existing supply cluster centred around $95k. These coins were accumulated between December 2024 and February 2025, and have remained held throughout the recent drawdown.
It could be argued that these investors are the most likely ones to de-risk, and sell as close to their cost basis as possible if recent market conditions have concerned them.
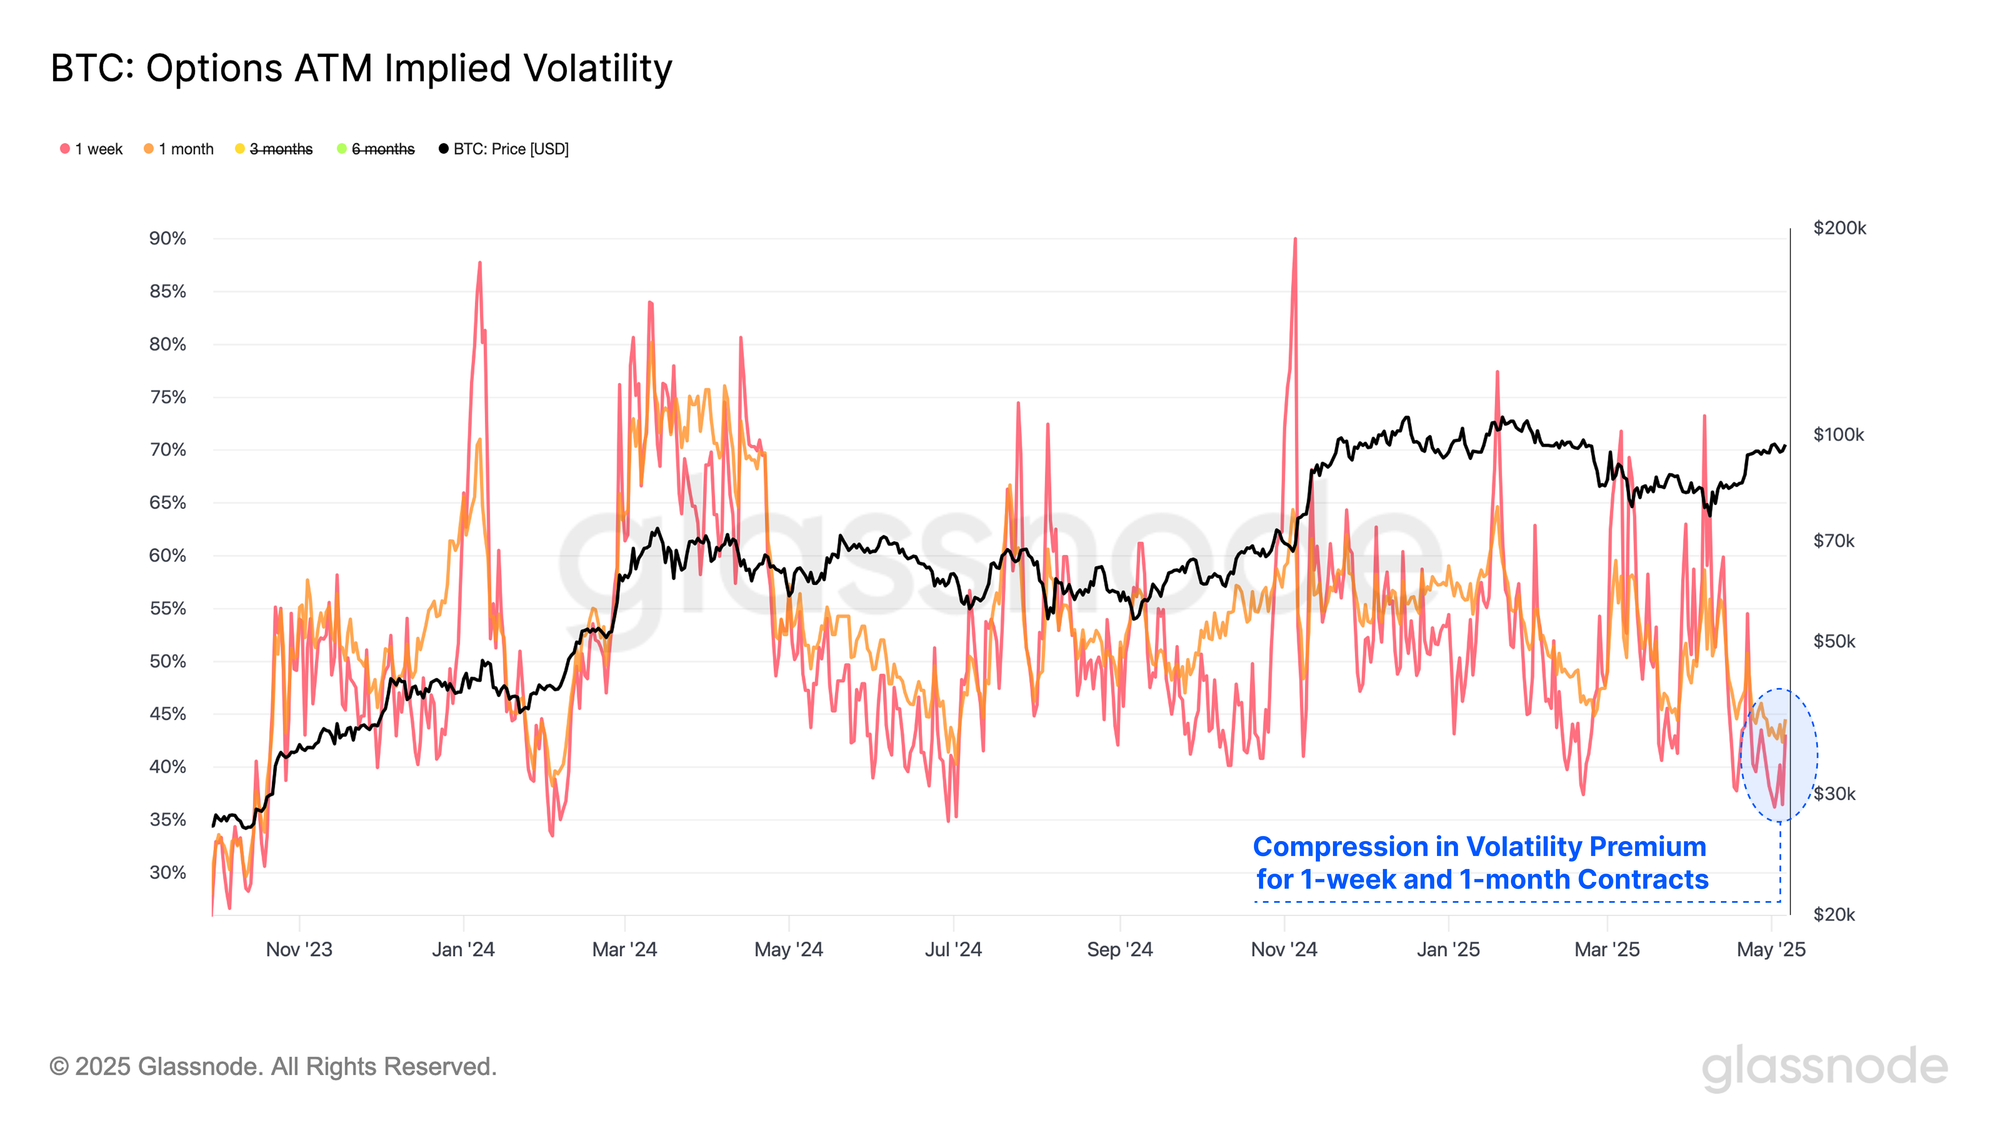
Shifting over to the options domain, we can see that 1-week and 1-month at-the-market implied volatility are falling sharply. Both contract maturities are seeing their IV at their lowest values since July 2024, suggesting options traders are not pricing in expectations for an elevated volatility regime.
Historically, very low IV regimes tend to precede a period of heightened realized volatility, serving as a valuable counter-indicator.
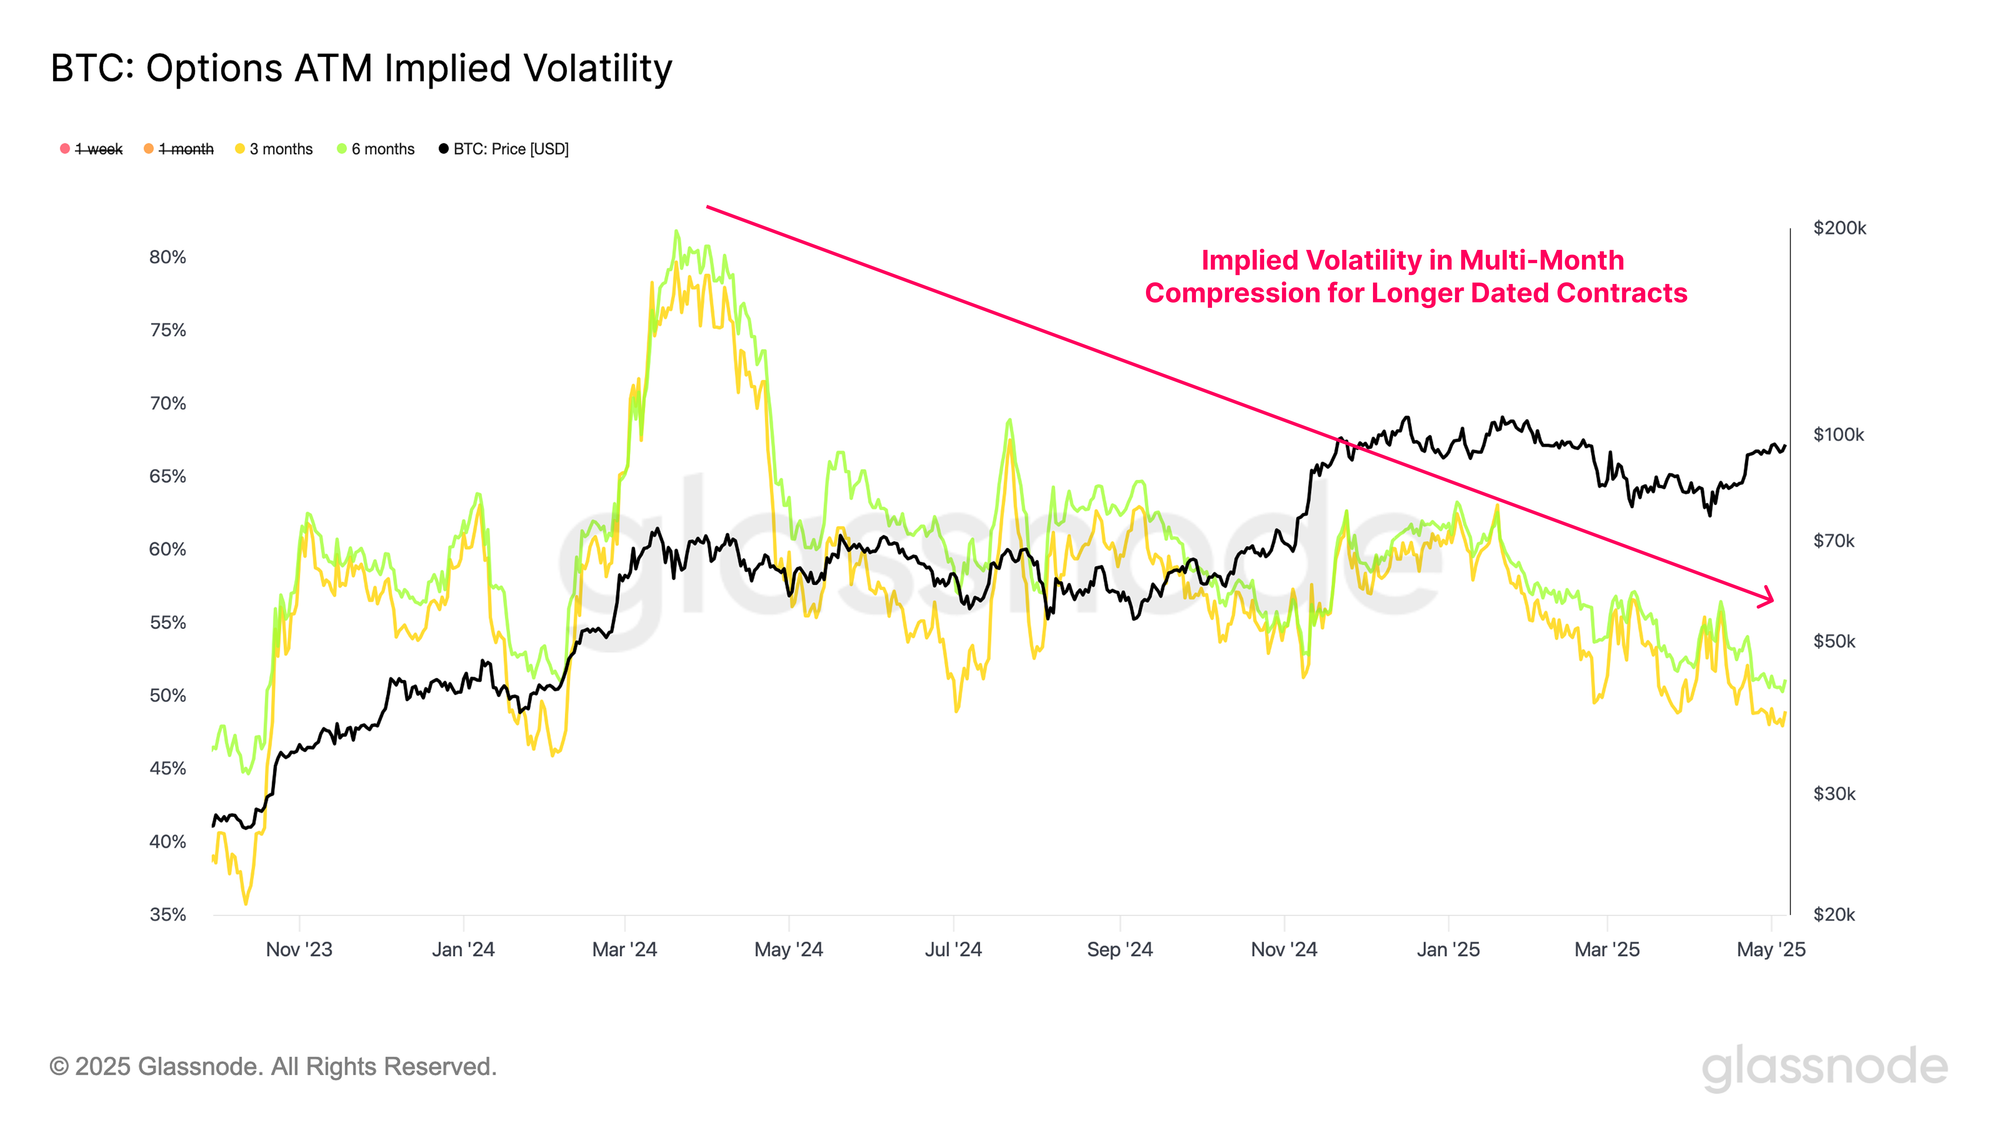
A similar pattern is seen for longer-dated contracts, with implied volatility premiums for both 3-month and 6-month maturities compressing steadily since the March 2024 all-time high. This broad-based contraction in volatility premium indicates that volatility expectations are quite subdued, reinforcing the view that the market may be undervaluing future volatility.
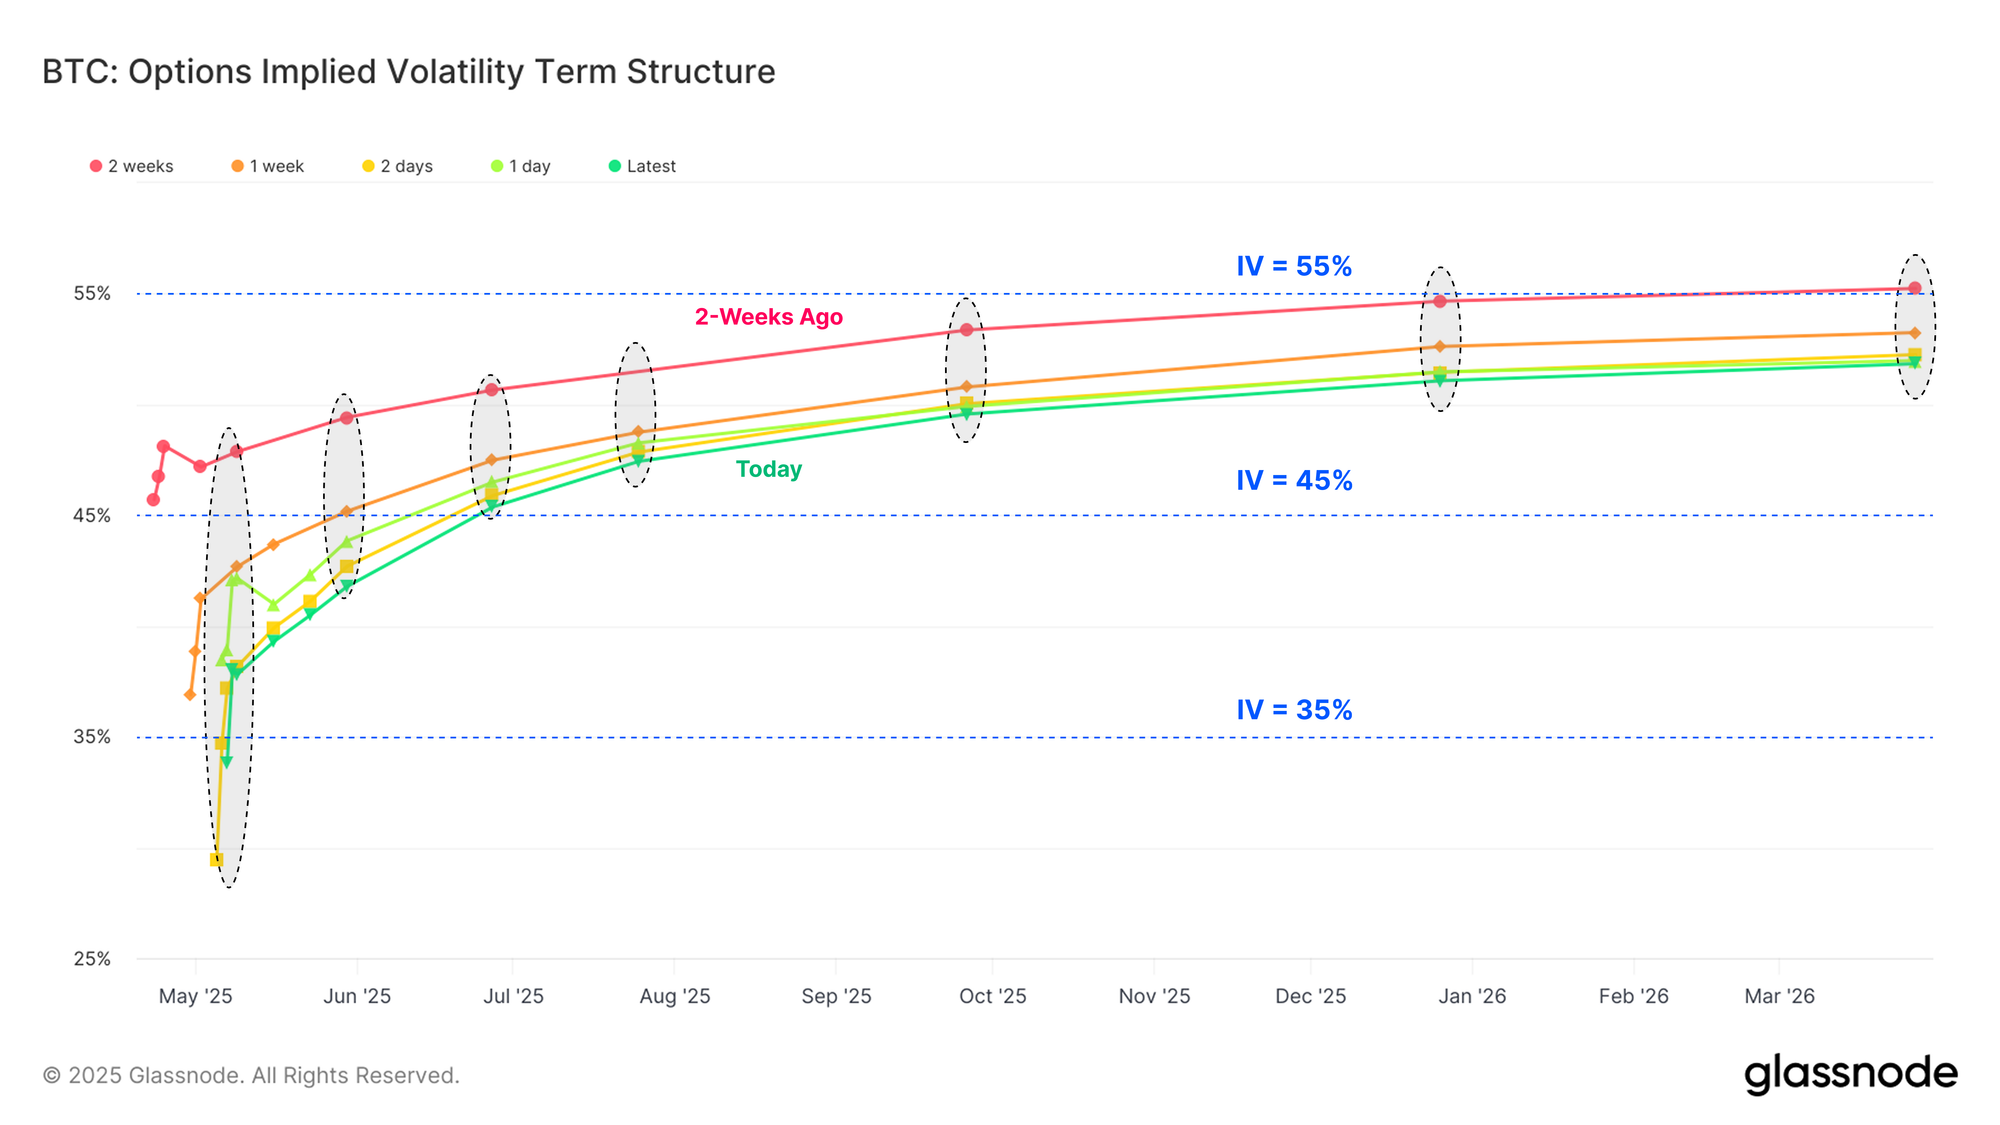
We can see the gradual compression of volatility premiums via the IV term structure, which illustrates the changes in implied volatility priced into the market over the last two weeks. This shows the contraction in IV across all contracts, with the most pronounced declines occurring in May-dated contracts.
Interestingly, options expiring as far out as March 2026 are currently priced with a volatility premium just above 50%, which is a historically low level. This perhaps reflects the maturation of Bitcoin over time, and the 2023-25 cycle has certainly seen Bitcoin trade in a much lower volatility regime compared to past cycles.
Summary and Conclusions
The recent strength in the Bitcoin price has returned more than +3M BTC into a position of profit, significantly easing the financial stress that had been mounting among investors since the market decline from the Dec-2024 ATH. This rebound has sparked an uptick in fresh capital inflows, and has seen the Realized Cap expanding by 2% over the last month.
The AUM held within the US spot ETFs have seen over $4.5B in inflows over the last two weeks, offsetting the majority of the outflows which occurred in March and April. Volatility premiums are compressed in options markets, and there are several on-chain indicators suggesting the market is at a critical decision point, and volatility may be under-priced as a result.
Disclaimer: This report does not provide any investment advice. All data is provided for informational, and educational purposes only. No investment decision shall be based on the information provided here and you are solely responsible for your own investment decisions.
Exchange balances presented are derived from Glassnode’s comprehensive database of address labels, which are amassed through both officially published exchange information and proprietary clustering algorithms. While we strive to ensure the utmost accuracy in representing exchange balances, it is important to note that these figures might not always encapsulate the entirety of an exchange’s reserves, particularly when exchanges refrain from disclosing their official addresses. We urge users to exercise caution and discretion when utilizing these metrics. Glassnode shall not be held responsible for any discrepancies or potential inaccuracies.
Please read our Transparency Notice when using exchange data.
- Join our Telegram channel.
- For on-chain metrics, dashboards, and alerts, visit Glassnode Studio.