Bitcoin’s 4% drop in 12 hours looks painful – Here’s why it could be opposite

ambcryptoPublished on 2026-03-22Last updated on 2026-03-22

Abstract

Bitcoin's recent 4% price drop to $68.2k triggered $111.4 million in long liquidations, potentially influenced by US-Iran tensions. Despite the decline, analysis suggests the dip may present a buying opportunity. Key factors include the underestimated potential impact of Morgan Stanley's Spot Bitcoin ETF and a 10.2% drop in hash rate indicating miner stress but not significant selling. Technical charts show a bearish swing structure but bullish internal momentum, with projections indicating a possible rally toward $78.4k-$89.8k. A bullish RSI divergence and Fibonacci golden pocket support this outlook. However, a drop below $65.6k would invalidate the bullish scenario.

It was reported that the potential impact of the upcoming Morgan Stanley Spot Bitcoin ETF could be underestimated.

In fact, it was projected that a 2% allocation by the $8 trillion AUM Morgan Stanley Wealth Management, which recommends a BTC allocation of up to 4%, could flip BlackRock’s IBIT in size.

Alongside these projections, the hash rate witnessed a 10.2% drop. It showcased miner stress and signaled tactical shutdowns and weaker operators leaving the network.

AMBCrypto reported that the miner reserves reflect reward absorption and not significant selling.

Volatility during weekends continued to threaten short-term holders and traders. The most recent price drop to $68.2k on Sunday, the 22nd of March, triggered $111.4 million in long liquidations in 24 hours.

It was likely a result of the flaring US-Iran tensions.

These were relatively tame numbers compared to liquidation flushes earlier this year. Could this mean that the price has further to fall?

Exploring the Bitcoin retracement phase

Source: BTC/USDT on TradingView

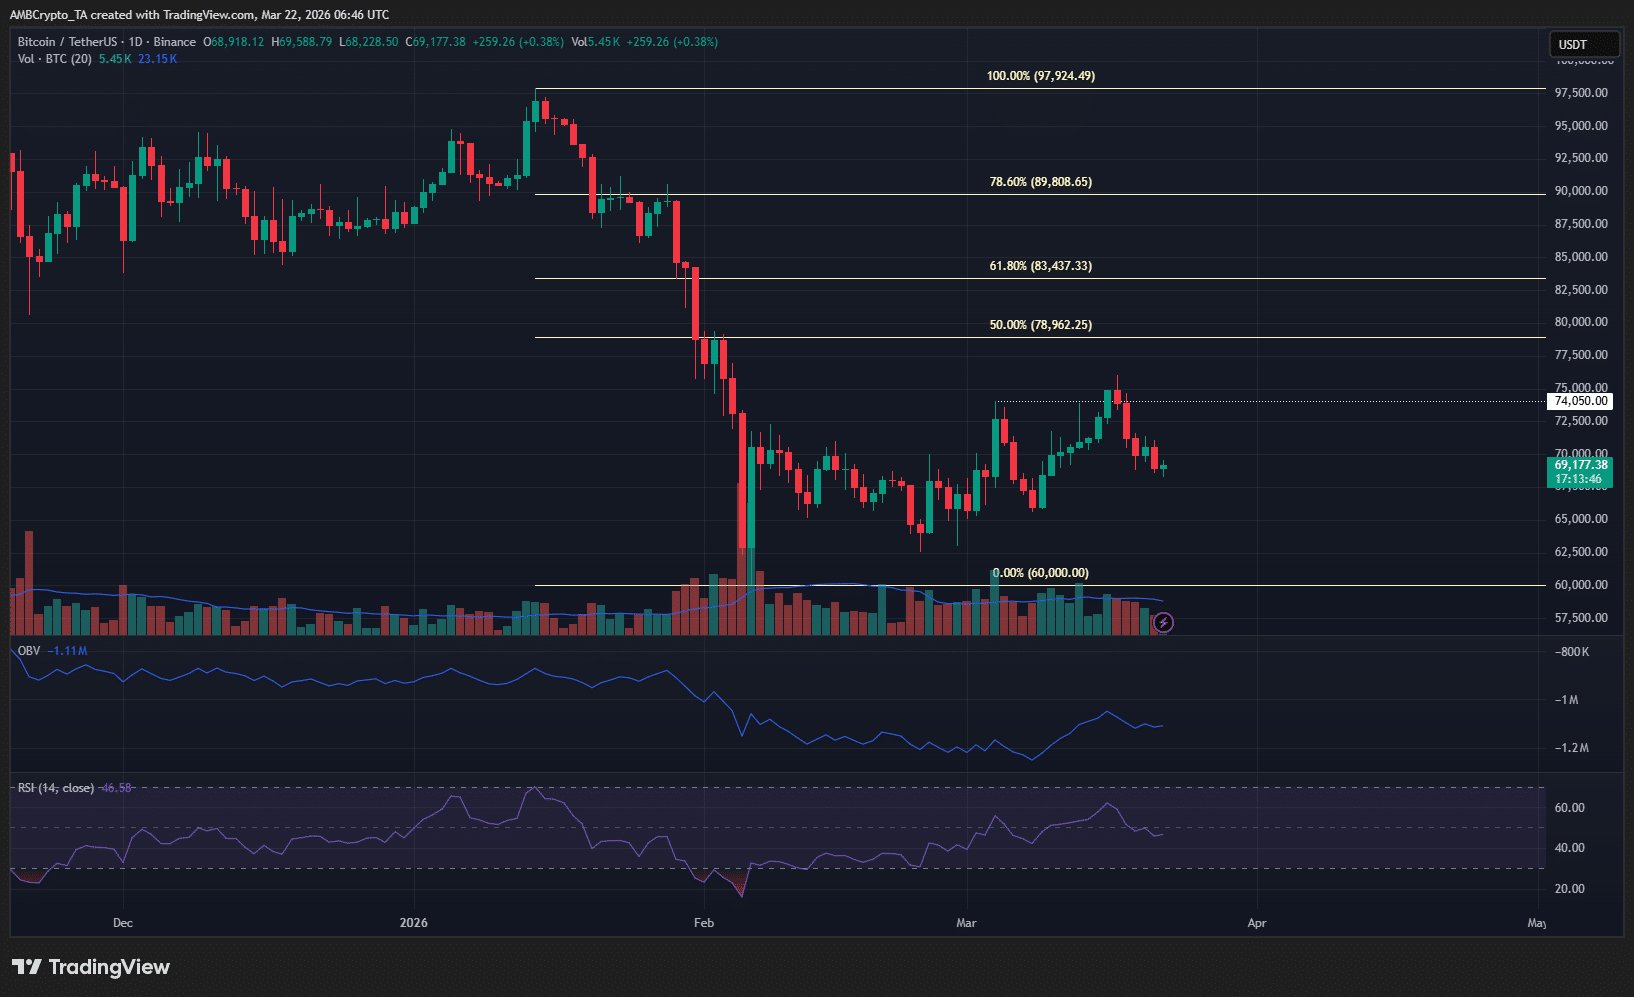
The 1-day chart was straightforward. The swing structure was bearish, but the internal structure has flipped bullishly.

This meant that Bitcoin [BTC] was likely to push higher in the coming weeks, despite the dip in hash rate.

The current rally is part of a wider retracement that can go up to $83.4k-$89.8k.

Traders’ call to action- Buy

In a post on X, crypto trader CrypNuevo observed that the drop to the $69k level could see a price rebound. It could also be accompanied by a deeper price drop, which has occurred in recent hours.

Source: BTC/USDT on TradingView

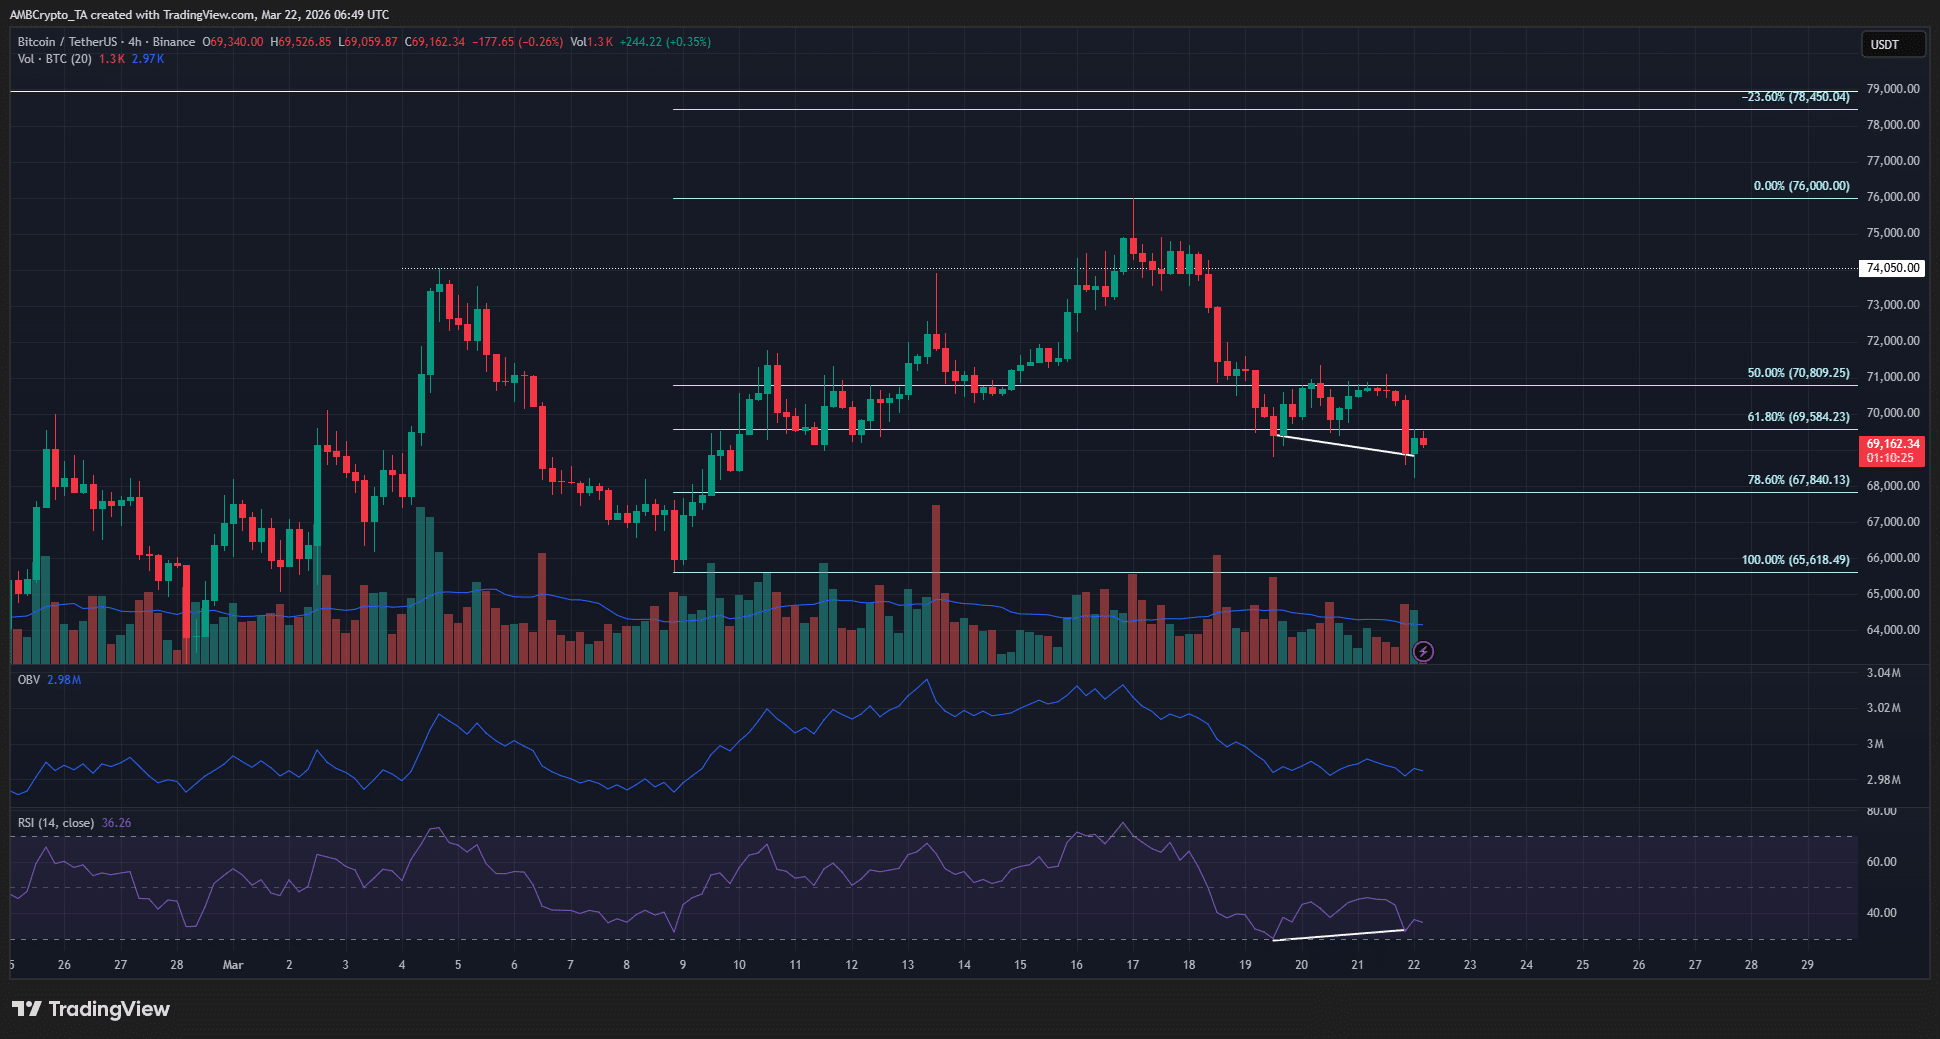
The buying opportunity has arrived. The BTC price has made a bullish divergence with the RSI indicator. It also has a bullish swing structure on the 4-hour chart.

Though the internal structure was bearish, the price was within the Fibonacci golden pocket.

The divergence and golden pocket combined to suggest that Bitcoin is likely to rally to the 23.6% extension level at $78.4k over the next week or two.

However, the downtrend in the OBV over the past week was telling of steady bearish pressure. If it continues and forces a price drop below $65.6k, the bullish idea outlined here would be invalidated.


Final Summary

  • The Bitcoin price action was in a bearish long-term trend and a bullish short-term trend.
  • BTC’s recent retracement below $69k likely offered a buying opportunity. It has already made a bullish divergence with momentum.

Related Questions

QWhat was the potential impact of the upcoming Morgan Stanley Spot Bitcoin ETF, according to the article?

AThe article stated that the potential impact of the upcoming Morgan Stanley Spot Bitcoin ETF could be underestimated, and a 2% allocation by the firm could flip BlackRock's IBIT in size.

QWhat two key factors did the article cite as reasons for the recent drop in Bitcoin's hash rate?

AThe drop in hash rate was attributed to miner stress, which signaled tactical shutdowns and weaker operators leaving the network.

QAccording to the trader CrypNuevo, what did the drop to the $69k level represent?

ACrypNuevo observed that the drop to the $69k level could see a price rebound, indicating a potential buying opportunity.

QWhat two technical analysis signals suggested that Bitcoin price rally was likely?

AThe two technical signals were a bullish divergence with the RSI indicator and the price being within the Fibonacci golden pocket.

QWhat key price level would invalidate the bullish idea presented in the article?

AThe bullish idea would be invalidated if the price dropped below $65.6k.

Related Reads

Trading

Spot
Futures

Hot Articles

How to Buy 4

Welcome to HTX.com! We've made purchasing 4 (4) simple and convenient. Follow our step-by-step guide to embark on your crypto journey.Step 1: Create Your HTX AccountUse your email or phone number to sign up for a free account on HTX. Experience a hassle-free registration journey and unlock all features.Get My AccountStep 2: Go to Buy Crypto and Choose Your Payment MethodCredit/Debit Card: Use your Visa or Mastercard to buy 4 (4) instantly.Balance: Use funds from your HTX account balance to trade seamlessly.Third Parties: We've added popular payment methods such as Google Pay and Apple Pay to enhance convenience.P2P: Trade directly with other users on HTX.Over-the-Counter (OTC): We offer tailor-made services and competitive exchange rates for traders.Step 3: Store Your 4 (4)After purchasing your 4 (4), store it in your HTX account. Alternatively, you can send it elsewhere via blockchain transfer or use it to trade other cryptocurrencies.Step 4: Trade 4 (4)Easily trade 4 (4) on HTX's spot market. Simply access your account, select your trading pair, execute your trades, and monitor in real-time. We offer a user-friendly experience for both beginners and seasoned traders.

3.6k Total ViewsPublished 2025.10.20Updated 2025.10.29

How to Buy 4

Discussions

Welcome to the HTX Community. Here, you can stay informed about the latest platform developments and gain access to professional market insights. Users' opinions on the price of 4 (4) are presented below.

活动图片