ZANO targets $17 after 73% surge – Should traders wait for a dip?

ambcryptoPublished on 2026-03-22Last updated on 2026-03-22

Abstract

ZANO experienced a significant 73% price surge in a week after testing its long-term demand zone at $5.5-$6.0. While the weekly chart suggests a potential rally toward the range highs at $17.2 over the next few months, short-term indicators show signs of overextension. The 4-hour chart reveals a divergence in OBV and an overbought MFI, indicating a possible retracement. Traders may find a buying opportunity if the price dips to the $8.1-$9.2 support region, a high-volume node that could serve as a consolidation area. A drop below $8.1 wouldn't invalidate the bullish weekly structure but could offer a better entry point for long positions.

Bitcoin [BTC] has rallied over the past month, but the altcoin market cap has grown less than that of Bitcoin. In other words, the altcoin market was relatively quiet, and only a few altcoins were performing remarkably well.

One such altcoin was Zano [ZANO]. In a week, ZANO prices have surged by 73% after the altcoin tested its long-term demand zone at $5.5-$6.0. The bullish reaction from this region was not enough to flip the long-term bearish outlook, but it did offer swing buyers an opportunity.

Source: ZANO/USDT on TradingView

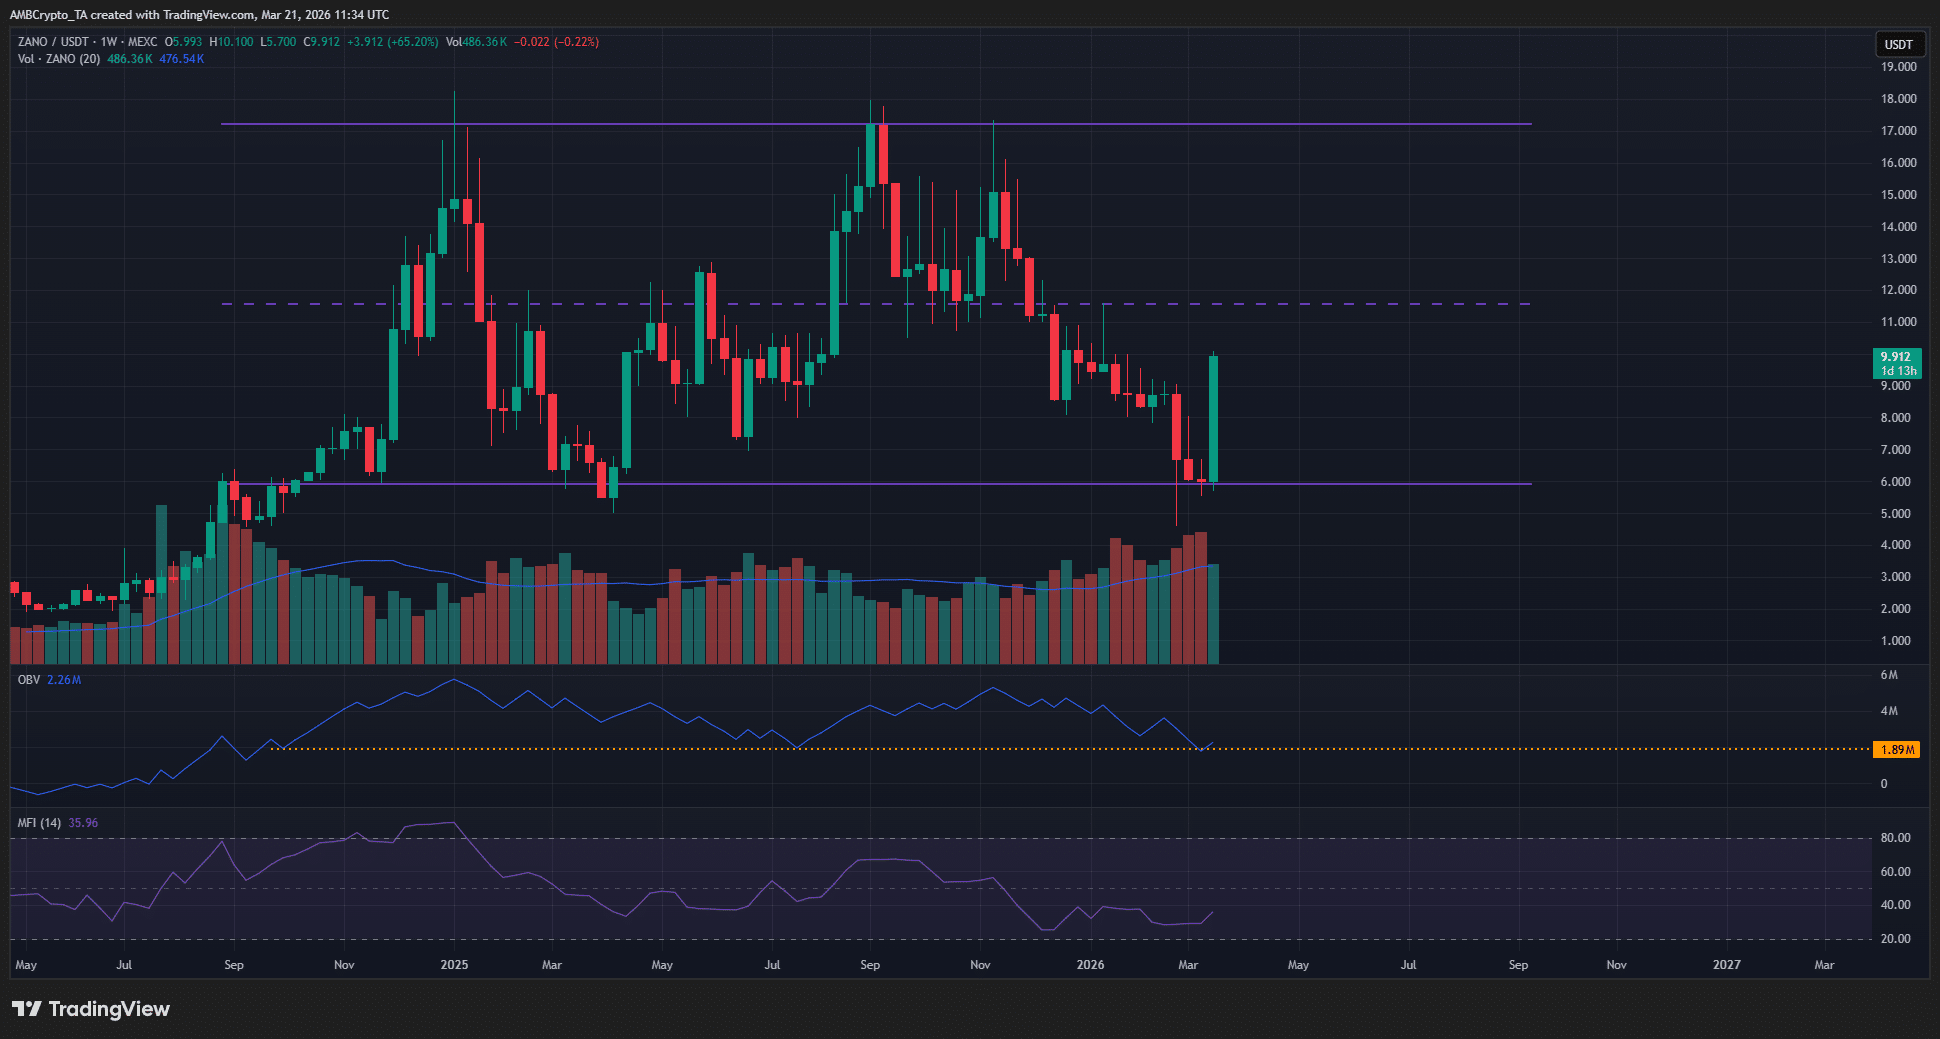
The weekly chart showed that the range lows at $5.9 prompted a swift bullish reaction over the past week. Interestingly, the OBV was at the same multi-month low, stretching back to September 2024.

In other words, over the long time horizons, buying and selling pressure on the altcoin has been quite balanced. This reinforced the strength of the range and presented a good buying opportunity for long-term investors.

It was highly likely that ZANO would rally to the range highs at $17.2 over the next 3-4 months. The last time the range low was tested was in March 2025. By September 2025, the altcoin had reached its range highs.

Is it too late for traders to look for long positions?

After an asset makes a strong, trend-changing move, traders are faced with a vital question. Do they wait for a pullback, or does the move have enough steam to continue without a sizeable retracement?

Retracements are a healthy part of the market, but do not always occur. Waiting for one could mean you miss the next move, too.

Source: ZANO/USDT on TradingView

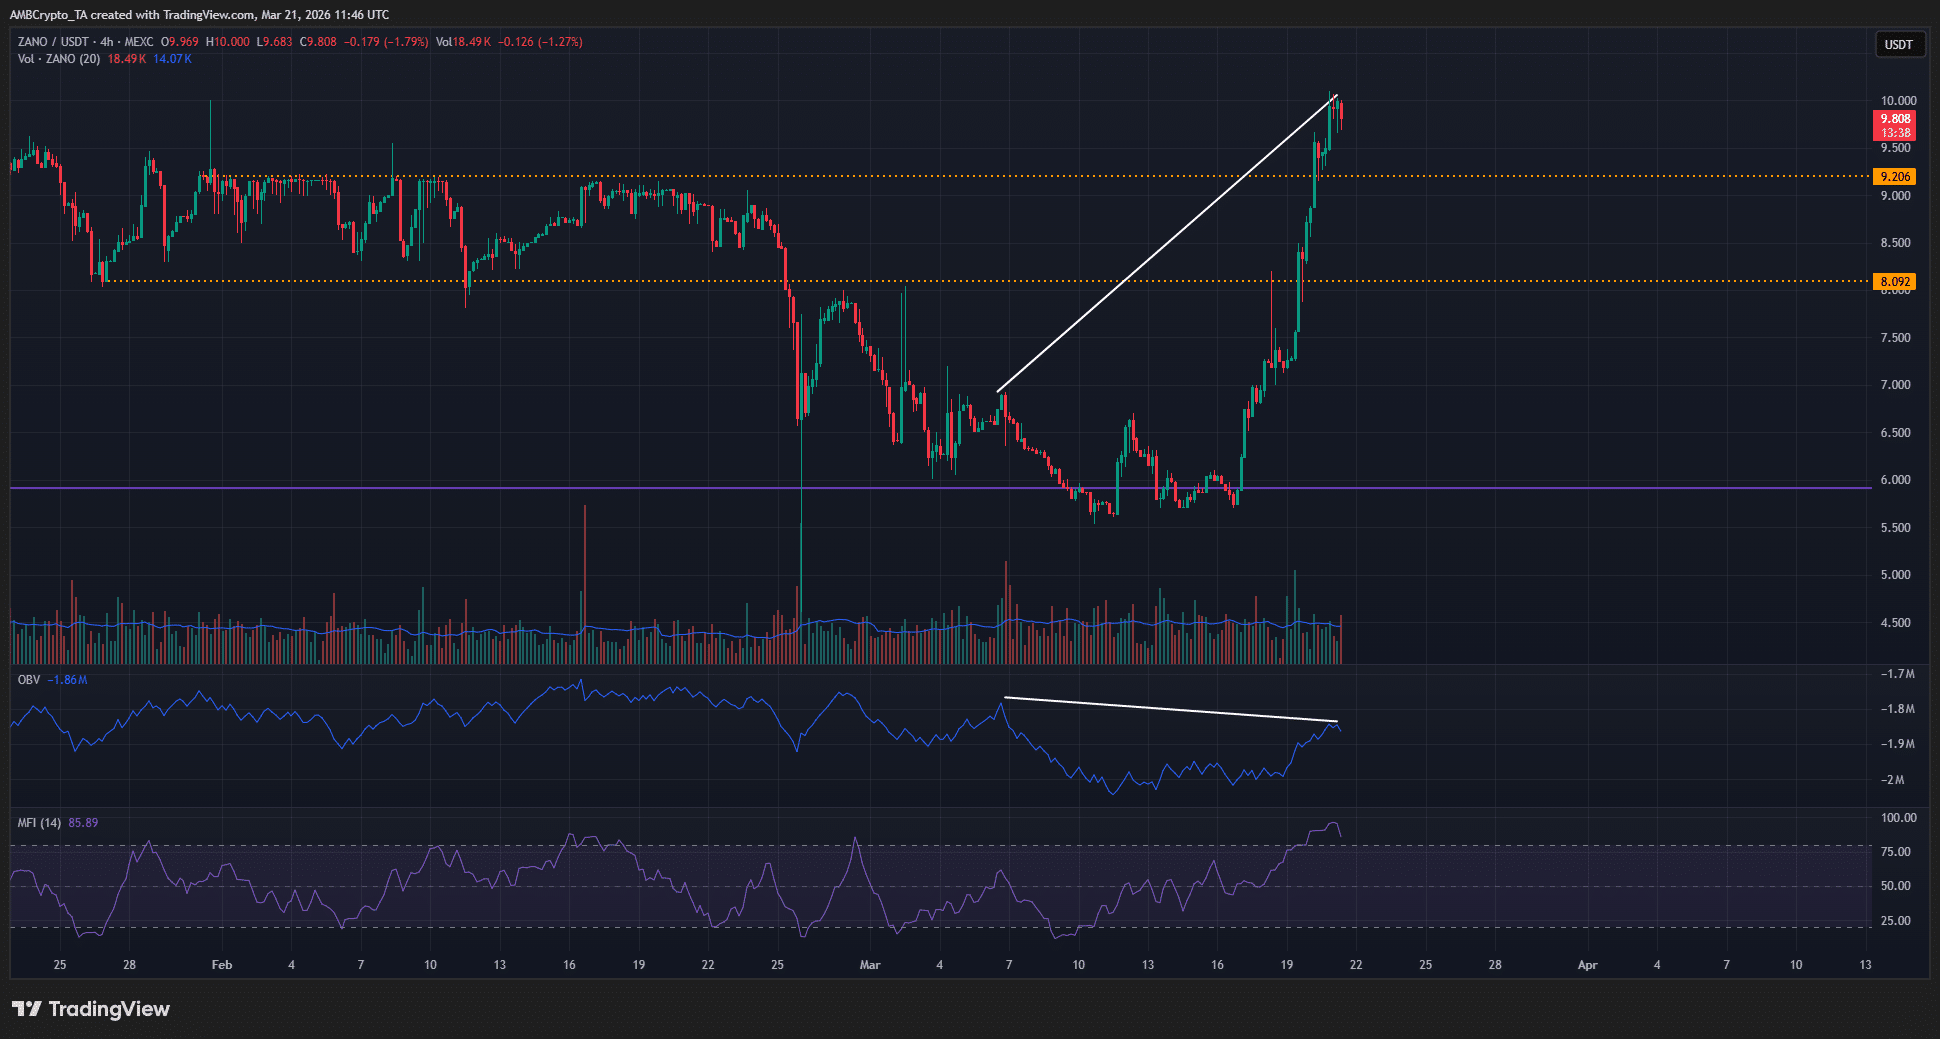
The OBV and the price made a sizeable divergence on the 4-hour timeframe. At the same time, the MFI was in overbought territory. Together, they suggested that ZANO might be overextended in the short-term.

The altcoin spent a considerable amount of time trading within the $8.1-$9.2 area. This made it a high-volume trading node that was likely to act as a support in case of a retracement. Therefore, traders can wait for a price dip into this region before looking to buy.

A drop below $8.1 will neither invalidate the weekly range idea nor introduce a bearish H4 structure. The up-only price action of the past week has left sizeable imbalances and offered hardly any consolidation that marked out key local support levels.


Final Summary

  • Zano fell to the long-term range lows and saw an immediate reaction, rallying 73% in a week.
  • In the short-term, a price dip to $8-$9 can offer a buying opportunity. The explosive nature of recent days’ price action can make it harder for bulls to use a dip to go long.

Related Questions

QWhat was the price surge percentage for ZANO in the past week, and from which demand zone did it react?

AZANO surged by 73% in the past week after reacting from its long-term demand zone at $5.5-$6.0.

QAccording to the weekly chart analysis, what is the projected price target for ZANO and the expected timeframe to reach it?

AThe analysis projects that ZANO is highly likely to rally to the range highs at $17.2 over the next 3-4 months.

QWhat two indicators on the 4-hour timeframe suggested that ZANO might be overextended in the short-term?

AThe On-Balance Volume (OBV) and price showed a sizeable divergence, and the Money Flow Index (MFI) was in overbought territory, suggesting ZANO might be overextended.

QWhich price area is identified as a potential support zone for a retracement, offering a buying opportunity?

AThe $8.1-$9.2 area is identified as a high-volume trading node that is likely to act as support, offering a buying opportunity on a price dip.

QDoes a drop below $8.1 invalidate the overall bullish weekly range idea for ZANO?

ANo, a drop below $8.1 will neither invalidate the weekly range idea nor introduce a bearish structure on the 4-hour chart.

Related Reads

RWA First Stock's Major Acquisition: Why Buy a 'Traditional' Mortgage Company?

On June 10th, Figure Technology Solutions (Nasdaq: FIGR), a blockchain-native capital markets firm, announced a $717 million acquisition of Kiavi, a leading non-bank lender for residential real estate investors. The deal involves Figure acquiring Kiavi's technology and operations for approximately $538 million, while forming a joint venture with alternative asset manager Sixth Street to purchase Kiavi's existing loan portfolio. Sixth Street also provided a $3 billion forward purchase commitment. This acquisition marks a strategic shift for Figure, known as the "RWA (Real World Asset) first stock," allowing it to expand significantly into the larger market of first-lien mortgages. Kiavi specializes in non-qualified mortgage (Non-QM) loans, such as short-term fix-and-flip (RTL) and rental property (DSCR) loans—a segment traditionally underserved by major banks. The move is expected to increase Figure's first-lien loan origination to over $7 billion annually, aiming for these to constitute about 40% of its business by 2027. Both companies leverage AI for underwriting: Kiavi uses proprietary models to value renovated properties and automate document processing, dominating the fix-and-flip lending space. Figure plans to integrate these assets onto its blockchain platform, Provenance, using its new 'Adaptor' product to standardize and tokenize the loans for institutional investors on its Democratized Prime marketplace. While the integration poses challenges—including merging different asset types, interest rate sensitivity of Kiavi's loans, and post-IPO execution risks—Figure projects the deal to be accretive to earnings with a cash payback period under four years. The transaction is seen as a major step in scaling blockchain-based capital markets, moving RWA tokenization from concept validation toward large-scale operation.

Foresight News12m ago

RWA First Stock's Major Acquisition: Why Buy a 'Traditional' Mortgage Company?

Foresight News12m ago

Trend in US Stocks: A Post Triggers a 930-Point Rebound, Tonight Belongs to SpaceX

On Thursday (June 11, U.S. Eastern Time), Wall Street staged a textbook V-shaped reversal. The Dow Jones surged 929.97 points (+1.86%) to close above 50,000, while the Nasdaq and S&P 500 rose 2.54% and 1.75%, respectively. The rally occurred despite the hottest PPI report in years, with May data showing a 6.5% year-on-year surge, the highest since 2022. The market ignored the inflation data, focusing instead on reports that former President Trump called off a planned strike on Iran, hinting at a potential multi-party peace agreement draft. This sparked a sharp drop in oil prices, fueling hopes that inflation may have peaked. Sector rotations were stark: previously battered AI hardware and cyclical stocks led the gains, while defensive sectors that hit record highs the prior day were sold off. Chip stocks like Micron and Intel saw sharp rebounds. In contrast, software giant Oracle plunged nearly 10% despite beating earnings, with concerns over cloud revenue and cash flow. Adobe also fell after hours despite raising guidance, as its CFO announced departure. The rally's sustainability is questioned, driven largely by social media posts about unconfirmed geopolitical developments. Inflation risks remain, with pipeline pressures still high. Meanwhile, the market's risk appetite faces a major test with SpaceX's historic IPO. Priced at $135 per share, it aims to raise ~$75 billion with a $1.75 trillion valuation, becoming the largest U.S. IPO ever. It will join the Nasdaq 100 in 15 days, triggering massive index fund buying. However, critics cite extreme valuation (88x sales) and market liquidity concerns.

marsbit35m ago

Trend in US Stocks: A Post Triggers a 930-Point Rebound, Tonight Belongs to SpaceX

marsbit35m ago

The Trillion-Dollar Valuation Test: Are the Three Super IPOs a Tech Stock Frenzy or a Crypto Market Nightmare?

Trillion-Dollar Valuation Test: Are the Three Mega IPOs a Tech Stock Frenzy or a Crypto Market Nightmare? The capital market in 2026 is witnessing a highly anticipated wave of tech IPOs, centered on SpaceX, OpenAI, and Anthropic. Collectively valued at over $3.5 trillion, their potential listing represents one of the largest such waves in recent years. This raises concerns about market liquidity, valuation bubbles, and potential capital outflows from other assets like crypto. SpaceX's valuation narrative has shifted from rocket launches to becoming a global infrastructure play via its Starlink satellite network, which now drives most revenue. Despite ongoing losses, investors focus on its long-term growth potential. OpenAI and Anthropic represent the core productivity engines of generative AI. Their public listings would offer the first direct investment opportunity in large foundation model companies, potentially triggering a repricing within the AI sector. Market fears of a massive "capital drain" from these IPOs are likely overstated. Historical precedents like Alibaba and Saudi Aramco show that mega-listings primarily cause capital reallocation, not destruction, within the vast equities market. Systemic risk is rarely triggered by IPOs alone. For stock markets, short-term volatility and sector repricing are expected, especially for AI concept stocks. Long-term, these listings could reinforce the tech sector's importance. For crypto, direct competition for speculative capital exists, particularly affecting AI-themed tokens. However, crypto's trajectory remains more tied to its own cycles, macro liquidity, and Bitcoin ETF flows rather than a single IPO event. The real risk lies not in the listings themselves but in the sky-high growth expectations embedded in these valuations. If future revenue, profitability, or commercialization progress disappoints, significant valuation resets could follow, impacting high-growth tech stocks. Ultimately, the market's direction hinges on macroeconomic conditions and whether these companies can deliver on their ambitious promises.

链捕手51m ago

The Trillion-Dollar Valuation Test: Are the Three Super IPOs a Tech Stock Frenzy or a Crypto Market Nightmare?

链捕手51m ago

Trillion-Dollar Valuation Test: Are the Three Super IPOs a Tech Stock Frenzy or a Crypto Market Nightmare?

Title: Trillion-Dollar Valuations at Stake: Super IPOs of SpaceX, OpenAI, Anthropic – Tech Boom or Crypto Nightmare? TL;DR: A wave of mega-tech IPOs is approaching, featuring SpaceX (targeting a $1.75 trillion valuation), OpenAI (~$852B), and Anthropic (~$965B), with a combined potential valuation exceeding $3.5 trillion. This tests the market's pricing of innovation and sparks debate on liquidity impact. * **SpaceX**'s valuation is now driven more by its Starlink global communications infrastructure than its core rocket business. * **OpenAI & Anthropic** offer the first major public investment opportunities in foundational AI models, potentially repricing the entire AI sector. * Concerns about a market-wide "liquidity drain" are likely overblown; history shows large IPOs mainly cause fund reallocation, not disappearance, and rarely trigger systemic risk. * Crypto markets, especially some AI-themed tokens, may face short-term fund competition, but their long-term trajectory depends more on macro liquidity, regulation, and Bitcoin cycles. * The real risk lies not in the IPOs themselves, but in whether these companies can justify their sky-high valuations with future revenue growth and profitability. Unmet expectations could lead to significant repricing pressure. Ultimately, these IPOs represent a massive market pricing of next-gen tech infrastructure, not a prelude to a market crash. The broader market direction will be determined by macro conditions, corporate earnings, and risk appetite.

marsbit51m ago

Trillion-Dollar Valuation Test: Are the Three Super IPOs a Tech Stock Frenzy or a Crypto Market Nightmare?

marsbit51m ago

Trading

Spot
Futures

Hot Articles

What is $BITCOIN

DIGITAL GOLD ($BITCOIN): A Comprehensive Analysis Introduction to DIGITAL GOLD ($BITCOIN) DIGITAL GOLD ($BITCOIN) is a blockchain-based project operating on the Solana network, which aims to combine the characteristics of traditional precious metals with the innovation of decentralized technologies. While it shares a name with Bitcoin, often referred to as “digital gold” due to its perception as a store of value, DIGITAL GOLD is a separate token designed to create a unique ecosystem within the Web3 landscape. Its goal is to position itself as a viable alternative digital asset, although specifics regarding its applications and functionalities are still developing. What is DIGITAL GOLD ($BITCOIN)? DIGITAL GOLD ($BITCOIN) is a cryptocurrency token explicitly designed for use on the Solana blockchain. In contrast to Bitcoin, which provides a widely recognized value storage role, this token appears to focus on broader applications and characteristics. Notable aspects include: Blockchain Infrastructure: The token is built on the Solana blockchain, known for its capacity to handle high-speed and low-cost transactions. Supply Dynamics: DIGITAL GOLD has a maximum supply capped at 100 quadrillion tokens (100P $BITCOIN), although details regarding its circulating supply are currently undisclosed. Utility: While precise functionalities are not explicitly outlined, there are indications that the token could be utilized for various applications, potentially involving decentralized applications (dApps) or asset tokenization strategies. Who is the Creator of DIGITAL GOLD ($BITCOIN)? At present, the identity of the creators and development team behind DIGITAL GOLD ($BITCOIN) remains unknown. This situation is typical among many innovative projects within the blockchain space, particularly those aligning with decentralized finance and meme coin phenomena. While such anonymity may foster a community-driven culture, it intensifies concerns about governance and accountability. Who are the Investors of DIGITAL GOLD ($BITCOIN)? The available information indicates that DIGITAL GOLD ($BITCOIN) does not have any known institutional backers or prominent venture capital investments. The project seems to operate on a peer-to-peer model focused on community support and adoption rather than traditional funding routes. Its activity and liquidity are primarily situated on decentralized exchanges (DEXs), such as PumpSwap, rather than established centralized trading platforms, further highlighting its grassroots approach. How DIGITAL GOLD ($BITCOIN) Works The operational mechanics of DIGITAL GOLD ($BITCOIN) can be elaborated on based on its blockchain design and network attributes: Consensus Mechanism: By leveraging Solana’s unique proof-of-history (PoH) combined with a proof-of-stake (PoS) model, the project ensures efficient transaction validation contributing to the network's high performance. Tokenomics: While specific deflationary mechanisms have not been extensively detailed, the vast maximum token supply implies that it may cater to microtransactions or niche use cases that are still to be defined. Interoperability: There exists the potential for integration with Solana’s broader ecosystem, including various decentralized finance (DeFi) platforms. However, the details regarding specific integrations remain unspecified. Timeline of Key Events Here is a timeline that highlights significant milestones concerning DIGITAL GOLD ($BITCOIN): 2023: The initial deployment of the token occurs on the Solana blockchain, marked by its contract address. 2024: DIGITAL GOLD gains visibility as it becomes available for trading on decentralized exchanges like PumpSwap, allowing users to trade it against SOL. 2025: The project witnesses sporadic trading activity and potential interest in community-led engagements, although no noteworthy partnerships or technical advancements have been documented as of yet. Critical Analysis Strengths Scalability: The underlying Solana infrastructure supports high transaction volumes, which could enhance the utility of $BITCOIN in various transaction scenarios. Accessibility: The potential low trading price per token could attract retail investors, facilitating wider participation due to fractional ownership opportunities. Risks Lack of Transparency: The absence of publicly known backers, developers, or an audit process may yield skepticism regarding the project's sustainability and trustworthiness. Market Volatility: The trading activity is heavily reliant on speculative behavior, which can result in significant price volatility and uncertainty for investors. Conclusion DIGITAL GOLD ($BITCOIN) emerges as an intriguing yet ambiguous project within the rapidly evolving Solana ecosystem. While it attempts to leverage the “digital gold” narrative, its departure from Bitcoin's established role as a store of value underscores the need for a clearer differentiation of its intended utility and governance structure. Future acceptance and adoption will likely depend on addressing the current opacity and defining its operational and economic strategies more explicitly. Note: This report encompasses synthesised information available as of October 2023, and developments may have transpired beyond the research period.

363 Total ViewsPublished 2025.05.13Updated 2025.05.13

What is $BITCOIN

Discussions

Welcome to the HTX Community. Here, you can stay informed about the latest platform developments and gain access to professional market insights. Users' opinions on the price of BTC (BTC) are presented below.

活动图片