Years Later, Bitcoin Open Interest In BTC Still Fails To Break Past Previous Peaks

bitcoinistPublished on 2026-01-24Last updated on 2026-01-24

Abstract

Bitcoin's price remains volatile below $90,000, with attention shifting to cautious signals from Bitcoin Open Interest (OI) measured in BTC terms. According to analyst Joao Wedson, OI in BTC has not reached new all-time highs since 2022, indicating restrained leverage usage and more careful capital allocation by traders. While speculation exists, the market shows no extreme euphoria. Additionally, analyst Darkfost notes that insufficient investor profitability—currently around 71% of BTC supply in profit—hinders a sustainable bullish recovery. Historically, stability requires over 75% supply in profit. Recent price rebounds briefly reached this threshold before rejection, prompting some investors to exit positions.

Bitcoin’s price is fluctuating below the $90,000 mark as volatility increases across the entire cryptocurrency market. During the bearish price action, attention is now being shifted to the cautious signal from the Bitcoin Open Interest in BTC terms, which has remained below past all-time high in years.

Open Interest Tells A Different Story When Measured In BTC

Amid the ongoing volatile action of the crypto market, the derivatives market for Bitcoin is providing a more subdued message. This message is unfolding on the Bitcoin Open Interest (OI) in BTC terms as outlined in a recent research by Joao Wedson, a market expert and founder of the Alphractal analytics platform.

In the report shared on the X platform, the market expert highlighted that the open interest measured in BTC terms has failed to reach new all-time highs since 2022. The BTC-based perspective shows a more restricted usage of leverage over cycles, whereas dollar-denominated measures frequently climb in tandem with price.

Source: Chart from Joao Wedson on X

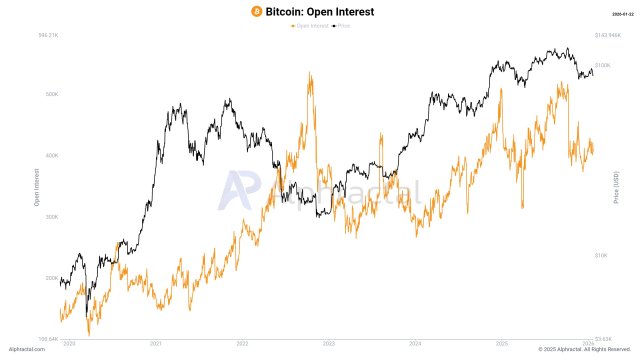
On Thursday, the metric experienced a bounce, but Wedson stated that the upward move was mainly in USD-dominated open interest. This pattern suggests that traders are becoming more cautious in the market by allocating capital more carefully as opposed to putting it all into risky positions.

According to the expert, the trend simply suggests that speculation is present in the market and it’s currently expanding. However, the chart shows that the broader market is still far from any form of extreme or irrational euphoria.

Not Enough Profit To Trigger A Bullish Recovery

BTC’s inability to produce another major rally is linked to the level of investors in profit. Darkfost stated that there are still not enough investors in profit to hope for a sustainable bullish recovery. Thus, it is crucial to understand that latent profits are not harmful to a market; it is quite the opposite.

When investors are most in profit, the situation is much more comfortable, which motivates them to hold. However, this only holds up to a certain point. Also, when the supply in profit surpasses 95% or even 100%, latest profits begin to impact the market and may trigger essential corrective phases.

The ongoing correction remained moderate with a drawdown to around 31%, but it was able to sharply reduce the percentage of supply in profit, suggesting very late entry by many investors. Currently, over 71% of BTC is in profit after dropping as low as 64%, a very concerning level that has typically been observed only when Bitcoin was entering a bear market.

However, in Darkfost’s view, the market must reclaim above 75% supply in profit to regain a more stable structure. As long as it stays above this level, the supply in profit has historically been associated with positive periods, as shown in the chart.

With the recent price rebound, the supply in profit saw a brief climb back to 75% before getting rejected. Meanwhile, many BTC investors possibly used this opportunity to exit at break-even or to cut their losses.

BTC trading at $89,512 on the 1D chart | Source: BTCUSDT on Tradingview.com

Related Questions

QWhat does the Bitcoin Open Interest measured in BTC terms indicate about market leverage usage?

AThe Bitcoin Open Interest measured in BTC terms indicates a more restricted usage of leverage over cycles, failing to reach new all-time highs since 2022, which suggests traders are being more cautious with capital allocation.

QAccording to Joao Wedson, what does the recent bounce in the open interest metric primarily consist of?

AAccording to Joao Wedson, the recent bounce in the open interest metric was mainly in USD-denominated open interest, not in BTC terms.

QWhat level of supply in profit does Darkfost suggest is needed for the Bitcoin market to regain a stable structure?

ADarkfost suggests the market must reclaim above 75% supply in profit to regain a more stable structure, as staying above this level has historically been associated with positive periods.

QWhat was the percentage of BTC supply in profit at its lowest point during the recent correction, and why is this level concerning?

AThe percentage of BTC supply in profit dropped as low as 64% during the recent correction, which is concerning because this level has typically been observed only when Bitcoin was entering a bear market.

QWhat is the current price of Bitcoin mentioned in the article, and on which chart timeframe is it shown?

AThe current price of Bitcoin mentioned is $89,512, and it is shown on the 1D (daily) chart on Tradingview.com.

Related Reads

Saylor's Purchase of 1550 Bitcoin Is a Bad Trade

**Title: Saylor's Purchase of 1,550 Bitcoins Was a Bad Trade** The article critically analyzes Strategy's recent move of selling 32 bitcoins followed by a much larger purchase of 1,550 bitcoins. While appearing bullish, the author argues this trade is detrimental to MSTR shareholders. The core argument revolves around the concept of "breakeven modified Net Asset Value (mNAV)," a key metric for Strategy. To increase Bitcoin per share (BPS) for MSTR holders, Strategy must issue new shares at a premium high enough that the funds raised can buy more bitcoin than the bitcoin backing each existing share. Currently, this breakeven mNAV is estimated at 1.30. The recent trade failed on two counts: 1. The shares for the $181 million raise were issued at an mNAV *below* the 1.30 breakeven point. Selling "cheap" shares to buy bitcoin actually *reduces* BPS. 2. Only $101.3 million of the raised funds were used to buy bitcoin; the rest went to boost the company's dollar reserves. The breakeven mNAV calculation assumes *100%* of proceeds are used for bitcoin purchases. Diverting funds, even if mNAV were high, dilutes BPS. The result is an estimated 0.19% decrease in Bitcoin per share for MSTR holders. In exchange, Strategy merely extended its operational runway for its dollar reserves from ~6.3 months to 7 months. The author interprets this as Strategy prioritizing the survival and development of its STRC business over its stated core goal of increasing MSTR's BPS. This constitutes a gamble: if sacrificing MSTR value leads to improved market sentiment and a recovery in STRC's price (and thus mNAV), the whole system could work. If not, Strategy may be forced into a cycle of further diluting MSTR to stay afloat, potentially leading to deferred STRC dividends or corporate decline. The article concludes with a hope for price recovery for Bitcoin, MSTR, and STRC.

Foresight News14m ago

Saylor's Purchase of 1550 Bitcoin Is a Bad Trade

Foresight News14m ago

The AI Bear Market Lasting Two Days Is Over; Why Did Funds Buy Back Storage Stocks First?

After a severe two-day selloff in early June that erased over $1 trillion from U.S. chip stock market value, capital is flowing back first to the memory sector. The correction was not driven by a collapse in AI demand but rather a market reassessment of high expectations. Stocks like Broadcom faced selling pressure despite strong AI revenue guidance, signaling a shift in focus from who has an "AI story" to who can most rapidly translate AI demand into verifiable profits and earnings per share (EPS). Memory companies, such as Micron and SK Hynix, are leading the recovery because their EPS growth is more immediately verifiable. The AI server boom directly increases demand for high-bandwidth memory (HBM) and high-capacity server DRAM, tightening supply and driving up contract prices for conventional DRAM and NAND Flash. This price increase, coupled with a shift to higher-margin products, flows directly into near-term revenue and profitability, as evidenced in recent earnings reports. In contrast, other AI semiconductor segments like GPUs, ASICs, and optical modules, while central to the long-term AI infrastructure story, face longer and less certain paths to EPS validation. Their growth depends more on future product cycles, customer adoption timelines, and capital expenditure plans. The rebound in memory stocks highlights a market preference for assets with shorter, more transparent EPS conversion cycles following the recent de-risking phase. However, this does not negate the potential of other AI hardware segments should they provide clearer near-term order visibility. The episode has raised the validation bar for all AI-related investments.

marsbit14m ago

The AI Bear Market Lasting Two Days Is Over; Why Did Funds Buy Back Storage Stocks First?

marsbit14m ago

Monera Digital|Crypto Market May Report: Four Major Reasons Behind the Accelerated Decline

Monera Digital Crypto Market May Report: Four Key Reasons Behind the Accelerated Decline The crypto market experienced a significant downturn in May, driven by an internal liquidity crisis rather than external macro factors. Bitcoin fell from around $82,850 to $73,674, even as traditional markets rallied in the final week, highlighting a clear "liquidity transmission failure" specific to crypto. Four primary internal factors caused the accelerated sell-off: 1. **Major ETF Outflows:** U.S. spot Bitcoin ETFs saw a net outflow of $2.425 billion for the month, the third-largest monthly withdrawal since their launch. Ethereum ETFs also reversed to net outflows. This turned a key pillar of the bull run into a source of selling pressure. 2. **Holder Capitulation:** On-chain data showed textbook "surrender" patterns. The Short-Term Holder MVRV ratio fell below 1.0, indicating this cohort is now in aggregate loss. The Net Unrealized Profit/Loss (NUPL) metric also deteriorated significantly. 3. **Contagious Negative Sentiment:** The Coinbase Premium Index, which shows U.S. institutional buying/selling pressure, turned deeply negative for most of the month. This confirmed the ETF outflows and reflected a strategic shift away from crypto toward assets like U.S. Treasuries. 4. **Leverage Unwinding and Psychological Breaks:** Despite the downturn, futures open interest initially grew, signaling leveraged positioning. This culminated in a sharp deleveraging event with $307 million in long liquidations. Furthermore, the price broke below the critical $75K-$76K support zone, which is both a key gamma option level and the approximate average cost basis for major public companies holding Bitcoin, turning them from potential buyers into potential sellers. The report concludes that the market's pricing power has shifted from macro narratives to internal liquidation. While Bitcoin's 200-week moving average quantile has entered a historical "value zone" at 10.2%, this indicates a deep bear market reset is underway, not an immediate reversal. A sustainable recovery will require both a genuine improvement in the macro liquidity environment and clear signs of renewed on-chain demand, such as ETF inflows resuming and the Coinbase Premium turning positive. Until then, discipline and capital preservation are paramount.

marsbit25m ago

Monera Digital|Crypto Market May Report: Four Major Reasons Behind the Accelerated Decline

marsbit25m ago

Trading

Spot
Futures

Hot Articles

What is $BITCOIN

DIGITAL GOLD ($BITCOIN): A Comprehensive Analysis Introduction to DIGITAL GOLD ($BITCOIN) DIGITAL GOLD ($BITCOIN) is a blockchain-based project operating on the Solana network, which aims to combine the characteristics of traditional precious metals with the innovation of decentralized technologies. While it shares a name with Bitcoin, often referred to as “digital gold” due to its perception as a store of value, DIGITAL GOLD is a separate token designed to create a unique ecosystem within the Web3 landscape. Its goal is to position itself as a viable alternative digital asset, although specifics regarding its applications and functionalities are still developing. What is DIGITAL GOLD ($BITCOIN)? DIGITAL GOLD ($BITCOIN) is a cryptocurrency token explicitly designed for use on the Solana blockchain. In contrast to Bitcoin, which provides a widely recognized value storage role, this token appears to focus on broader applications and characteristics. Notable aspects include: Blockchain Infrastructure: The token is built on the Solana blockchain, known for its capacity to handle high-speed and low-cost transactions. Supply Dynamics: DIGITAL GOLD has a maximum supply capped at 100 quadrillion tokens (100P $BITCOIN), although details regarding its circulating supply are currently undisclosed. Utility: While precise functionalities are not explicitly outlined, there are indications that the token could be utilized for various applications, potentially involving decentralized applications (dApps) or asset tokenization strategies. Who is the Creator of DIGITAL GOLD ($BITCOIN)? At present, the identity of the creators and development team behind DIGITAL GOLD ($BITCOIN) remains unknown. This situation is typical among many innovative projects within the blockchain space, particularly those aligning with decentralized finance and meme coin phenomena. While such anonymity may foster a community-driven culture, it intensifies concerns about governance and accountability. Who are the Investors of DIGITAL GOLD ($BITCOIN)? The available information indicates that DIGITAL GOLD ($BITCOIN) does not have any known institutional backers or prominent venture capital investments. The project seems to operate on a peer-to-peer model focused on community support and adoption rather than traditional funding routes. Its activity and liquidity are primarily situated on decentralized exchanges (DEXs), such as PumpSwap, rather than established centralized trading platforms, further highlighting its grassroots approach. How DIGITAL GOLD ($BITCOIN) Works The operational mechanics of DIGITAL GOLD ($BITCOIN) can be elaborated on based on its blockchain design and network attributes: Consensus Mechanism: By leveraging Solana’s unique proof-of-history (PoH) combined with a proof-of-stake (PoS) model, the project ensures efficient transaction validation contributing to the network's high performance. Tokenomics: While specific deflationary mechanisms have not been extensively detailed, the vast maximum token supply implies that it may cater to microtransactions or niche use cases that are still to be defined. Interoperability: There exists the potential for integration with Solana’s broader ecosystem, including various decentralized finance (DeFi) platforms. However, the details regarding specific integrations remain unspecified. Timeline of Key Events Here is a timeline that highlights significant milestones concerning DIGITAL GOLD ($BITCOIN): 2023: The initial deployment of the token occurs on the Solana blockchain, marked by its contract address. 2024: DIGITAL GOLD gains visibility as it becomes available for trading on decentralized exchanges like PumpSwap, allowing users to trade it against SOL. 2025: The project witnesses sporadic trading activity and potential interest in community-led engagements, although no noteworthy partnerships or technical advancements have been documented as of yet. Critical Analysis Strengths Scalability: The underlying Solana infrastructure supports high transaction volumes, which could enhance the utility of $BITCOIN in various transaction scenarios. Accessibility: The potential low trading price per token could attract retail investors, facilitating wider participation due to fractional ownership opportunities. Risks Lack of Transparency: The absence of publicly known backers, developers, or an audit process may yield skepticism regarding the project's sustainability and trustworthiness. Market Volatility: The trading activity is heavily reliant on speculative behavior, which can result in significant price volatility and uncertainty for investors. Conclusion DIGITAL GOLD ($BITCOIN) emerges as an intriguing yet ambiguous project within the rapidly evolving Solana ecosystem. While it attempts to leverage the “digital gold” narrative, its departure from Bitcoin's established role as a store of value underscores the need for a clearer differentiation of its intended utility and governance structure. Future acceptance and adoption will likely depend on addressing the current opacity and defining its operational and economic strategies more explicitly. Note: This report encompasses synthesised information available as of October 2023, and developments may have transpired beyond the research period.

363 Total ViewsPublished 2025.05.13Updated 2025.05.13

What is $BITCOIN

Discussions

Welcome to the HTX Community. Here, you can stay informed about the latest platform developments and gain access to professional market insights. Users' opinions on the price of BTC (BTC) are presented below.

活动图片