US Stocks in the 'Largest Bubble in History' Zone? Four Major Valuation Indicators Flash Red Simultaneously

marsbitPublished on 2026-04-16Last updated on 2026-04-16

Abstract

U.S. stock market valuations are flashing multiple warning signs, with key indicators reaching historic highs. The S&P 500's CAPE ratio has hit 39, a level only surpassed during the 2000 dot-com bubble. The "Buffett Indicator" (market cap to GDP) has soared past 230%, an all-time high. Furthermore, market concentration is extreme, with the top 10 stocks comprising over 35% of the index's weight and the "Magnificent 7" alone accounting for over 30%. Wall Street is deeply divided on the implications. The bearish camp, including figures like Jeremy Grantham, warns this is an AI-driven bubble, pointing to massive losses at companies like OpenAI and classic late-cycle signals. They caution that high valuations historically lead to poor future returns and significant corrections. The bullish camp argues that strong earnings justify the premiums. Analysts project 17.6% profit growth for the S&P 500 in 2026. Firms like BlackRock contend the rally is earnings-driven, and historical patterns suggest bull markets can continue. Geopolitical risks, such as the Iran conflict pushing oil above $100, and a hesitant Fed add further uncertainty. The market is at a crossroads: whether AI-driven profits will validate high valuations or if a major correction is imminent.

Author: Claude, Deep Tide TechFlow

Deep Tide Guide: The S&P 500's CAPE ratio hit 39, the highest level since the 2000 dot-com bubble; the "Buffett Indicator" broke through 230% to set a new historical record; the top ten constituents account for over 35% of the index weight, with concentration reaching a modern market peak. Multiple valuation indicators are simultaneously signaling overheating, but Wall Street's judgment on this shows a serious divergence: one side believes AI profit growth supports the premium, while the other believes this is precisely the classic feature of a bubble top.

The S&P 500 is in a rare state: almost all mainstream valuation indicators are simultaneously signaling a warning.

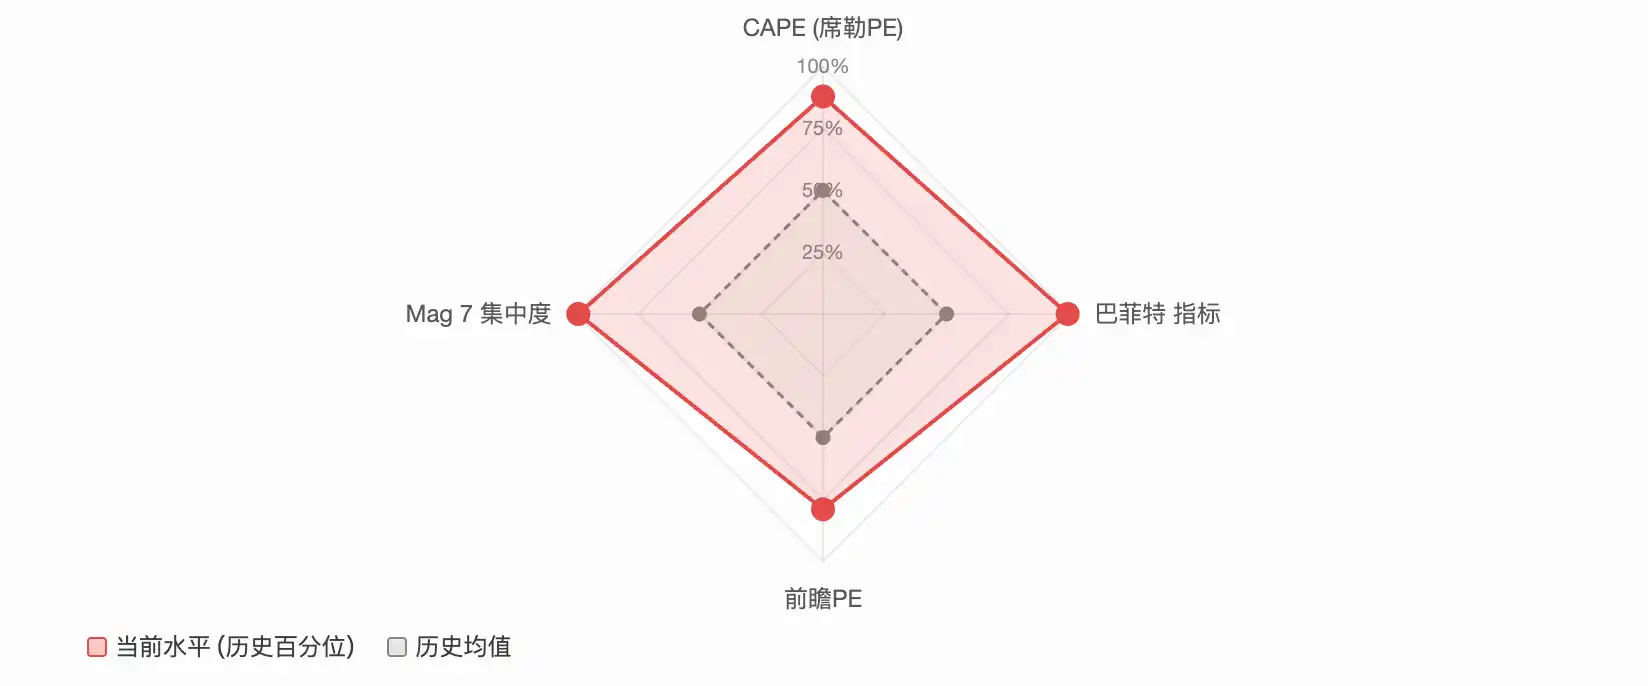
CAPE (Shiller P/E) is approaching 40, the highest level since the internet bubble; the "Buffett Indicator" (Market Cap/GDP ratio) broke through 230%, refreshing the historical record; the top ten constituents account for over 35% of the index weight, with market concentration in an unprecedented range in modern financial history. A post on the Reddit community r/stocks characterized the current market as the "most overextended state in history," sparking over 2,100 upvotes and 640 comments. The discussion focused on a core question:

Is this a signal of a bull market top, or the beginning of an AI-driven "new paradigm"?

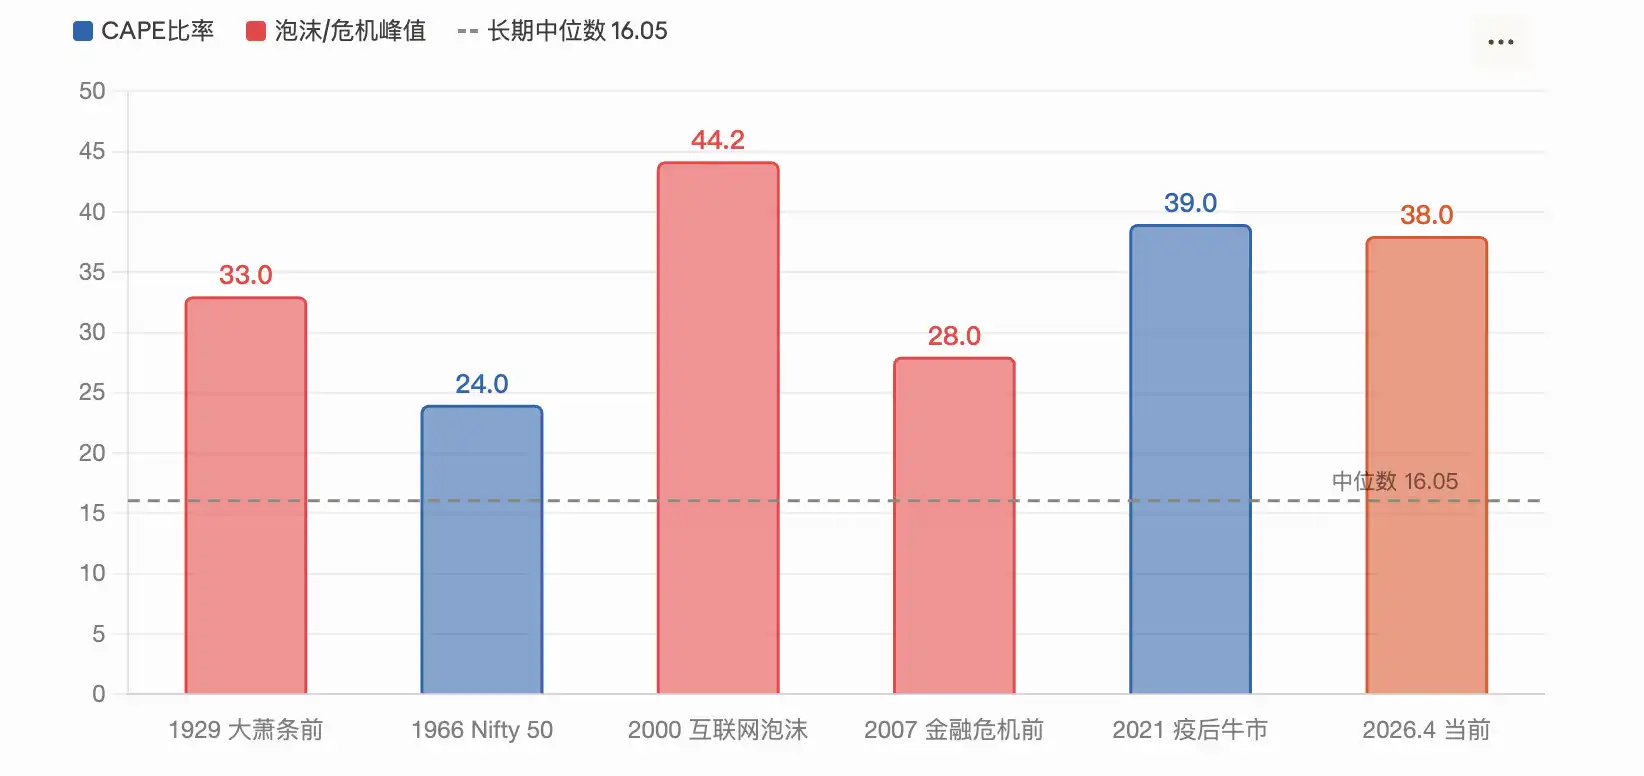
CAPE Ratio Touches 39, Second Only to the 2000 Internet Bubble Peak

The Shiller P/E ratio (CAPE) is a valuation metric developed by Nobel laureate economist Robert Shiller. It calculates the price-to-earnings ratio using the average inflation-adjusted earnings over the past 10 years, aiming to eliminate the interference of short-term economic cycles.

According to a Motley Fool report in March, the S&P 500's CAPE ratio touched 39.2 in February. According to GuruFocus data on April 1st, this indicator was 38.66. Both readings are at the second highest level in history, second only to the 44.2 during the peak of the 2000 internet bubble. The long-term median is only 16.05.

Historically, CAPE has reached similar highs twice: the late 1920s (followed by the Great Depression) and 2000 (after the internet bubble burst, the S&P 500 plummeted 49% in two and a half years). According to Shiller's research model, the current CAPE level corresponds to a future annualized return rate of only about 2%.

Motley Fool's analysis pointed out that Shiller himself expressed concern when CAPE exceeded 25, noting that since 1881, there have only been three periods that exceeded this level: around 1929, 1999, and 2007.

However, an IndexBox report also acknowledged that a high CAPE does not automatically mean a crash is imminent, as the market has risen over 40% since this indicator broke through 30 at the end of 2023.

"Buffett Indicator" Breaks 230%, Setting a Half-Century Record High

Buffett once called the Market Cap/GDP ratio the "best single measure of where valuations stand" in a 2001 Fortune magazine interview. He suggested at the time that 75%-90% was a reasonable range, and exceeding 120% meant the market was overvalued.

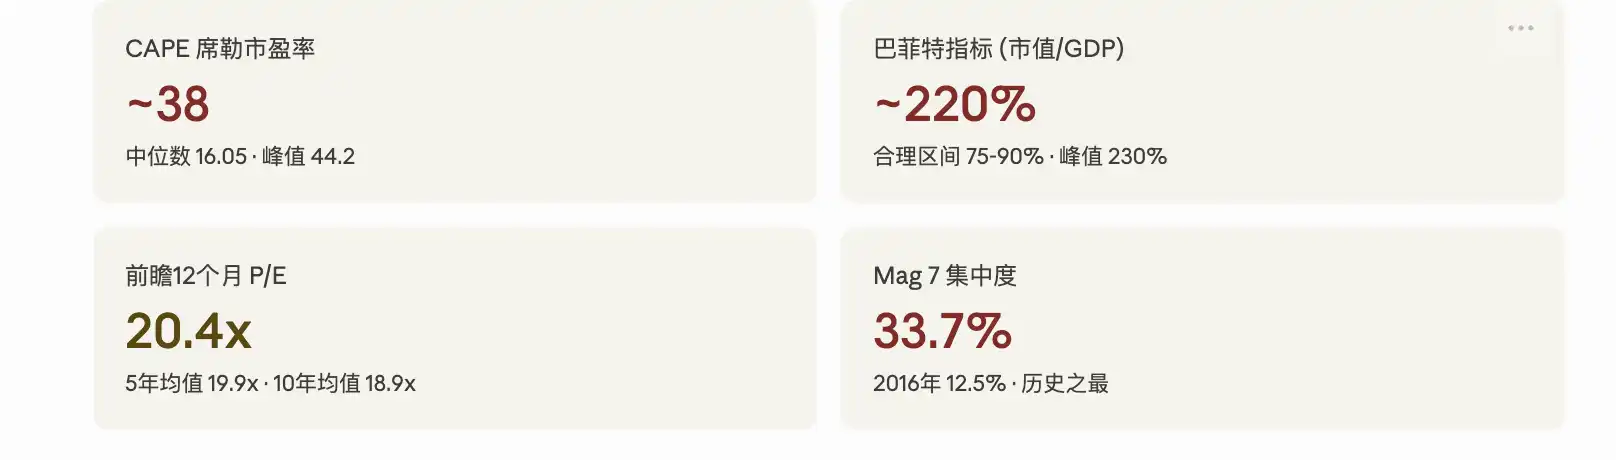
According to Advisor Perspectives data, by early 2026, this indicator once touched 230.3%, the highest level on record, about 2.09 standard deviations above the trend line, defined as "significantly overvalued." The latest reading in March fell back to 227.5%, still the second highest in history. GuruFocus推算, based on this ratio, the future annualized return of US stocks over the next 8 years is approximately -0.3%. (Note: 推算 translates to推算/calculate/project. The original Chinese used this term before the percentage.)

According to GuruFocus data on April 14th, the ratio was 219.5%. Critics point out that this indicator does not fully consider two structural changes: first, the profit margins of US companies have significantly increased compared to the historical median, and second, large US companies are generating more and more revenue from overseas (which boosts market cap but is not reflected in domestic GDP). But supporters believe that even after detrending, the current reading is still in an extreme historical range.

Market Concentration at a Modern History Peak, Mag 7 Accounts for Over 30%

Valuation is only one dimension of the problem. The structural risks of the market are equally disturbing.

According to AhaSignals data on April 13th, the top ten constituents of the S&P 500 account for 35.59% of the index weight, the top five account for 25.97%, and the "Magnificent 7" (Mag 7) account for 30.44%. The comprehensive concentration risk index (ACRI) compiled by the agency reads 81/100, at a "critical" level. According to Motley Fool data from April, the weight of the Mag 7 in the S&P 500 has risen from 12.5% in 2016 to the current 33.7%.

A CNBC report in December 2025 quoted a warning from Nick Ryder, CIO of Kathmere Capital: investors are still overly concentrated in the Mag 7, and he recommended充分分散配置 beyond US large-cap growth stocks. (Note: 充分分散配置 translates to fully diversify allocations/portfolio.) Ed Yardeni, president of Yardeni Research, suggested around the same time that investors underweight the Mag 7 and overweight the "other 493" (Impressive 493).

The actual risk brought by concentration is: when a few stocks dominate the index's movement, their decline can drag down the overall market with disproportionate force. The first quarter of 2026初步验证了这一点 (preliminarily verified this). According to a 24/7 Wall St report, Microsoft, Amazon, and Nvidia fell about 20%, 9%, and 6% year-to-date respectively, dragging the market-cap-weighted S&P 500 down nearly 4%, while the equal-weight S&P 500 (RSP) closed slightly positive during the same period.

Two Camps in Confrontation: "History Repeats" or "This Time is Different"

Faced with this data, Wall Street's judgment shows sharp divergence.

The core argument of the bearish camp is mean reversion of valuations. GMO co-founder Jeremy Grantham explicitly characterized the current market as a large AI-driven bubble in his latest research. He pointed out that the actual revenue from current AI investment is far less than the scale of capital expenditure, with OpenAI predicting its own 2026 operating loss will reach $17 billion and expand to $35 billion in 2027. GMO believes that the classic signals of a bubble top (speculative stock崩溃/collapse, significant outperformance by quality stocks) have not yet fully appeared, but this only means the bubble has not yet peaked, not that it doesn't exist.

IO Fund's cycle analysis also tends to be cautious. The institution's report pointed out that 2026 is simultaneously at the intersection window of the Gann 60-year major cycle and the 4-year presidential cycle, and each stock in the Mag 7 peaked between July 2025 and February 2026, with core components silently falling back while the index made its final new highs, which is a "classic warning sign of the late bull market."

The bullish camp emphasizes profit fundamentals. According to FactSet data from April, the S&P 500's forward 12-month P/E ratio is 20.4 times, although higher than the 10-year average of 18.9 times, it has fallen back from 22 times at the end of 2025. Analysts predict the S&P 500's full-year 2026 profit growth to be 17.6%. If this expectation is realized, the high valuation can be digested to some extent.

The judgment of Jurrien Timmer, Director of Global Macro at Fidelity, is relatively moderate: since the Iran conflict, the maximum drawdown of the S&P 500 has been less than 10%, a decline that historically occurs on average once every year. Profit expectations are still growing at an annualized rate of 17%, and have not yet been substantially affected by geopolitical headlines.

Morgan Stanley's investment management team also pointed out in its 2026 outlook that most bull markets last 5 to 7 years, and bull markets entering their fourth year have historically recorded positive returns. The bank's non-US equity allocation ratio has risen to a historical high.

BlackRock stated that the gains in tech stocks in 2025 were mainly driven by profit growth rather than valuation expansion, and the current valuation is reasonable based on growth expectations.

Overlaid with Geopolitical Shock: Iran War and Stagflation Risks

Beyond the valuation debate, the macro environment adds additional uncertainty.

The Iran conflict pushed oil prices above $100 per barrel, and the S&P 500 once fell below its 200-day moving average in March. According to a FinancialContent report, the Fed's March meeting maintained a "hawkish hold," and the updated dot plot only anticipated one more rate cut for the remainder of 2026. UBS, in a report on March 17, characterized the recent volatility as a "necessary reset of high valuations" rather than the beginning of a bear market, maintaining a year-end target of 7700 points.

Goldman Sachs has raised the probability of a recession in the next 12 months to about 30%. This resonates with the warning from valuation indicators: if an economic recession coincides with high valuations, the S&P 500's historical average peak-to-trough decline is 32%. But if profits continue to grow (FactSet consensus expectation is 17%), significant corrections have historically often been limited in幅度/magnitude and recovered from quickly.

For investors, the contradiction at the signal level is already very clear. Long-term valuation indicators are almost all flashing red, but short-to-medium-term profit data remains strong. The market has reached the crossroads of "valuations say no" and "profits say yes." The outcome depends on whether AI capital expenditure can translate into sustained profits, and whether geopolitical shocks ultimately translate into recession.

Related Questions

QWhat are the four major valuation indicators suggesting about the current US stock market?

AThe four major valuation indicators are: 1) The CAPE ratio (Shiller P/E) is near 40, its highest level since the dot-com bubble. 2) The 'Buffett Indicator' (market cap to GDP ratio) has exceeded 230%, a record high. 3) The top 10 stocks in the S&P 500 account for over 35% of the index's weight, indicating extreme concentration. 4) The ACRI (Aggregate Concentration Risk Index) reading is 81/100, signaling a 'critical' level. Together, they suggest the market is in a historically overvalued and overextended state.

QAccording to the article, what is the historical significance of a high CAPE ratio, and what future returns does the current level suggest?

AHistorically, a CAPE ratio at similarly high levels has occurred twice: in the late 1920s (followed by the Great Depression) and in 2000 (followed by a 49% crash in the S&P 500 over two and a half years). According to Robert Shiller's research model, the current CAPE level corresponds to a future annualized return of only about 2%.

QWhat is the core argument of the 'bearish' camp regarding the current market conditions?

AThe core argument of the bearish camp is the principle of mean reversion in valuations. They argue that the market is in an AI-driven bubble, citing that actual AI investment revenues are far below capital expenditure levels. They point to classic signals of a market top, such as speculative stocks collapsing and high-quality stocks outperforming, and warn that the convergence of major market cycles suggests a high risk of a significant correction.

QWhat is the main counter-argument presented by the 'bullish' camp to justify current high valuations?

AThe bullish camp emphasizes strong盈利基本面 (profit fundamentals). They argue that high valuations are supported by robust expected earnings growth, with analysts forecasting 17.6% profit growth for the S&P 500 in 2026. They contend that if these expectations are met, the high valuations can be digested, and that much of the recent tech stock gains have been driven by earnings growth rather than mere valuation expansion.

QWhat two major macro risks, beyond valuations, does the article identify that could impact the market?

AThe two major macro risks identified are: 1) Geopolitical shock from the Iran conflict, which has pushed oil prices above $100 per barrel and added market volatility. 2) Stagflation risk, where the combination of high inflation (potentially keeping the Fed higher for longer) and a potential economic recession (with Goldman Sachs raising the probability of recession to 30%) could severely impact an overvalued market.

Related Reads

Super-Rich Hoarded Record Cash in February, Stock Market Hit New Highs Four Months Later: Who's Getting Fooled?

In February, the total assets in US money market funds reached a record high of approximately $8.25 trillion, a trend highlighted by high-net-worth individuals increasing their cash holdings. Notably, Warren Buffett's Berkshire Hathaway amassed a $381.7 billion cash pile ahead of his 2025 retirement, while other prominent figures like Peter Thiel sold tech stocks, fueling narratives of wealthy investors seeking safety. However, by June, the trend reversed. Money market fund assets fell to around $7.87 trillion, indicating a flow of capital back into equities. Concurrently, the S&P 500 and Nasdaq reached all-time highs, with the S&P 500 surpassing 7600 points. This market surge occurred despite the earlier defensive moves, highlighting a potential opportunity cost for those who retreated to cash. Analysis shows that since early 2022, the S&P 500's total return significantly outpaced that of prime money market funds. The capital shifted from equities appears to have been partly reallocated into alternative investments like real estate, art, and private credit, especially among ultra-high-net-worth individuals. Meanwhile, major investment banks like Goldman Sachs and Morgan Stanley have raised their year-end targets for the S&P 500, citing AI-driven earnings growth, while also cautioning about risks including market concentration and economic fragility beneath the surface rally.

marsbit14m ago

Super-Rich Hoarded Record Cash in February, Stock Market Hit New Highs Four Months Later: Who's Getting Fooled?

marsbit14m ago

Robot Vacuums Have Been Competing for 20 Years, So Why Are 90% of Chinese Households Still Hesitant?

The article explores why over 90% of Chinese households are still hesitant to adopt robotic vacuum cleaners despite two decades of industry development, identifying a core "trust gap" as the primary barrier. The central issue is not a lack of need, but user concerns about reliability in dynamic, real-world home environments. Common anxieties include the robot dragging pet waste, colliding with transparent objects, tangling in cords, scattering cat litter, getting stuck on thresholds, missing corners under furniture, and requiring high-maintenance bases that develop odors. The industry's past focus on competing on technical specs (suction power, mopping functions) has not adequately addressed these practical usability and trust problems. The piece then examines DJI's entry into the market with its ROMO 2 model as a potential new approach. Leveraging its expertise in spatial perception and obstacle avoidance from drones, DJI's solution emphasizes "less intervention" through three key principles: less manual re-cleaning, less user rescue missions, and less maintenance. Specific ROMO 2 features highlighted include advanced obstacle recognition (handling transparent objects and small items), adaptive leg mechanisms for climbing thresholds (up to 8.5cm), an extendable arm for reaching under furniture, AI for identifying and appropriately handling different mess types (e.g., avoiding scattering dry debris), and a self-cleaning base designed to minimize user upkeep. The article argues the next phase of competition should shift from a "parameter race" to a "trust race." It draws a parallel to the iPhone's simplification of the smartphone, suggesting that focusing on a reliable, low-hassle user experience—where people feel confident leaving their floors to the machine—is what's needed to finally convince the vast majority of观望ing families. The ultimate test for products like the ROMO 2 will be long-term user adoption, retention, and口碑, not just technical specifications.

marsbit14m ago

Robot Vacuums Have Been Competing for 20 Years, So Why Are 90% of Chinese Households Still Hesitant?

marsbit14m ago

The Unclear American Economy: Resilient or Cooling Down?

**U.S. Economic Outlook: Resilient or Cooling Down?** This analysis examines whether the U.S. economy is heading towards a recession. While still growing, the economy shows significant signs of strain. Key data points include Q1 2026 GDP growth of 1.6% and Q1 PCE inflation at 4.5% (annualized), more than double the Fed's target. The labor market remains resilient but is softening, with unemployment at 4.3%. Critical recession indicators present a mixed picture: the yield curve has normalized after a prolonged inversion (historically a late-cycle signal), and the Conference Board's Leading Economic Index has been declining. Current recession probability for 2026 is estimated at 19%, but rises to 41% for 2027, indicating heightened delayed risks. Major pressures are building: a wall of corporate debt refinancing at higher rates, depleted consumer savings, a contracting housing sector, and an energy price shock. The economy exhibits stagflationary characteristics—high inflation alongside slowing growth—which constrains the Federal Reserve's policy options. Historical patterns show recessions are often preceded by Fed tightening and yield curve inversions. If a recession occurs, it is expected to be mild, similar to 2001 rather than 2008. For investors, a defensive portfolio shift toward staples, healthcare, and short-term high-quality bonds may be prudent, while maintaining a long-term, diversified perspective. Key developments to monitor include upcoming GDP, employment, and inflation data, as well as policy signals from the new Fed Chair.

marsbit22m ago

The Unclear American Economy: Resilient or Cooling Down?

marsbit22m ago

The Most Advanced Large Models Are Now Subject to Export Controls Like Enriched Uranium

In an unprecedented move mirroring the control of enriched uranium, the US Commerce Department has imposed an export control ban on Anthropic's advanced AI models, Fable 5 and Mythos 5, forcing their global shutdown. This marks the first time a purely digital entity—a set of neural network weights—has been subjected to such hardware-like strategic export restrictions, based not on physical scarcity but on its concentrated "capability density." The article draws a direct parallel to the historical control of nuclear technology, arguing that just as uranium ore becomes a controlled substance only when enriched to a critical threshold, AI capabilities become subject to regulation when compressed into a single, potent, and easily accessible interface. This "enriched AI" is seen as crossing a threshold where its aggregated power poses a potential threat. The author predicts three major consequences over the next decade. First, capability auditing will become institutionalized, with governments setting compliance checklists and thresholds for model power, triggering automatic export controls. Second, jurisdictional boundaries will blur as US export controls extend their reach globally, governing any user of American AI services regardless of location, forcing non-US entities to reconsider their AI supply chain dependencies. Third, a technological bifurcation will occur, splitting the AI landscape into a restricted, high-risk track of advanced US proprietary models and a more reliable track of open-source or locally developed alternatives, where guaranteed access may outweigh raw performance. The core crisis exposed is the lack of a legal property rights framework for AI "intelligence." While companies invest heavily in integrating these models into their production systems, legally they only purchase a service that can be revoked at any time, leaving them with no recourse for their sunk investments. The conclusion warns of a permanently fractured digital world where the most capable models may not be the most usable, and clear, unassailable ownership of technology will become paramount.

marsbit34m ago

The Most Advanced Large Models Are Now Subject to Export Controls Like Enriched Uranium

marsbit34m ago

Trading

Spot
Futures

Hot Articles

Discussions

Welcome to the HTX Community. Here, you can stay informed about the latest platform developments and gain access to professional market insights. Users' opinions on the price of S (S) are presented below.

活动图片