Solana is trading at $73.59 on July 31, down 1.14%, positioned at the apex of a triangle between a descending trendline from the May peak and an ascending trendline from the June low, as August opens with two institutional catalysts not present a week ago.
$SOL Is at the Triangle's Apex, with the 0.382 Fibonacci as the Last Floor
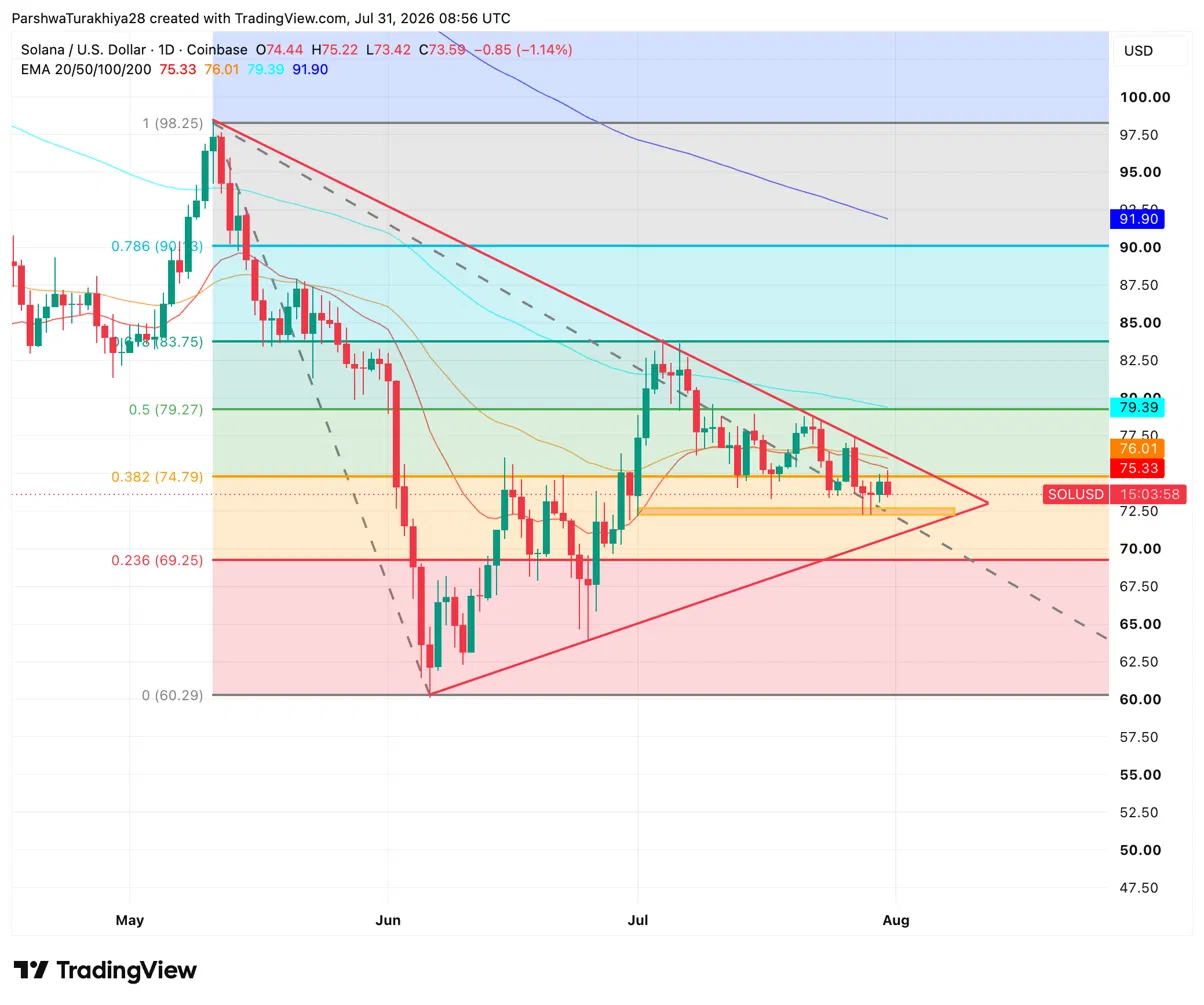
The daily chart shows how $SOL is compressing inside a triangle formed between the May peak around $98 and the June low at $60.29. Both trendlines converge at the current price around $73–$74, and a directional resolution is long overdue. The 20-day EMA at $75.33 and the 50-day at $76.01 are just above, adding to a resistance cluster already provided by the upper trendline.
Related: Ethereum Price Forecast for August 2026: Will ETH Reach $1,930, or Is the Third Rejection the Final Warning?
The 0.382 Fibonacci level at $74.79 sits slightly above the current price and has been the level rejecting all recovery attempts until July. The 0.5 Fibonacci level at $79.27 and the 100-day EMA at $79.39 converge in the same zone, making $79 a key breakout target. Below, the 0.236 Fibonacci level at $69.25 and the June low at $60.29 define the downside if the triangle breaks lower.
What Are the Key Support and Resistance Levels for $SOL in August?
Resistance Levels
- $74.79 — 0.382 Fibonacci, rejected all recovery attempts in July
- $75.33 — 20-day EMA
- $76.01 — 50-day EMA
- $79.27 — 0.5 Fibonacci and 100-day EMA cluster, key breakout target
Support Levels
- $73.42 — today's session low and triangle lower trendline
- $69.25 — 0.236 Fibonacci
- $60.29 — June low and Fibonacci zero point
Has August Historically Been Strong for $SOL?
Unlike most major cryptocurrencies, Solana's August track record is unusually split. The median is essentially flat at -0.001%, but the average is +61.1%, the highest among all months on $SOL's calendar.
This figure is entirely contained within the +213.6% in 2020 and +199.8% in 2021 — two unusual outliers unmatched in any other year. Remove them, and August looks more like Bitcoin's worst month than its best.
Fairly, August is not reliably strong for $SOL, but it is the month where the right macro conditions have historically delivered the token's largest monthly gains ever.
Weekly Forecast for August 2026
| Period | Price Range | Outlook |
| August 1-8 | $70 — $82 | Triangle resolution, final CLARITY Act window, MSOL inflow trajectory |
| August 9-20 | $68 — $85 | Post-recess direction, KSNET PoC development timeline |
| August 21-31 | $67 — $90 | September FOMC pricing builds, seasonal surge if momentum holds |
Morgan Stanley's MSOL Posts Largest Single-Day $SOL ETF Inflow Since Mid-May
Morgan Stanley launched its spot Solana ETF on July 28, and by its second trading day on July 29, it had already achieved the largest single-day inflow across all US $SOL ETF products since early May. MSOL gathered $19.06 million that session, while all other $SOL ETF products recorded zero flows, meaning all category flow for the day came from a single fund that had traded for less than 48 hours.
The fund sets a management fee of 0.14% and passes 95% of staking rewards directly to shareholders, providing institutional investors with yield on top of price exposure through Morgan Stanley's existing distribution network. The next day, July 30, inflows continued at $403.89k, maintaining positive momentum into August.
Related: Shiba Inu Price Forecast for August 2026: Can SHIB Hold Its 40% Gain Unlike Emirates and Sustain Its Search Traffic?
Cumulative $SOL ETF inflows now stand at $1.15 billion, with total net assets at $878.33 million, with MSOL already accounting for $19.46 million of that aggregate sum despite being less than a week old.
KSNET Signs MOU to Introduce Solana Payments for 330,000 Korean Merchants
KSNET has operated Korea's payment infrastructure for 26 years. Its network covers 330,000 merchants and processes approximately $4 billion in monthly transactions — the same tier as the country's major card networks, not niche fintech companies.
On July 30, a Memorandum of Understanding (MOU) was signed with the Solana Foundation to integrate Solana Pay along two tracks.
What the Partnership Actually Covers
| Track | What It Does |
| Track 1: Domestic Payments | Adapting Solana Pay for Korean merchants — digital settlement rails connected to the Korean won network, compliant with local AML requirements |
| Track 2: AI-Payments (x402) | Explores AI-driven payments where autonomous agents initiate and settle on-chain transactions without human involvement |
Why the Broader Pipeline Matters
This is an MOU, not a commercial launch. But context matters. The Solana Foundation has now built institutional relationships across South Korea with Shinhan Card, Toss Bank, KG Group, and now KSNET. Each has been a testing step. The cumulative weight of this pipeline is harder to dismiss than any single announcement.
The x402 Angle
The AI payment track is worth watching separately. The ability for autonomous AI agents to handle on-chain payments is a use case Bitwise CIO Matt Hougan called one of the defining trends of the next cycle this week. KSNET provides the merchant network. Solana brings the settlement rails. Now the question is whether the proof-of-concept turns into something commercial faster than the competition.
KSNET x Solana Foundation — Key Facts
| Detail | Value |
| MOU Signing | July 30, 2026 |
| KSNET Network | 330,000 merchants |
| Monthly Volume | ~$4B |
| Years in Operation | 26 years |
| Solana Korea Partners | Shinhan Card, Toss Bank, KG Group, KSNET |
| Stage | MOU — Proof-of-Concept prior to commercial launch |
Solana Price Forecast for August 2026: Upside and Downside Targets
- Bullish Case: The triangle breaks upward, $SOL overcomes the 0.382 Fibonacci at $74.79 and the EMA cluster from $75 to $76, MSOL inflows persist into the second and third weeks, and the KSNET MOU draws attention to Solana's payment infrastructure push towards the 0.5 Fibonacci and 100-day EMA cluster at $79.27, as the CLARITY Act passes before August 8.
- Bearish Case: The triangle breaks lower through the session low of $73.42, the CLARITY Act stalls post-recess, MSOL inflows normalize after launch excitement fades, and $SOL descends towards the 0.236 Fibonacci at $69.25, as August's seasonally flat median turns negative in the context of aggressive Fed and Iran risk escalation.
Related: XRP Price Forecast for August 2026: Can $XRP Break Its Year-Long Downtrend as Grayscale CEO Sells GXRP?
end-content