
This article is from:Kalshi Research
Compiled by | Odaily Planet Daily (@OdailyChina); Translator | Azuma (@azuma_eth)
Editor's Note: Leading prediction market platform Kalshi yesterday announced the launch of a new research report series, Kalshi Research, aimed at providing Kalshi's internal data to scholars and researchers interested in topics related to prediction markets. The inaugural research report for this series has been released. The original title is "Kalshi Outperforms Wall Street in Predicting Inflation" (Beyond Consensus: Prediction Markets and the Forecasting of Inflation Shocks).
Below is the content of the original report, compiled by Odaily Planet Daily.

Overview
Typically, in the week leading up to the release of important economic statistics, analysts and senior economists from large financial institutions provide their estimates of the expected figures. These forecasts, when aggregated, are referred to as the "consensus expectation" and are widely regarded as a crucial reference for gaining insights into market changes and adjusting position layouts.
In this research report, we compare the performance of the consensus expectation versus the implied pricing from Kalshi's prediction markets (sometimes referred to herein as "market prediction") in forecasting the actual value of a key macroeconomic signal—the year-over-year headline inflation rate (YOY CPI).
Key Highlights
- Overall Superior Accuracy: Across all market environments (including normal and shock periods), Kalshi's predictions had a Mean Absolute Error (MAE) that was 40.1% lower than the consensus expectation.
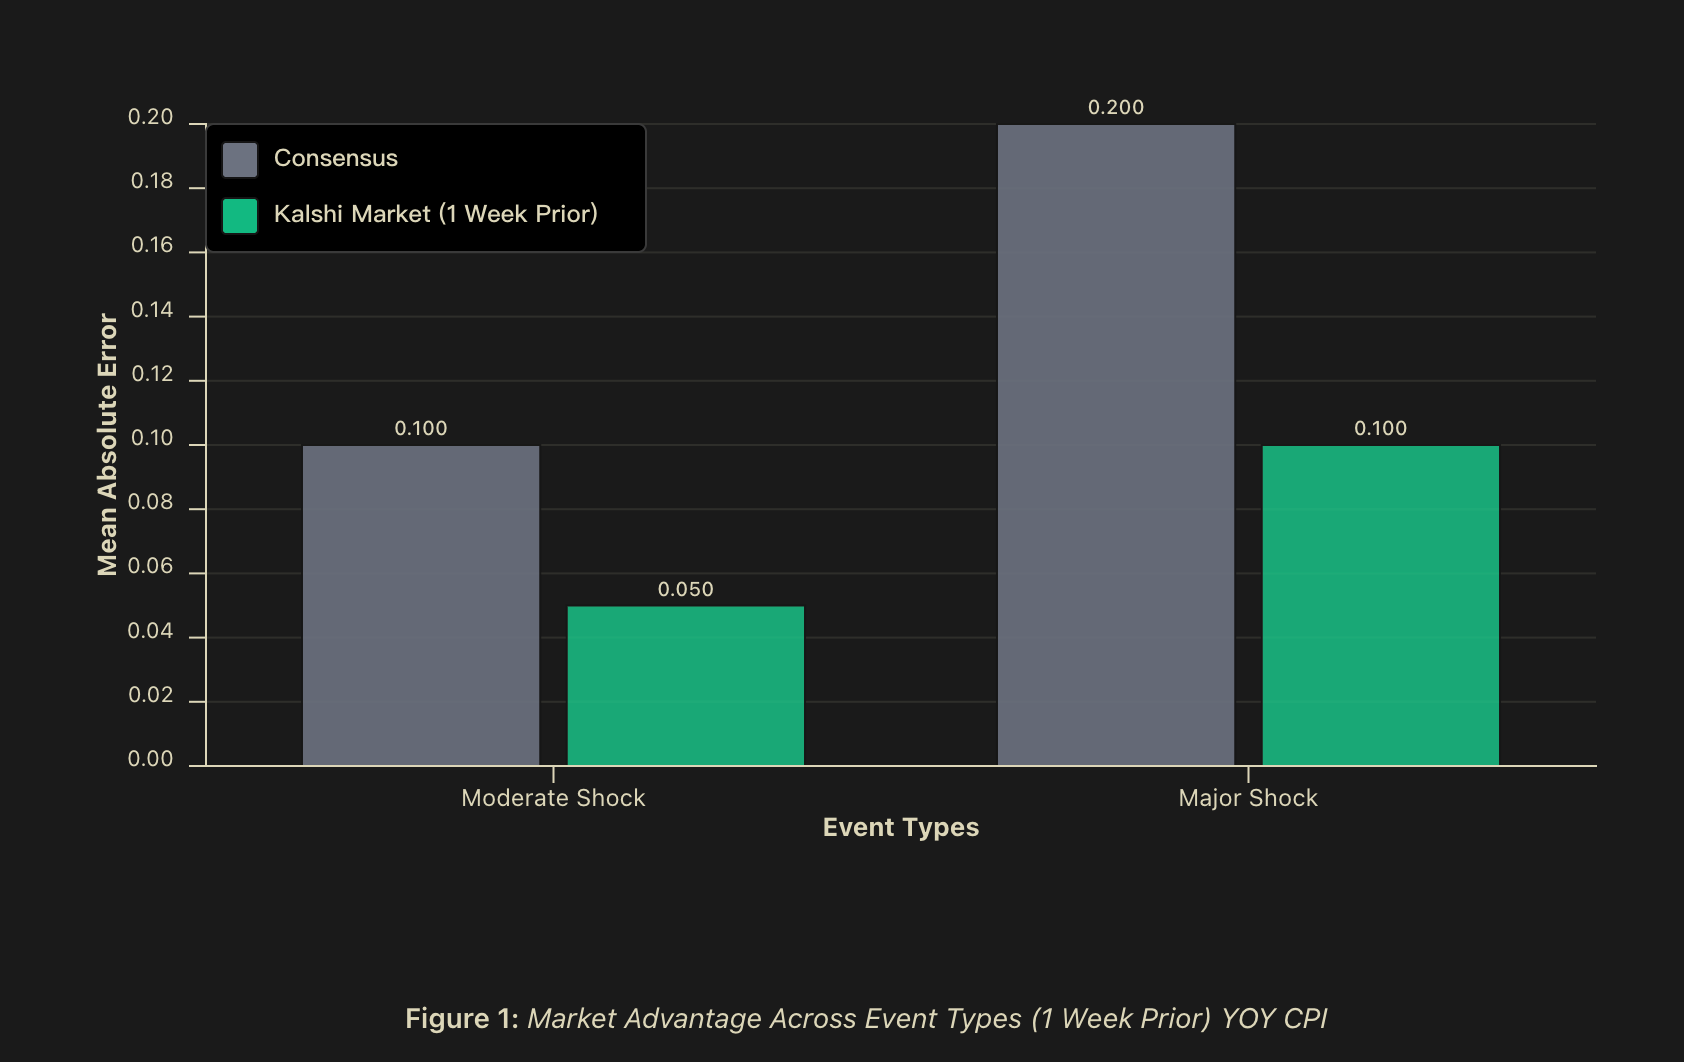
- "Shock Alpha": During periods of major shocks (greater than 0.2 percentage points), Kalshi's predictions one week ahead had an MAE 50% lower than the consensus expectation; this advantage expanded to 60% on the day before the data release. During periods of moderate shocks (between 0.1 - 0.2 percentage points), Kalshi's predictions one week ahead also had an MAE 50% lower than the consensus expectation, expanding to 56.2% on the day before the data release.
- Predictive Signal: When the deviation between the market prediction and the consensus expectation exceeded 0.1 percentage points, the probability of a shock occurring was approximately 81.2%, rising to about 82.4% on the day before the data release. In cases where the market prediction differed from the consensus expectation, the market prediction was more accurate in 75% of instances.
Background
Macroeconomic forecasters face an inherent challenge: the times when forecasting is most critical—namely, during market dislocations, policy shifts, and structural breaks—are precisely the periods when historical models are most likely to fail. Financial market participants typically release consensus forecasts days before key economic data announcements, aggregating expert opinions into market expectations. However, these consensus views, while valuable, often share similar methodological approaches and information sources.
For institutional investors, risk managers, and policymakers, the stakes of forecasting accuracy are asymmetric. During uncontroversial periods, slightly better predictions offer limited value; but during periods of market turmoil—when volatility spikes, correlations break down, or historical relationships fail—superior accuracy can yield significant Alpha returns and limit drawdowns.
Therefore, understanding how parameters behave during market volatility is crucial. We focus on a key macroeconomic indicator—the year-over-year headline inflation rate (YOY CPI)—a core reference for future interest rate decisions and an important signal of economic health.
We compared and evaluated forecasting accuracy across multiple time windows before the official data release. Our core finding is that so-called "Shock Alpha" indeed exists—during tail events, market-based predictions can achieve additional predictive precision compared to the consensus benchmark. This outperformance is not merely of academic interest; it significantly enhances signal quality at critical moments when forecasting errors carry the highest economic cost. In this context, the truly important question is not whether prediction markets are "always correct," but whether they provide a differentiated signal worthy of inclusion in traditional decision-making frameworks.
Methodology
Data
We analyzed the daily implied predictions of traders on the Kalshi platform at three time points: one week before the data release (matching the consensus release timing), one day before release, and the morning of the release. Each market used was (or had been) a real, tradable, active market, reflecting real-money positions at varying liquidity levels. For the consensus expectation, we collected institution-level YoY CPI consensus forecasts, typically published about a week before the U.S. Bureau of Labor Statistics official data release.
The sample period spans from February 2023 to mid-2025, covering over 25 monthly CPI release cycles across various macroeconomic environments.
Shock Classification
We categorized events into three types based on the "magnitude of surprise" relative to historical levels. A "shock" was defined as the absolute difference between the consensus expectation and the actual published data:
- Normal Events: YoY CPI forecast error below 0.1 percentage points;
- Moderate Shocks: YoY CPI forecast error between 0.1 and 0.2 percentage points;
- Major Shocks: YoY CPI forecast error exceeding 0.2 percentage points.
This classification allows us to examine whether predictive advantages vary systematically with the difficulty of the forecast.
Performance Metrics
To evaluate forecasting performance, we employed the following metrics:
- Mean Absolute Error (MAE): The primary accuracy metric, calculated as the average of the absolute differences between predicted and actual values.
- Win Rate: When the difference between the consensus expectation and the market prediction reached or exceeded 0.1 percentage points (rounded to one decimal place), we recorded which forecast was closer to the final actual result.
- Forecast Timeframe Analysis: We tracked how the accuracy of market valuations evolved from one week before release to the release day, revealing the value of continuously incorporating information.
Results: CPI Forecasting Performance
Overall Superior Accuracy
Across all market environments, the market-based CPI predictions had a Mean Absolute Error (MAE) that was 40.1% lower than the consensus forecasts. Across all timeframes, the MAE for market-based CPI predictions was lower than the consensus expectation by 40.1% (one week ahead) to 42.3% (one day ahead).
Furthermore, in cases where the consensus expectation and the market-implied value diverged, Kalshi's market-based predictions demonstrated a statistically significant win rate, ranging from 75.0% one week ahead to 81.2% on release day. If ties with the consensus expectation (accurate to one decimal place) are included, the market-based prediction was tied or better than consensus in approximately 85% of cases one week ahead.
Such a high directional accuracy rate indicates: when market predictions diverge from the consensus expectation, this divergence itself carries significant informational value regarding the likelihood of a shock event occurring.
"Shock Alpha" Exists
The difference in forecasting accuracy was particularly pronounced during shock events. During moderate shock events, the MAE of market predictions was 50% lower than the consensus expectation at the release time, and this advantage expanded to 56.2% or more on the day before the data release; during major shock events, the MAE of market predictions was also 50% lower than the consensus expectation at the release time, and could reach 60% or more on the day before the data release; whereas in normal environments without shocks, market predictions and consensus expectations performed roughly equally.
Although the sample size for shock events is small (reasonable in a world where shocks are inherently highly unpredictable), the overall pattern is clear: when the forecasting environment is most challenging, the information aggregation advantages of markets are most valuable.
However, more importantly, it's not just that Kalshi's predictions perform better during shock periods, but also that the divergence between market predictions and the consensus expectation itself may be a signal of an impending shock. In cases of divergence, the win rate of market predictions relative to the consensus expectation reached 75% (within comparable time windows). Furthermore, threshold analysis indicates: when the deviation between the market and consensus exceeds 0.1 percentage points, the probability of predicting a shock is approximately 81.2%, and on the day before the data release, this probability further increases to about 84.2%.
This practically significant difference suggests that prediction markets can serve not only as a competitive forecasting tool alongside consensus expectations but also as a "meta-signal" regarding forecasting uncertainty, transforming market-consensus divergence into a quantifiable early warning indicator for potential unexpected outcomes.
Further Discussion
An obvious question follows: Why do market predictions outperform consensus forecasts during shocks? We propose three complementary mechanisms to explain this phenomenon.
Market Participant Heterogeneity and "Wisdom of the Crowd"
Traditional consensus expectations, while integrating views from multiple institutions, often share similar methodological assumptions and information sources. Econometric models, Wall Street research reports, and government data releases form a highly overlapping common knowledge base.
In contrast, prediction markets aggregate positions held by participants with diverse information bases: including proprietary models, industry-level insights, alternative data sources, and experience-based intuition. This participant diversity has a solid theoretical foundation in the "wisdom of crowds" theory. This theory suggests that when participants possess relevant information and their prediction errors are not perfectly correlated, aggregating independent predictions from diverse sources often yields superior estimates.
The value of this informational diversity is particularly pronounced during "state shifts" in the macro environment—individuals with scattered, local information interact in the market, and their informational fragments combine to form a collective signal.
Differences in Participant Incentive Structures
Institution-level consensus forecasters often operate within complex organizational and reputational systems that systematically deviate from the goal of "purely pursuing predictive accuracy." The career risks faced by professional forecasters create an asymmetric payoff structure—significant forecasting errors incur substantial reputational costs, while even extreme accuracy, especially achieved by deviating substantially from peer consensus, may not yield proportional career rewards.
This asymmetry induces "herding behavior," where forecasters tend to cluster their predictions near the consensus value, even if their private information or model outputs suggest different results. The reason is that within the career system, the cost of "being wrong alone" is often higher than the reward for "being right alone."
In stark contrast, the incentive mechanism faced by prediction market participants directly aligns forecasting accuracy with economic outcomes—accurate predictions mean profits, incorrect predictions mean losses. In this system, reputational factors are almost non-existent; the only cost of deviating from market consensus is economic loss, entirely dependent on the prediction's correctness. This structure imposes stronger selection pressure for predictive accuracy—participants who can systematically identify consensus forecast errors continuously accumulate capital and amplify their influence in the market through larger position sizes;而那些 mechanically follow consensus suffer continuous losses when consensus proves wrong.
During periods of significantly heightened uncertainty, when the career cost for institutional forecasters to deviate from expert consensus is at its peak, this divergence in incentive structures is often most pronounced and economically most significant.
Information Aggregation Efficiency
A noteworthy empirical fact is: even one week before the data release—a timeframe matching the typical window for consensus expectation releases—market predictions still exhibit significant accuracy advantages. This suggests that the market advantage does not stem solely from the often-cited "information speed advantage" of prediction market participants.
Instead, market predictions may more efficiently aggregate information fragments that are too dispersed, too industry-specific, or too ambiguous to be formally incorporated into traditional econometric forecasting frameworks. The relative advantage of prediction markets may lie not in earlier access to public information, but in their ability to synthesize heterogeneous information more effectively within the same timeframe—information that survey-based consensus mechanisms, even with the same time window, often struggle to process efficiently.
Limitations and Caveats
Our findings require an important qualification. Since the overall sample covers only about 30 months, and major shock events are by definition rare, this means statistical power remains limited for larger tail events. A longer time series will enhance future inferential ability, although the current results strongly suggest the superiority and differentiated signal of market predictions.
Conclusion
We document systematic and economically significant outperformance of prediction markets relative to expert consensus expectations, particularly during shock periods when forecasting accuracy is most critical. Market-based CPI predictions exhibited approximately 40% lower error overall, and this error reduction reached about 60% during periods of major structural change.
Based on these findings, several future research directions become particularly important: First, investigating whether "Shock Alpha" events themselves can be predicted using volatility and forecast divergence indicators, across a larger sample size and multiple macroeconomic indicators; Second, determining the liquidity threshold above which prediction markets can stably outperform traditional forecasting methods; Third, exploring the relationship between prediction market forecasts and those implied by high-frequency trading financial instruments.
In an environment where consensus forecasts heavily rely on correlated model assumptions and shared information sets, prediction markets offer an alternative information aggregation mechanism capable of capturing state switches earlier and processing heterogeneous information more efficiently. For entities needing to make decisions in an economic environment characterized by rising structural uncertainty and tail event frequency, "Shock Alpha" may represent not just an incremental improvement in predictive capability, but a fundamental component of a robust risk management infrastructure.