Is Bitcoin’s dip below $70K the latest fakeout before its next move higher?

ambcryptoPublished on 2026-03-28Last updated on 2026-03-28

Abstract

Bitcoin's recent dip below $70,000 may be a sign of impending decline, but key indicators suggest it could be a bear trap before a potential upward move. Unlike bear markets, current derivatives data shows no significant long liquidations, indicating traders are not panicking but repositioning. On-chain activity supports this: a new wallet withdrew $179 million worth of BTC from Binance, signaling fresh capital inflow, while short-term holder inflows to exchanges have dropped sharply from 100,000 BTC in early February to just 25,000 BTC. This suggests growing confidence and market stability, making the current pullback a likely fakeout to shake out weak hands before a bullish continuation.

A key difference between bull and bear markets is how traders position around FUD.

In a bear market, for example, highly overstretched derivatives positions indicate that traders are leaning heavily on speculation. On the other hand, during a bull market, conviction tends to hold strong. In this way, trader behavior around fear and uncertainty reveal the underlying trend.

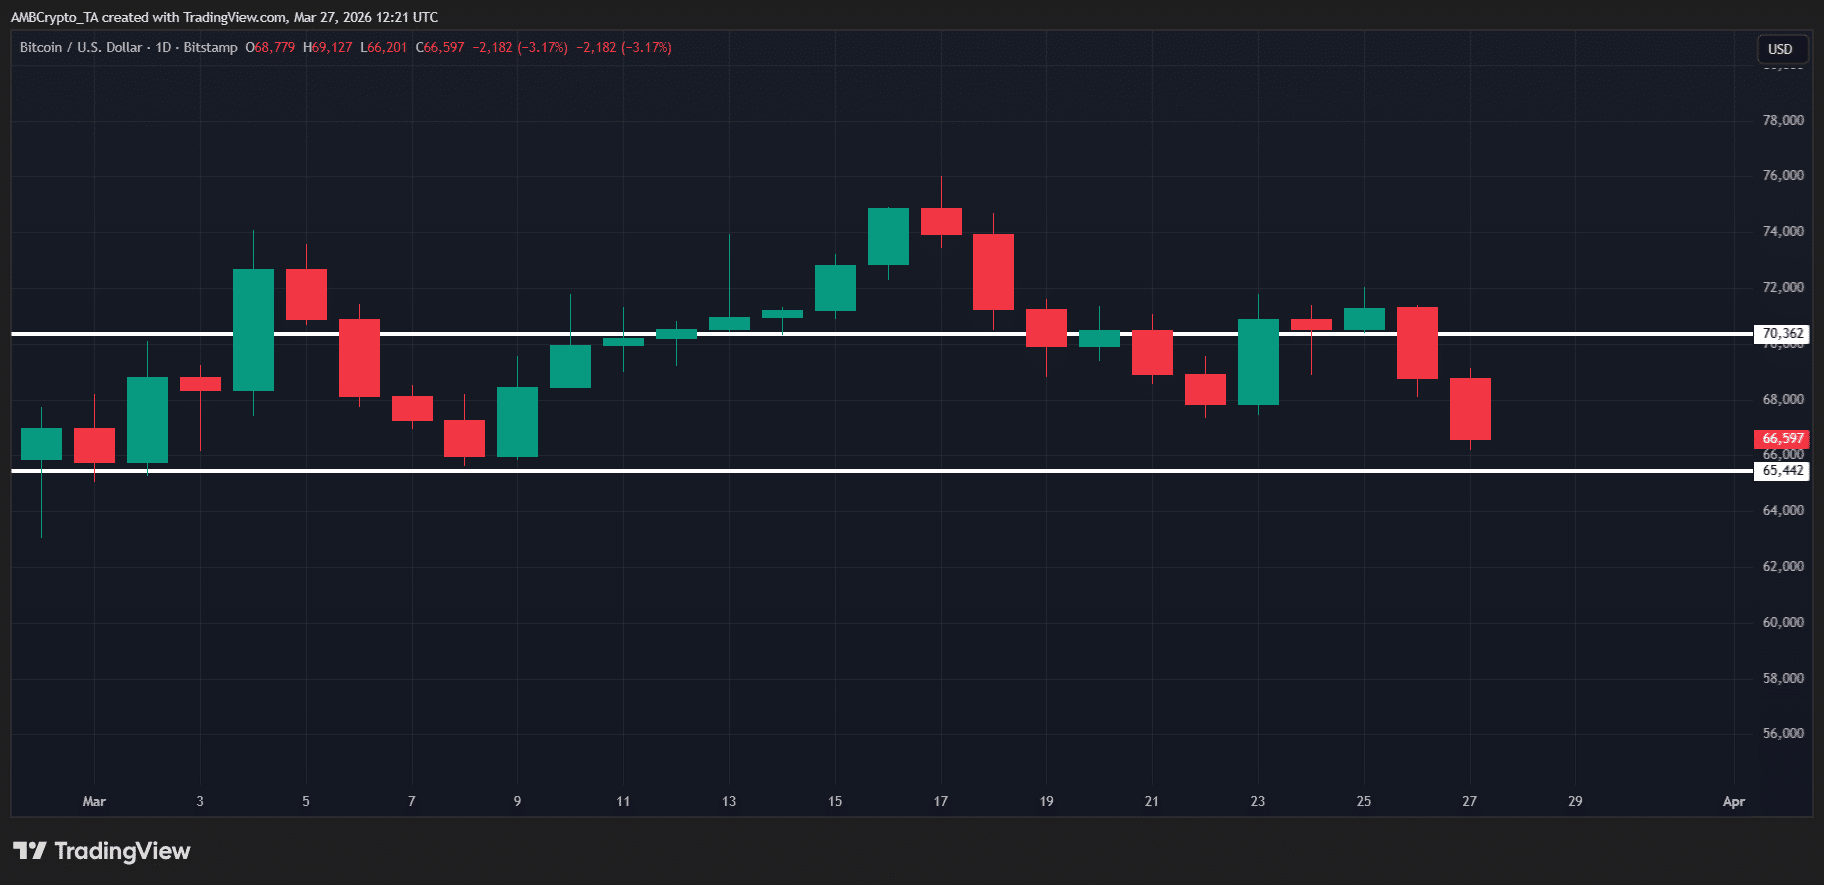
Naturally, the question now is, where does Bitcoin [BTC] sit in this context? Technically, at press time, BTC seemed to be showing a bearish tilt after a volatile 48 hours. The price slipped by over 6%, breaking below the $70k-support level, with the crypto retracing back towards its early-March levels.

Source: TradingView (BTC/USDT)

Still, there has been no sign of cascading liquidations just yet.

According to Coinglass, Bitcoin’s long liquidations remain under $120 million, even lower than mid-March, when BTC dropped by 6.83% in the week after the FOMC meeting. This might mean that traders aren’t panicking yet, and the market may be digesting the move rather than capitulating.

This divergence is telling. Normally, a break below key support would trigger heavy deleveraging, forcing traders to close positions. Instead, the reaction has been contained, signaling that Bitcoin’s derivatives positioning hasn’t been overstretched despite the consolidation.

Notably, analysts have pointed out that this looks more like market repositioning, rather than outright dumping. In other words, traders may be adjusting their positions instead of panicking. If this interpretation holds, BTC’s recent pullback could actually be a textbook bear trap, a fakeout designed to shake out weak hands before the market makes a potential move higher.

On-chain activity supports a bullish bias for Bitcoin

Traders’ positioning clearly underlined which side has been dominating the market lately.

A notable signal came from Lookonchain, which flagged that a “newly” created wallet withdrew 2,650 BTC ($179.6 million) from Binance. The fact that the wallet is newly created is important as it hinted at fresh capital entering the market. Despite Bitcoin’s price dipping below the $70k-level.

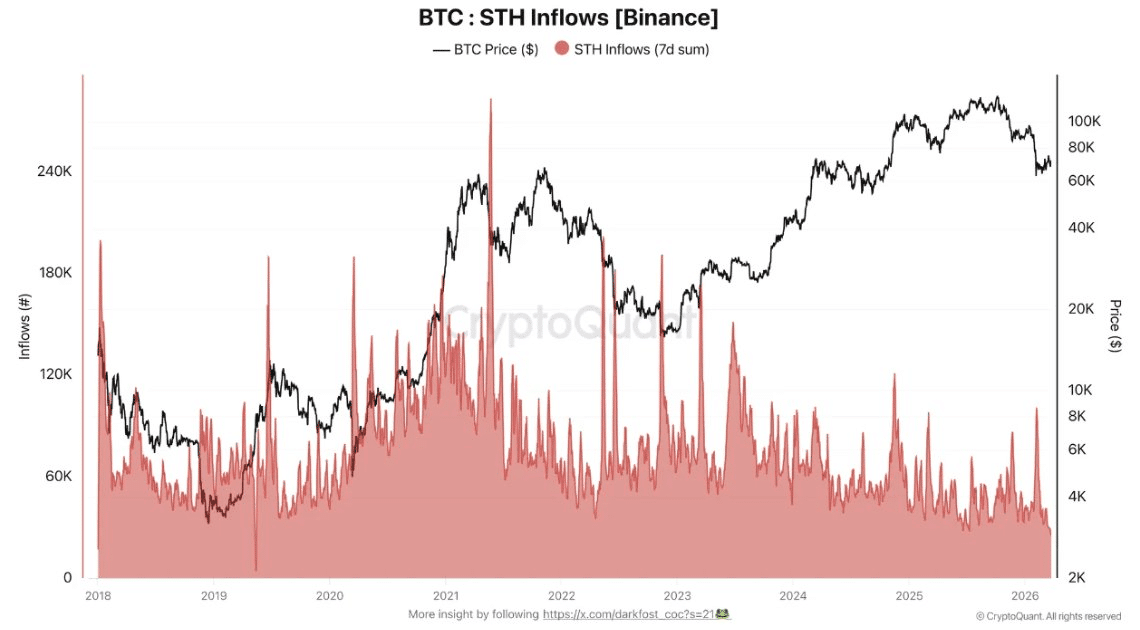
Meanwhile, CryptoQuant’s latest report highlighted a strong bullish signal. When BTC fell below $60K, panic among short-term holders (STHs) drove roughly 100K BTC to Binance in early February. However, this behavior has since shifted dramatically.

Today, STH inflows are down to just 25,000 BTC.

Source: CryptoQuant

According to AMBCrypto, this divergence is also telling.

Normally, STHs are the first to panic sell when FUD rises, locking in gains or cutting losses to protect their wallets. However, with inflows now so low, it means short-term holders are holding steady instead of capitulating, indicating growing confidence and a more stable market structure.

Taken together, two key divergences (derivatives that aren’t overstretched and a confident STH cohort) indicate that the market may be stabilizing. Fresh capital is coming in, and traders appear to be positioning for a potential bullish continuation, making Bitcoin’s current pullback a textbook fakeout to the downside.


Final Summary

  • Bitcoin derivatives aren’t overstretched as STHs are holding steady and fresh capital is entering – Marking key divergences this cycle.
  • BTC’s recent dip could be a textbook bear trap, shaking out weak hands before a potential bullish move.

Related Questions

QWhat key difference between bull and bear markets does the article highlight regarding trader behavior around FUD?

AIn a bear market, highly overstretched derivatives positions indicate traders are leaning heavily on speculation, while during a bull market, conviction tends to hold strong, revealing the underlying trend through their behavior around fear and uncertainty.

QWhy does the article suggest Bitcoin's recent drop below $70K might be a 'fakeout'?

AThe article suggests it might be a fakeout because there are no signs of cascading liquidations, derivatives positioning isn't overstretched, and traders appear to be repositioning rather than panicking, potentially shaking out weak hands before a bullish move higher.

QWhat on-chain activity supports a bullish bias for Bitcoin according to the report?

AOn-chain activity supporting a bullish bias includes a newly created wallet withdrawing a large amount of BTC from Binance, indicating fresh capital entering, and a dramatic decrease in short-term holder (STH) inflows to exchanges, signaling they are holding steady instead of panic-selling.

QWhat does the low level of long liquidations (under $120M) indicate about the current market sentiment?

AThe low level of long liquidations indicates that traders are not panicking yet, and the market is likely digesting the price move rather than capitulating, which is a sign of stability and confidence.

QHow has the behavior of short-term holders (STHs) changed from early February to the time of the report?

AIn early February, panic among STHs drove roughly 100,000 BTC to Binance when BTC fell below $60K. However, their inflows have since dramatically decreased to just 25,000 BTC, showing they are now holding steady and not capitulating, indicating growing confidence.

Related Reads

XRP Ledger Daily Fees Drop Below $400 As Network Activity Question Returns

The XRP Ledger is drawing attention as daily network fees have fallen below $400. While low fees align with XRPL's design for affordable transactions and are often seen as a strength, the metric can also serve as an indicator of network demand and paid transaction volume. This data point of around $3,100 in weekly fee burn highlights the stark contrast with higher-fee chains like Ethereum and Bitcoin. The development fuels an ongoing debate. Proponents view low fees as a sign of efficiency and accessibility, while critics may question if the network is generating sufficient high-value activity relative to its market cap and payments-focused narrative. The article cautions against overstating the finding, noting a single low-fee day does not signify network failure. It instead adds context to discussions about XRPL's usage, especially alongside Ripple's broader initiatives in stablecoins (RLUSD), AI payments, and enterprise infrastructure. The report recommends monitoring for a fee rebound, checking transaction counts for a fuller picture, and confirming the trend via native explorers like Bithomp. It frames the story within a larger market shift where on-chain data, protocol updates, and infrastructure developments are becoming crucial alongside price action. The editorial stance is to present the verified data, explain its significance for assessing network activity, and avoid hype, positioning it as part of the daily crypto conversation.

bitcoinist2h ago

XRP Ledger Daily Fees Drop Below $400 As Network Activity Question Returns

bitcoinist2h ago

Trading

Spot
Futures

Hot Articles

Discussions

Welcome to the HTX Community. Here, you can stay informed about the latest platform developments and gain access to professional market insights. Users' opinions on the price of S (S) are presented below.

活动图片