The Bitcoin [BTC] halving is often misinterpreted as an instant price catalyst.
In reality, it works through a gradual supply reduction effect, supported by Bitcoin’s technical setup. Notably, major upside phases have occurred in the 12-18 months after a halving, rather than immediately. After the 2016 halving, for instance, Bitcoin saw its main expansion in 2017, gaining over 1,000%. Similarly, after the 2020 halving, the strongest upside played out through 2020-2021, with a full-cycle rally of roughly 60%.
By contrast, the second halves (H2) of 2018 and 2022 are widely viewed as late-cycle drawdowns. In 2018, Bitcoin fell 40%-45% in the second half of the year. In 2022, it fell 15%-20% before bottoming toward year-end. Taken together, it does appear that H2 weakness in those cycles reflects a “post-halving cooling phase.”

Bitcoin cycle tested as 2026 moves into H2 phase
The crypto market has officially stepped into the H2 phase of the 2026 cycle.
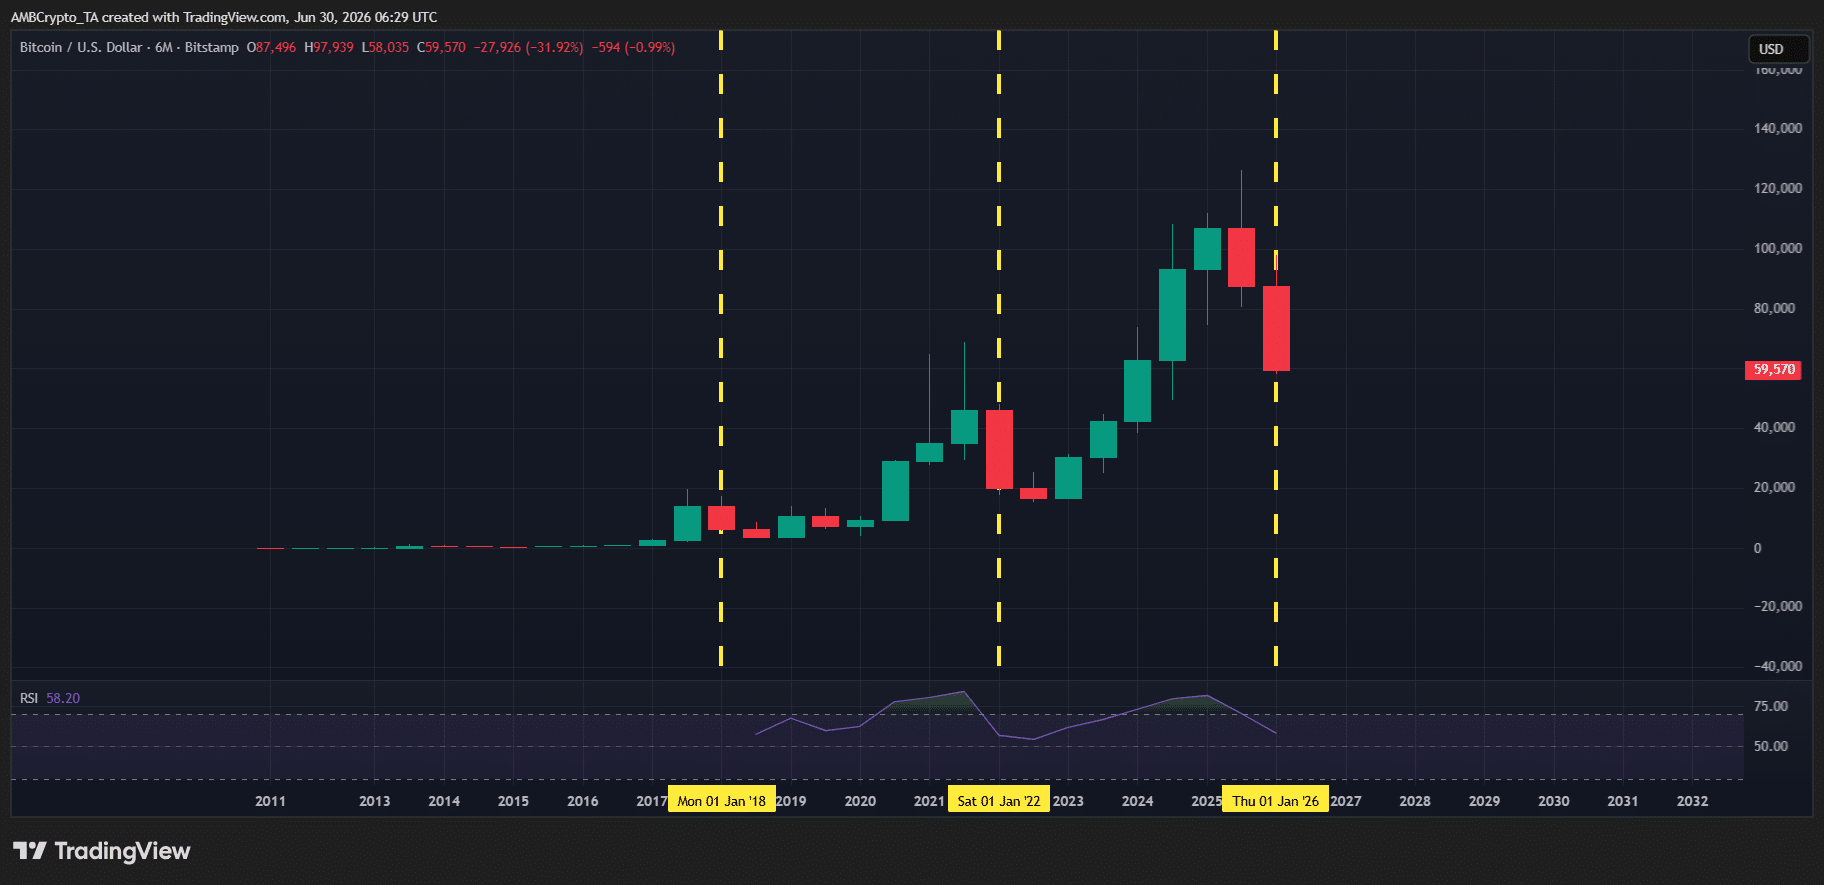
So far, the cycle structure is broadly tracking Bitcoin’s post-halving behavior seen in 2018 and 2022. Bitcoin is closing H1 down over 30%, which is similar in character to H1 2018 (down nearly 54%) and H1 2022 (down over 56%). In this context, 2026 looks consistent with a post-halving cooldown phase following the 2024 halving, which cut Bitcoin’s block subsidy from 6.25 BTC to 3.125 BTC per block.
If the same playbook holds, Bitcoin could be on track to close H2 in the red. This is also supported by K33 Research Senior Analyst Vetle Lunde, who noted:
The 2022 Bitcoin drawdown lasted for 286 days. In the 2014 and 2018 bear markets, the bottoms occurred 12-13 months after the bear markets began, with a max drawdown of 84-85%. If history is to repeat, a bottom could be expected to form near year-end.
In this context, the roughly 30% H1 drawdown this year can still be viewed as part of a broader post-halving cooldown phase.
However, the 2025 cycle stands out as the first time Bitcoin closed H2 down over 18%. That’s historically unusual and raises a key question: Did 2025 break the post-halving pattern? If so, does it imply Bitcoin is diverging from the 2018 and 2022-style H2 drawdowns, potentially setting up a different trajectory for 2026?
Late-cycle dynamics shift toward liquidity stress
To understand what to expect in H2 2026, it’s worth taking a step back.
Following Bitcoin’s major expansion phases in 2017 and 2021, the subsequent bear markets of 2018 and 2022 can be considered part of a broader post‐halving normalization. During these periods, the market digested prior gains, locked in profits from earlier rallies, and ultimately transitioned into large‐scale distribution and deleveraging.
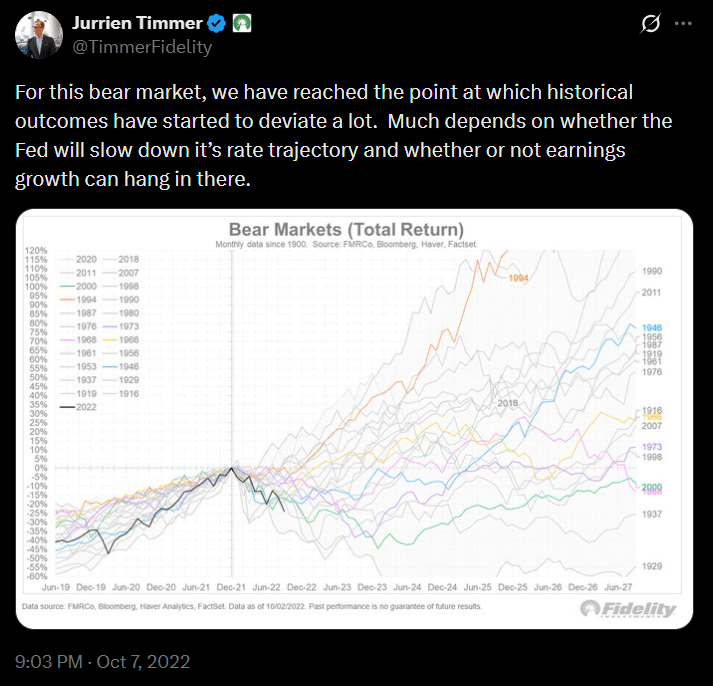
However, the similarities between the second halves of 2018 and 2022 go beyond just that structural setup. Both periods shared a similar macro backdrop. In 2018, the Fed raised interest rates four times over the year, tightening liquidity conditions. Similarly, the 2022 bear market was largely driven by the collapse of Terra, alongside a tight liquidity backdrop, as highlighted in a post by Jurrien Timmer, Director of Global Macro at Fidelity.

Against this backdrop, calling the 2018 and 2022 H2 bear markets a “cooldown phase” may be premature.
According to AMBCrypto, this is where Bitcoin’s path into H2 2026 can be better analyzed. And one factor that may sit at the center of this discussion is not just halving structure, but “liquidity.”
Cycle history meets new market structure in Bitcoin’s 2026 outlook
The macro backdrop in 2026 has, so far, closely resembled the previous two post-halving bear markets.
From a macro perspective, geopolitical tensions in the Middle East have kept the newly appointed Fed Chair, Kevin Warsh, cautious on rate cuts, with markets increasingly pricing in a higher-for-longer interest rate environment. The economic data supports this, with U.S. inflation rising to a two-year high of 4.2% in May, keeping liquidity conditions tight.
Against this backdrop, H2 appears set to be another challenging period for Bitcoin. However, this is where the current cycle starts to diverge. Unlike the previous two post-halving cycles, the current liquidity backdrop is stronger. While Bitcoin’s supply remains fixed, liquidity across the broader crypto market has expanded, a trend also highlighted in Fidelity’s latest report:
Crypto bull markets have often been fueled by new trends that bring fresh money into the market. The 2020–2021 cycle, for example, was driven by the rise of NFTs and memecoins. Today, new growth areas such as RWA tokenization, stablecoins, and AI-powered crypto applications are gaining momentum. If these sectors continue to grow, they could bring new capital into crypto.
Now, the focus shifts to the on-chain growth across these sectors. The key question is whether the liquidity flowing into these projects is large enough to support sustained capital inflows across the broader market. If it is, Bitcoin could begin to diverge from the post-halving patterns seen in 2018 and 2022.
If not, the current macro backdrop, combined with the post-halving cooldown phase, could keep pressure on BTC through H2. In that case, Bitcoin could finish the second half in the red, potentially pulling the broader crypto market to its first double-digit annual decline since the 2022 bear market.
The liquidity landscape is changing, but can Bitcoin benefit?
The growth across these sectors is becoming increasingly difficult to ignore. Reflecting this shift, Stellar President Denelle Dixon said at the start of 2026:
On-chain finance is entering an era of exponential growth, and 2026 will be all about acceleration, not experimentation. Partners like PayPal and MoneyGram have already brought stablecoins into the mainstream, and we’ll continue to see deeper, trusted integration into the everyday financial system.
The on-chain data largely supports that view. In the RWA sector, tokenization has accelerated rapidly this year, with the total value of tokenized assets climbing to nearly $40 billion, a 90% year-to-date increase. However, the liquidity picture is more mixed. The stablecoin market (the crypto market’s primary liquidity source) has contracted by roughly $11 billion in market cap.
In essence, liquidity isn’t spreading evenly but remains concentrated in a few growth sectors. Despite not fully aligning with previous post-halving patterns, Bitcoin’s H2 2026 outlook therefore is still being shaped more by a volatile macro backdrop, which is keeping liquidity tight going into H2.
As a result, uneven capital flows across crypto are limiting a broad-based bullish Bitcoin cycle.