Examining why FET’s rally faces pressure despite a 20% daily surge

ambcryptoPublished on 2026-03-17Last updated on 2026-03-17

Abstract

FET's price surged over 20% with trading volume up 106%, signaling renewed interest and a recovery from recent lows. However, the rally faces underlying pressure from persistent selling activity. Despite forming a rounded bottom and showing bullish technical indicators like MACD and Parabolic SAR turning positive, rising exchange reserves (up 16.9%) indicate increased sell-side supply. Spot Taker data remains sell-dominant, suggesting aggressive selling continues even as prices rise. While the structure shows recovery potential toward $0.25-$0.35, sustained buyer absorption is critical. Failure to maintain demand or hold higher lows could weaken the rally due to ongoing distribution pressure.

Artificial Superintelligence Alliance [FET] jumped by more than 20% at press time, as trading volume spiked by more than 106%, reflecting a sharp surge in participation alongside renewed price strength. The token traded near $0.229 after reclaiming the $0.16 level, indicating a clear recovery from recent lows.

However, rising activity does not fully reflect pure demand strength, as underlying sell-side pressure continues to influence order flow. The rally aligns with increased volatility, while buyers absorb consistent selling across the market. This behavior suggests that the move builds on active positioning rather than organic accumulation alone.

As a result, the current structure highlights both opportunities and fragilities in FET’s recovery phase.

Is a rounded bottom shaping FET’s recovery?

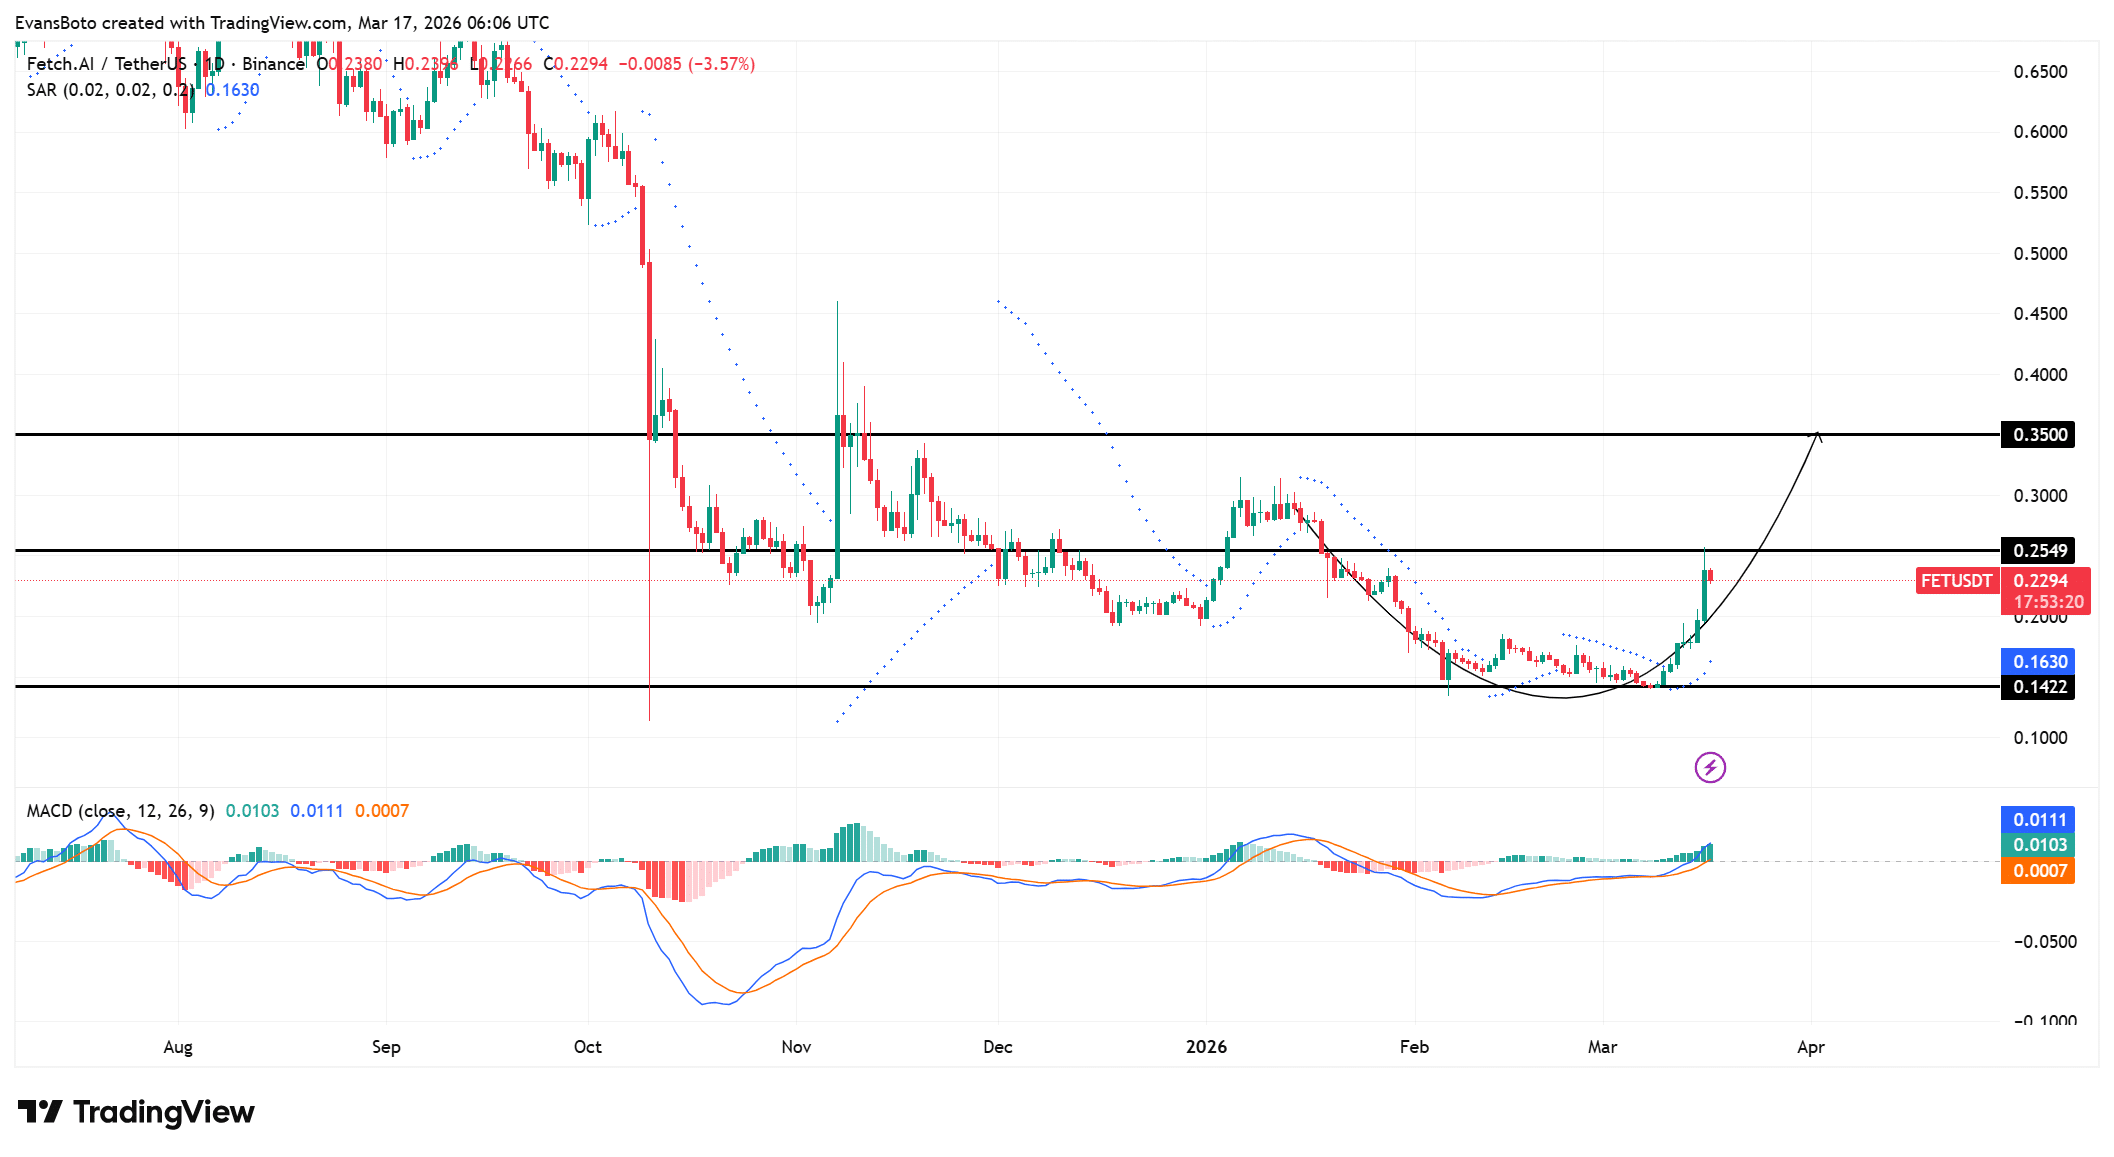
At press time, FET formed a rounded bottom after stabilizing near the $0.14 support zone, signaling a gradual shift from distribution into accumulation.

The token has steadily reclaimed the $0.16 level and is now approaching the $0.25 resistance level, indicating improving structural strength. The curvature reflects sustained buyer absorption rather than impulsive spikes, which often support longer recovery phases.

However, resistance near $0.25 remains critical, as prior rejections have occurred in this zone. If the price sustains higher lows, the structure could extend toward $0.35.

Still, the current move depends on continued demand strength, as failure to hold reclaimed levels would weaken the developing base. MACD has crossed above the signal line, with the histogram turning positive and expanding gradually over recent sessions.

This shift reflects strengthening upside pressure as buyers regain short-term control of the trend. At the same time, Parabolic SAR dots have crossed below the price, confirming a transition from a bearish to a bullish structure.

These indicators now align with the formation of a rounded bottom, reinforcing the ongoing recovery phase.

Source: TradingView

Exchange reserves climb as sell risk builds

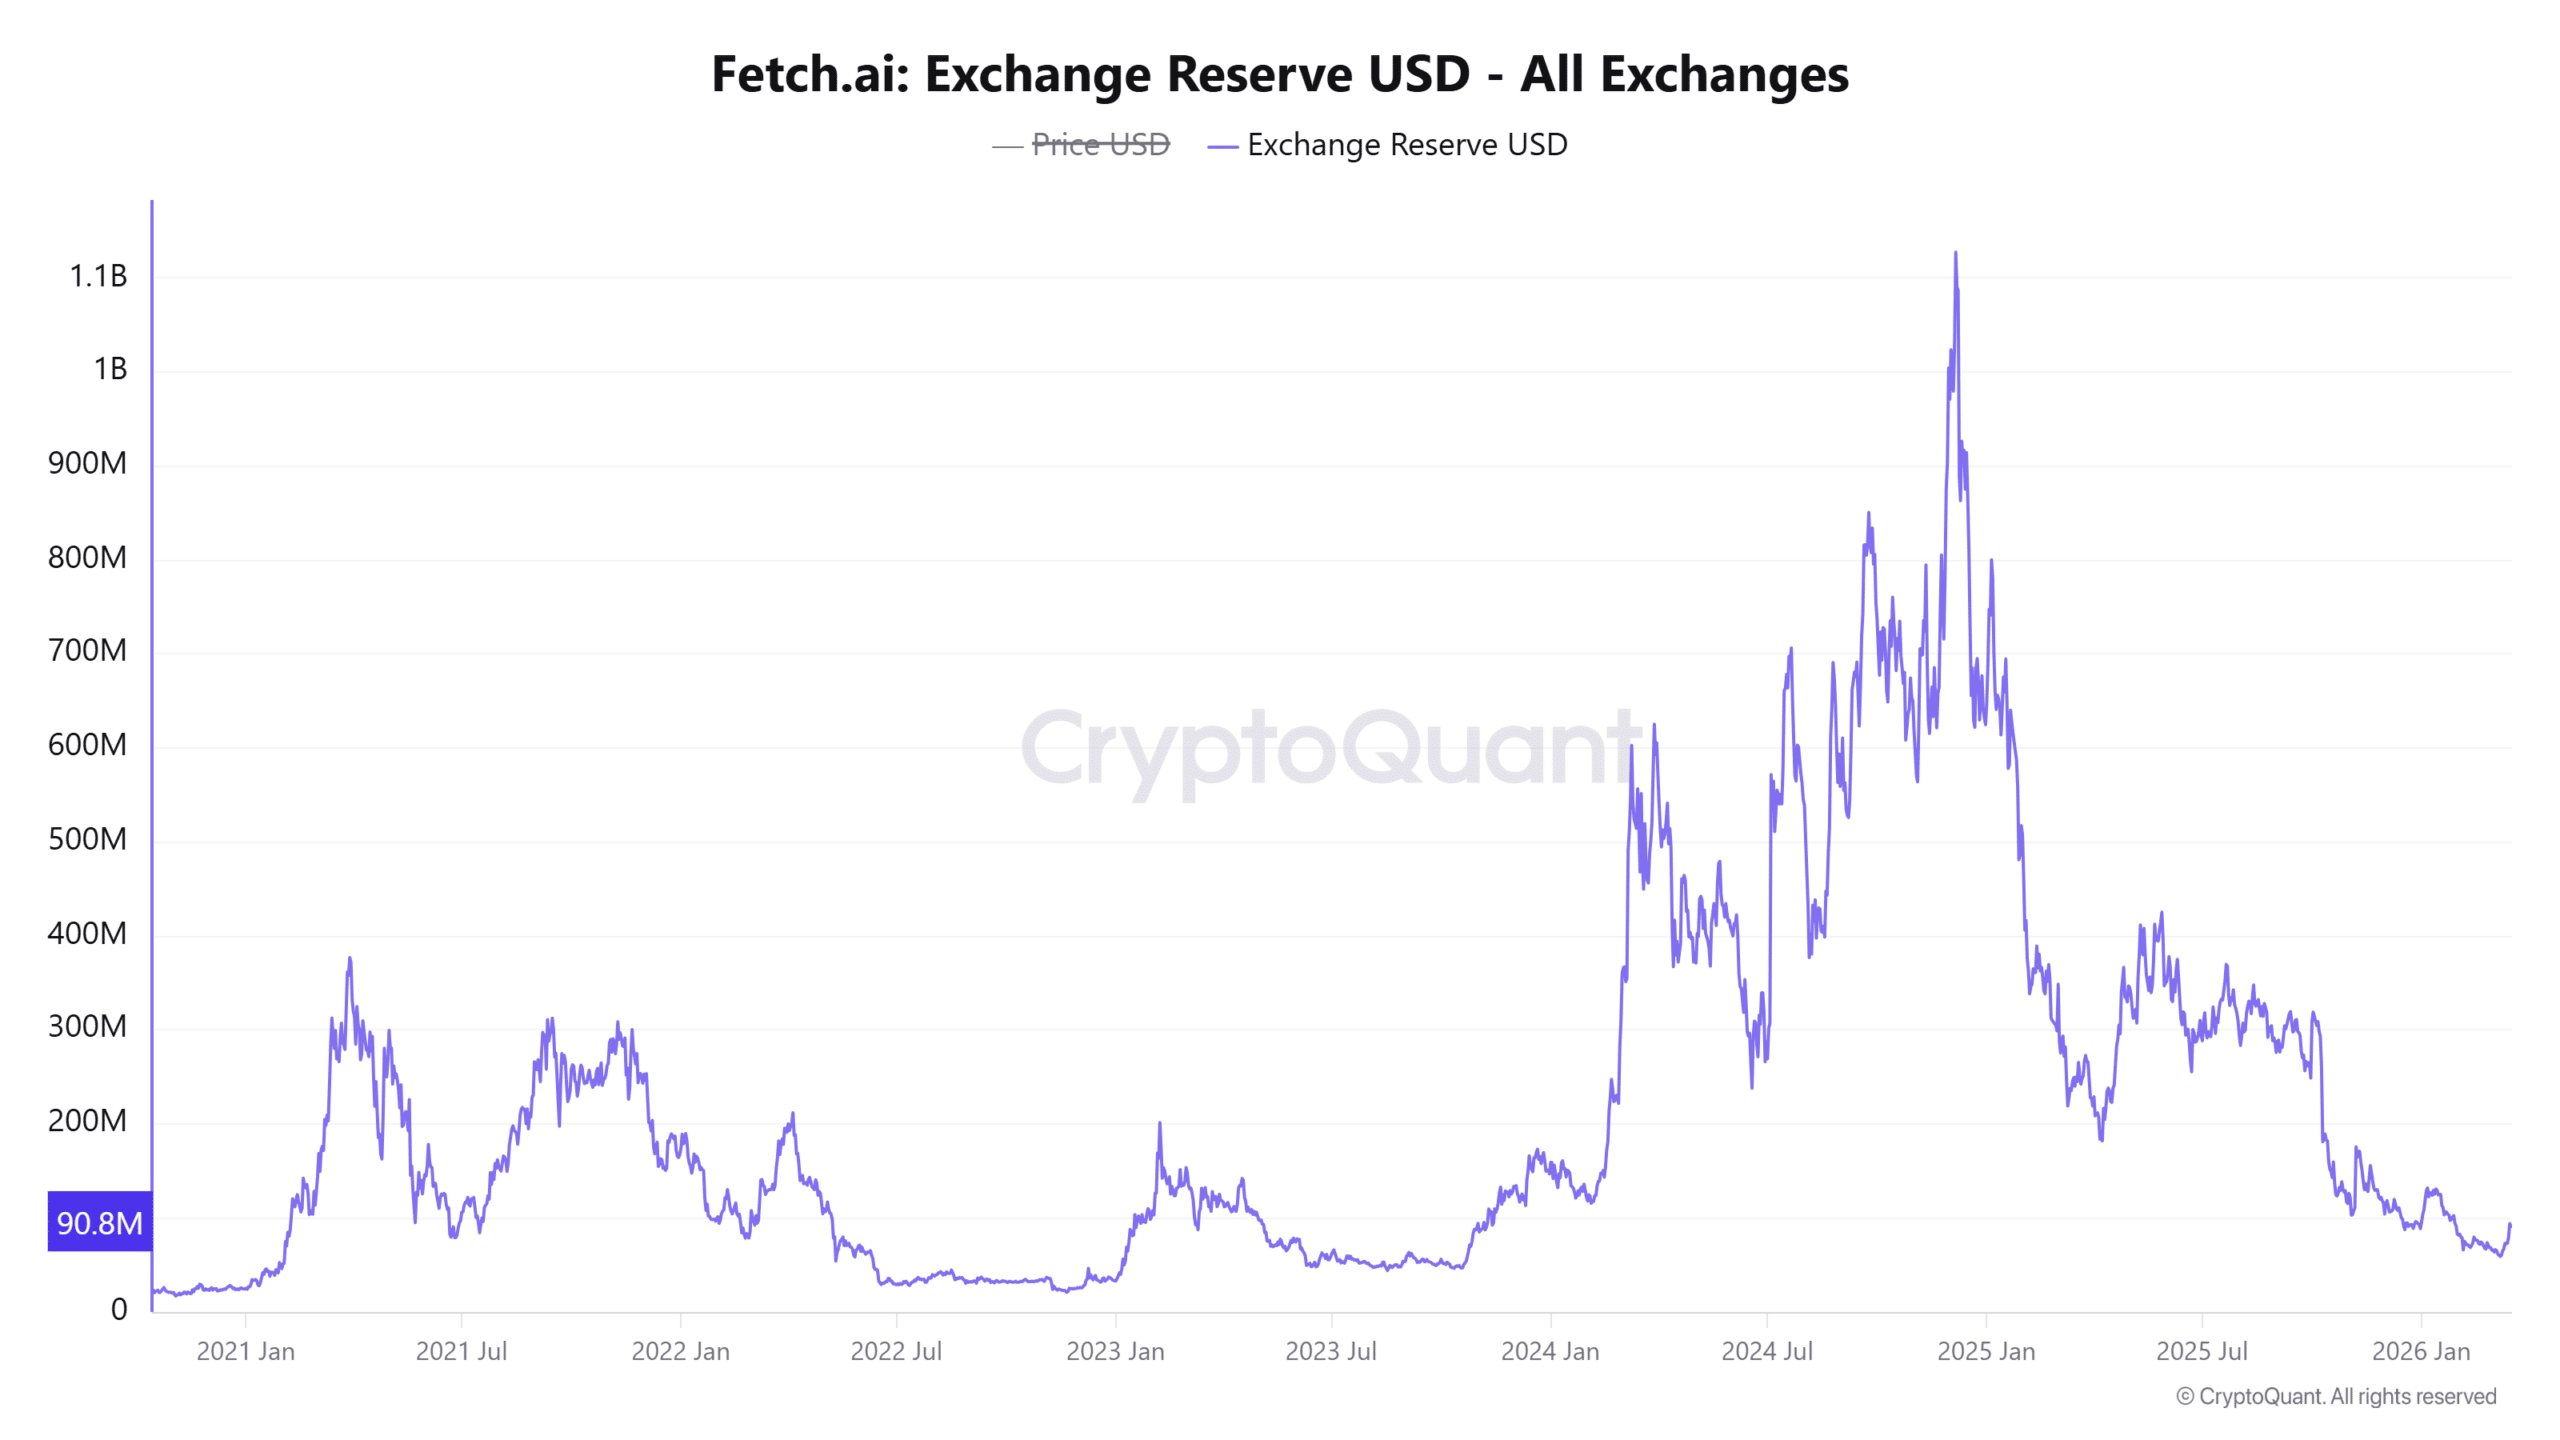
The Exchange Reserve USD has increased by 16.9%, reaching approximately $92.49 million, indicating that more FET tokens are being moved onto trading platforms. This shift introduces additional sell-side supply, which could create overhead pressure during upward price attempts.

While price continues to recover, rising reserves often reflect preparation for distribution rather than accumulation. If reserves continue to expand, resistance zones may strengthen due to added supply.

The current trend persists, although increasing exchange balances suggest that sellers still maintain a notable presence.

Source: CryptoQuant

Why do bears dominate despite FET’s rally?

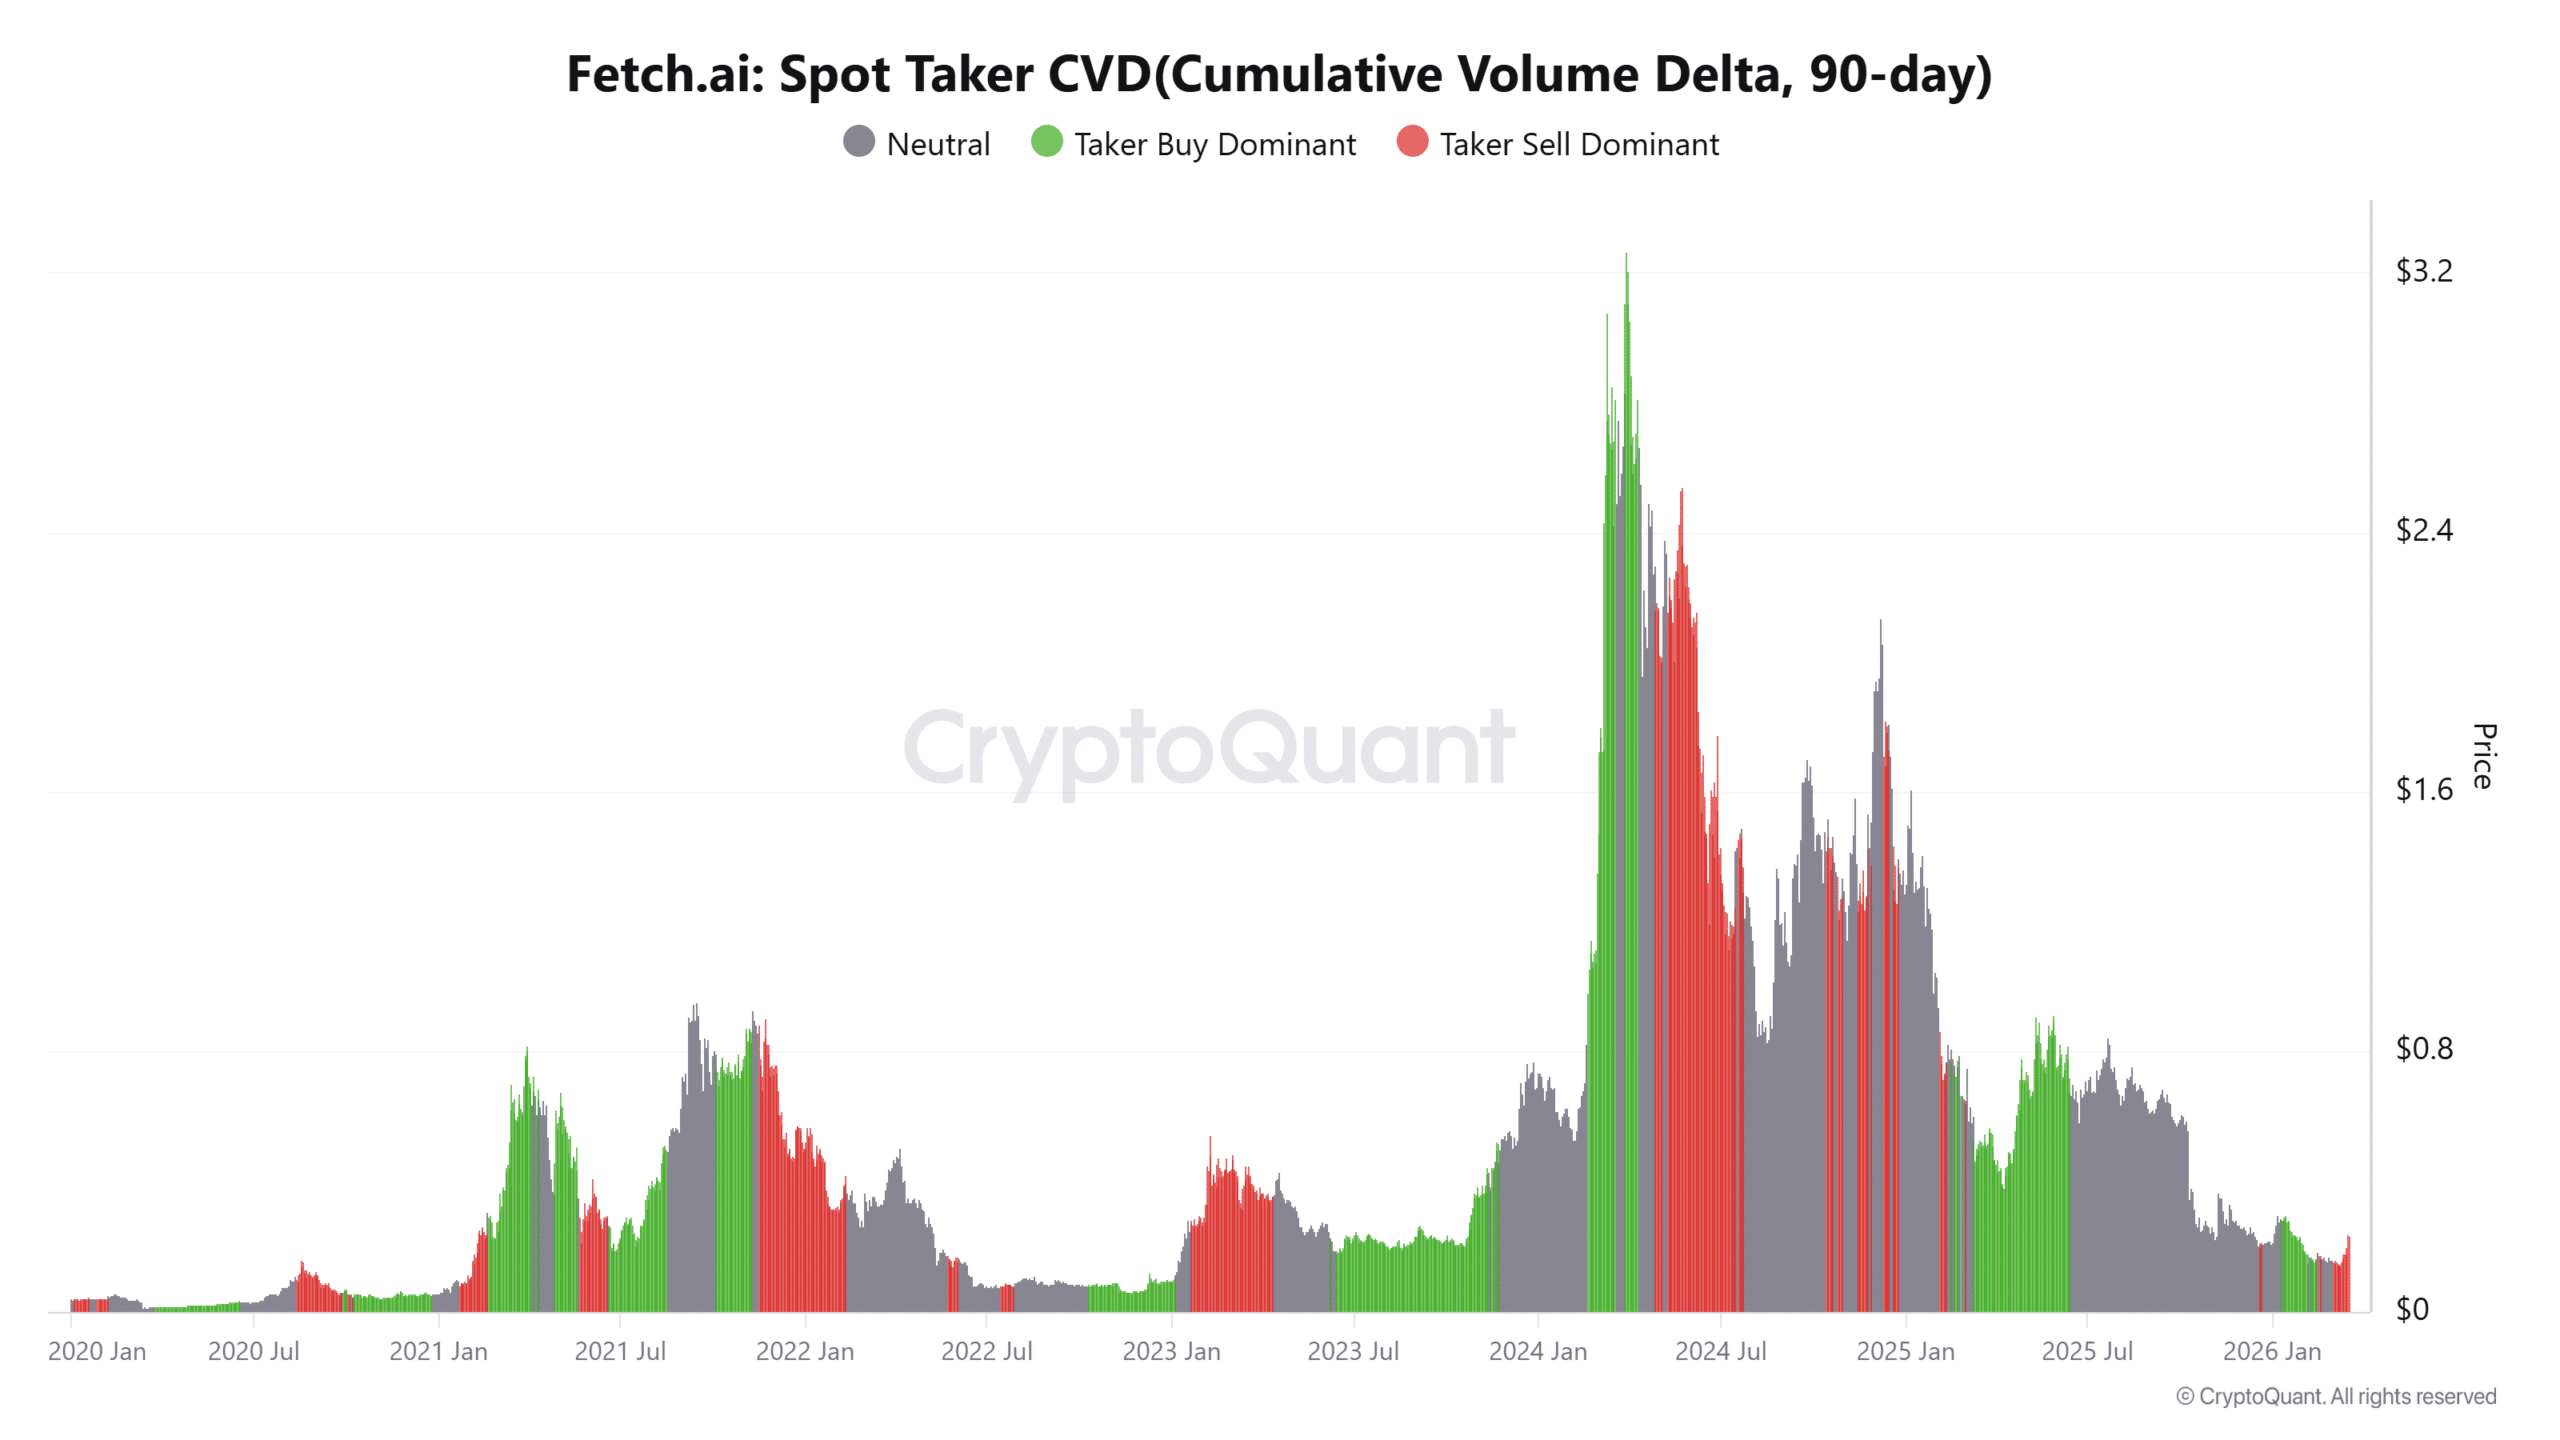
Spot Taker CVD remained sell-dominant as of writing, indicating that aggressive market participants continue to execute sell orders even as the price rises.

This divergence highlights strong buyer absorption, where demand offsets persistent selling pressure. However, such conditions typically signal fragile rallies, as upward movement relies on continuous absorption rather than clear dominance from buyers.

If selling pressure intensifies further, it could slow or cap price progression near resistance levels. At the same time, sustained absorption could support gradual continuation if buyers maintain control.

The current structure reflects a contested market environment in which both sides actively influence the short-term direction.

Source: CryptoQuant

Can FET sustain this breakout?

FET’s recovery demonstrates structural strength through price action and indicator alignment, yet persistent selling pressure and rising exchange reserves pose clear risks.

The rally could extend if buyers continue absorbing supply and maintain higher lows.

However, sustained selling activity suggests that upside progress may face resistance, making continuation dependent on consistent demand strength.


Final Summary

  • FET’s recovery reflects strong absorption, yet persistent selling pressure could gradually weaken upside continuation potential.
  • Sustained buyer control would support higher levels, but rising supply introduces pressure that may limit aggressive expansion.

Related Questions

QWhat was the percentage increase in FET's price and trading volume as mentioned in the article?

AFET's price jumped by more than 20% and its volume spiked by more than 106%.

QWhat critical resistance level is FET approaching, and what has happened at this level historically?

AFET is approaching the $0.25 resistance level, a zone where prior price rejections have occurred.

QWhat does the 16.9% increase in Exchange Reserve USD indicate for FET's price action?

AThe 16.9% increase in Exchange Reserve USD, reaching ~$92.49M, indicates more tokens are being moved to exchanges, introducing additional sell-side supply that could create overhead pressure during price rallies.

QDespite the price rally, what does the spot Taker data show about market participant activity?

ASpot Taker CVD remained sell-dominant, indicating that aggressive market participants continued to execute sell orders even as the price rose.

QWhat two technical indicators are mentioned as aligning with the formation of a rounded bottom and a bullish structure?

AThe MACD crossing above the signal line with a positive histogram and the Parabolic SAR dots crossing below the price are the indicators confirming the transition to a bullish structure and the rounded bottom formation.

Related Reads

I Built Myself an Investment Workbench Using AI

For the past two weeks, I've been immersed in Vibe Coding—using AI to write code from natural language descriptions. This process has enabled me to quickly build functional tools that address long-standing personal ideas. Previously, I had many concepts but found execution too cumbersome. Key ideas included a unified dashboard for assets across US stocks, Crypto, HK stocks, and A-shares; a real-time alert system for price movements; an investment map visualizing sector relationships; and a tool to correlate prediction market bets with news and market data. Traditional development hurdles meant these often remained unrealized. Using AI (Codex, Claude Code, and DeepSeek API), I built four initial tools: 1. A **Cross-Market Asset Dashboard** showing total assets, daily P&L, and holdings by market, with added features for alerts and sector mapping. It's deployed locally for privacy. 2. A **Prediction Market (PM) Monitor** tracking bets on events (e.g., company valuations) and correlating probability shifts with news and market movements. I categorize bets by conviction to filter noise. 3. A **Simple Operations Backend** for managing my writing workflow (topics, progress, publishing). It's cloud-deployed for mobile access. 4. A **One-Click Formatting Tool** that automates converting drafts into various platform-specific formats, saving manual effort. While these tools are basic, they represent a significant shift: AI lowers the barrier to creating personalized systems. I believe individual investors can now feasibly build core systems for: * **Asset Observation** (tracking holdings and changes) * **Signal Monitoring** (watching for key market shifts) * **Sector Mapping** (understanding network relationships within a sector) * **Performance Review** (documenting rationale and outcomes) The power of Vibe Coding is its fast feedback loop. Ideas can be implemented, tested, and iterated on rapidly, turning "want-to-do" into "done." This marks the start of my new phase, where I'll share investment thoughts, tool tests, on-chain operations, and educational Web3 content.

marsbit3m ago

I Built Myself an Investment Workbench Using AI

marsbit3m ago

After Tokenization of Assets, How to Exit?

Title: How to Exit After Asset Tokenization? Author: Symbiotic Compiled by: Hu Tao, ChainCatcher Summary: Tokenization addresses how assets go on-chain but largely leaves the redemption question unresolved. While tokenized assets can settle instantly, the underlying redemption for assets like treasuries, private credit, or real estate can take from T+1 to 180 days. This gap hinders DeFi adoption of Real World Assets (RWAs). Three emerging models aim to provide instant exit liquidity, differing primarily in their capital structure and efficiency: 1. **Balance Sheet Model (e.g., Grove Basin):** A single entity (like Sky) provides immediate liquidity from its balance sheet, acting as a bridge during the settlement period. It offers simplicity and deep initial liquidity but is constrained by a single entity's capacity and risk appetite. 2. **Asset-Specific Vault Model (e.g., Upshift Clear):** Independent liquidity providers fund dedicated vaults for each supported asset, earning fees. It decentralizes capital sources but isolates liquidity and capital per asset, leading to potential fragmentation. 3. **Shared Liquidity Layer Model (e.g., Symbiotic Liquid Lane):** A shared capital pool supports multiple RWA types simultaneously. Funds remain productive between redemptions (e.g., earning yield in lending markets). Exits are settled via a competitive RFQ market. This model aims for higher capital efficiency, scalability across assets, and serves longer-duration assets like private credit. Key differentiators are: 1) Source of capital and risk bearer, 2) Redemption pricing mechanism, 3) Capital efficiency, 4) Scalability to new asset types, and 5) Composability. The shared liquidity layer model represents a move from piecemeal solutions toward scalable infrastructure, enabling T+0 exits by pooling capital, maintaining yield, and using competitive pricing, thus enhancing RWA utility in DeFi.

marsbit16m ago

After Tokenization of Assets, How to Exit?

marsbit16m ago

After Tokenizing Assets, How to Exit?

After tokenization, a key unresolved issue is providing holders with a reliable exit mechanism, as underlying asset settlement (taking days to months) lags far behind on-chain token settlement. Three primary models for instant liquidity have emerged, differing in their capital structure and efficiency: 1. **Balance Sheet Model (e.g., Grove Basin):** A single, well-capitalized entity (like Sky) provides immediate liquidity from its own reserves. This offers simplicity and deep initial liquidity but is constrained by that single balance sheet's capacity and risk appetite, limiting scalability. 2. **Dedicated Vault Model (e.g., Upshift Clear):** Independent liquidity providers (LPs) fund separate vaults for each supported asset. This decentralizes capital sources but isolates liquidity and capital, which becomes inefficient as the number of tokenized assets grows. 3. **Shared Liquidity Layer Model (Symbiotic Liquid Lane):** Independent capital providers fund shared vaults that can support multiple tokenized assets simultaneously. Capital remains productive between redemptions (e.g., earning yield in DeFi markets). Exits are settled via a competitive RFQ market where market makers bid. The article argues that the shared layer model offers superior capital efficiency and scalability. It transforms exit liquidity from an asset-specific patch into shared market infrastructure, allowing liquidity capacity to grow with overall market participation rather than being fragmented per asset. This is particularly valuable for longer-duration assets like private credit, where reliable T+0 exits can significantly enhance their utility in DeFi.

链捕手30m ago

After Tokenizing Assets, How to Exit?

链捕手30m ago

Anthropic's Triple Moment: Code Leak, Government Confrontation, and Weaponization

This article analyzes Anthropic's recent conflicts and strategic moves following the U.S. government's emergency halt of its new Fable model, citing national security concerns over potential "jailbreaks." The author argues this incident reveals deeper tensions between AI labs, governments, and the software industry. While critics view Anthropic's safety-focused rhetoric as marketing fear, the author suggests it serves as a commercial moat masking the company's core economic imperative: moving closer to end-users and their valuable data to avoid being commoditized. The piece outlines a coming clash between frontier AI labs like Anthropic and established software companies. Labs need real-world usage data for model improvement via reinforcement learning, creating a cycle where better products attract more users and more data. This threatens software firms who, as Microsoft's Satya Nadella warns, risk having their value captured by a few dominant models. Anthropic's controversial policy changes—initially secretly degrading Fable's performance for LLM development and expanding data retention—are framed as assertions of control, justified by its safety narrative. The company's foundational belief that it alone is sufficiently concerned about superintelligent AI dangers legitimizes its actions, from resisting government demands to shaping usage policies. The author concludes that this alignment of mission, talent, and business strategy is powerful but concerning, as it concentrates immense potential power in the hands of those convinced of their own righteous understanding.

marsbit40m ago

Anthropic's Triple Moment: Code Leak, Government Confrontation, and Weaponization

marsbit40m ago

Trading

Spot
Futures

Hot Articles

Discussions

Welcome to the HTX Community. Here, you can stay informed about the latest platform developments and gain access to professional market insights. Users' opinions on the price of S (S) are presented below.

活动图片