Unicorn Report: Within an Hour's Drive of the Bay Area, 90% of the World's AI Market Value is Concentrated

marsbitPublished on 2026-04-23Last updated on 2026-04-23

Abstract

The 2025 Unicorn Report by Elad Gil reveals a dramatic concentration of AI unicorn value in the San Francisco Bay Area, which now holds 91% of the global generative AI unicorn market capitalization within a one-hour drive radius. The U.S. dominates globally with 65% of all unicorn value, a significant increase from previous years. While the rate of new unicorn creation has slowed post-2022, the average valuation of existing unicorns has reached a six-year high, driven overwhelmingly by AI companies. Generative AI unicorns saw an average valuation increase of $2.2 billion, far outpacing non-AI unicorns. The data indicates a powerful clustering effect, with the Bay Area solidifying its position as the world's premier AI hub, while other U.S. cities like New York and Los Angeles specialize in fintech/crypto and aerospace/defense, respectively.

Author: Elad Gil (Data Analysis: Shreyan Jain)

Compiled by: Deep Tide TechFlow

Deep Tide Guide: Elad Gil's team has been tracking the distribution of global unicorn market value for six consecutive years. The 2025 data points to a clear conclusion: the San Francisco Bay Area is becoming a supercluster for generative AI, with 91% of the world's AI unicorn market value concentrated within a one-hour drive. Meanwhile, the birth rate of new unicorns is slowing, but the average valuation of existing unicorns has hit a six-year high. This report uses hard data to reveal that the global startup ecosystem's center of power is accelerating its tilt towards the United States and the Bay Area.

All data is as of December 31 of the respective year. "2025" below refers to the market value as of December 31, 2025 / January 1, 2026.

Over the past two years, we have experienced a market correction in the post-zero interest rate era, the explosive rise of frontier AI labs like OpenAI and Anthropic, and ongoing debates about the "AI bubble." The data shows that the San Francisco Bay Area has evolved into an AI supercluster, with 91% of the world's private AI market value concentrated within a one-hour drive radius.

Previous analyses can be referenced: 2019, 2020, 2021, 2023.

Key Findings

  1. Generative AI has turned the Bay Area into a supercluster. The Bay Area now accounts for about 39% of global unicorn market value, more than 4 times that of the second-ranked city. A year ago, this figure was only 29%. Looking solely at generative AI unicorns, the Bay Area's share is as high as 91%.
  2. Absolute dominance of US unicorns. The US added nearly $1.2 trillion in unicorn market value over the past year, accounting for about 65% of the global total. Europe has surpassed China in market value share but still only holds around 10%.
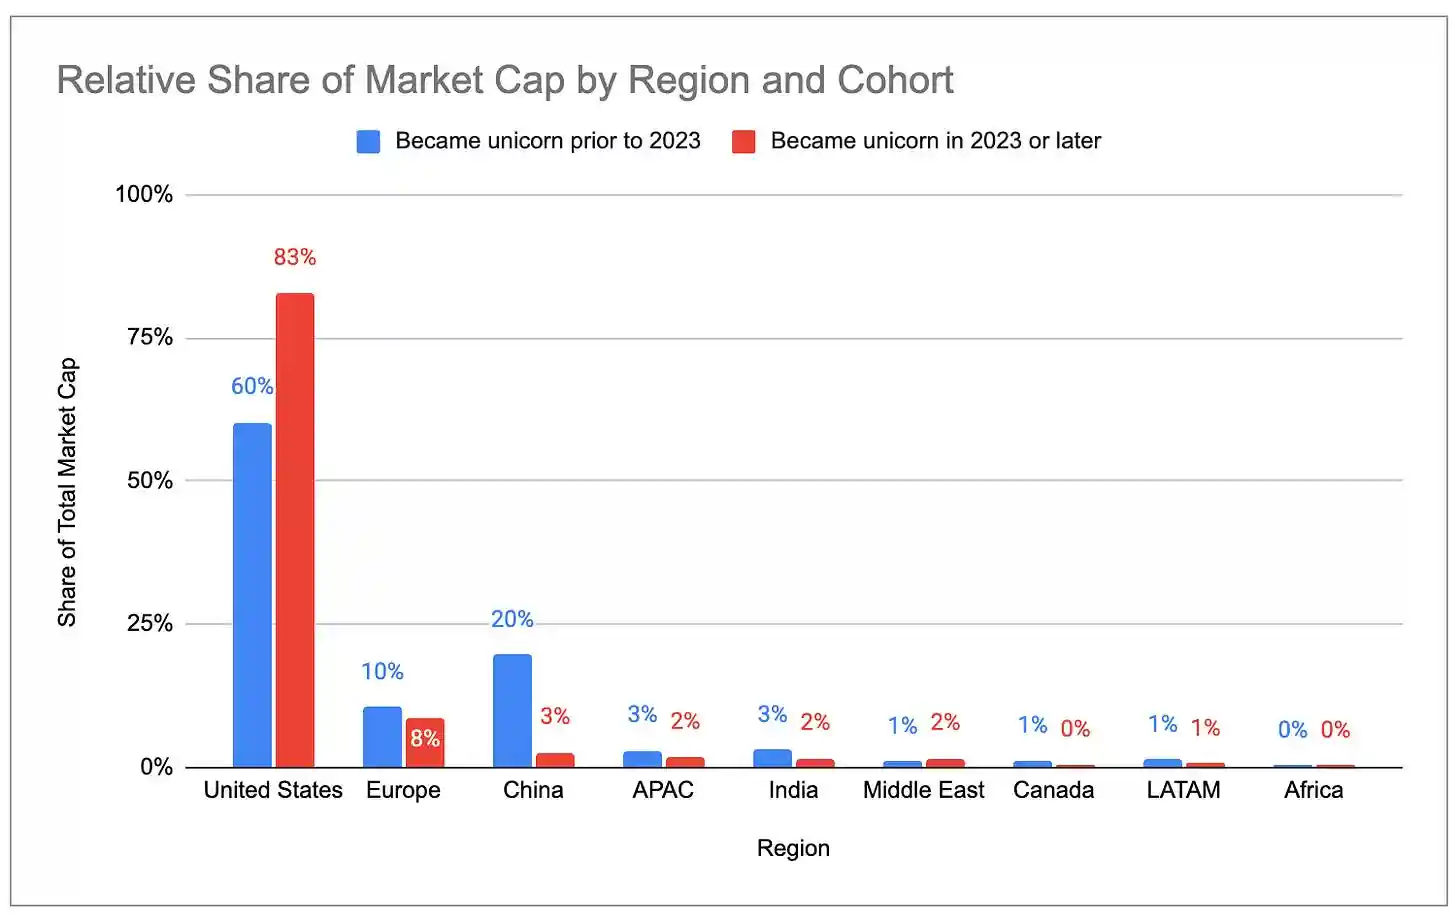
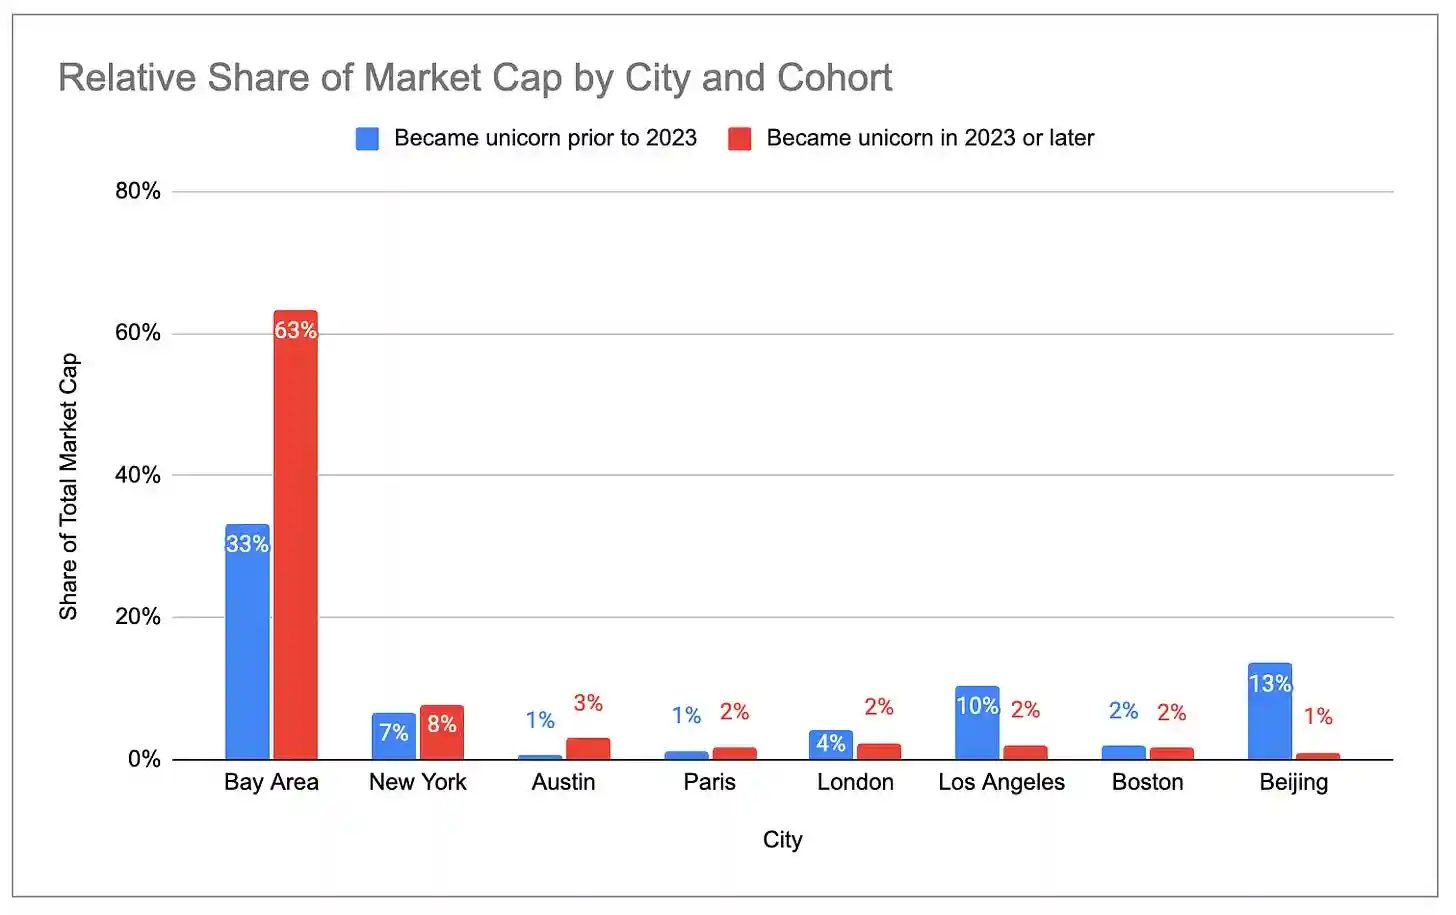
  3. Newer unicorns are more concentrated in the US and the Bay Area. Among unicorns born in 2023 and later, the US accounts for 83% of the total market value, compared to only 60% for those born in 2022 and earlier. The Bay Area's share is even more dramatic: 63% for the new generation vs. 33% for the old generation.
  4. The birth rate of new unicorns is slowing down. Only about 300 new unicorns were added between 2022 and 2025, compared to over 900 in the previous three years.
  5. But existing unicorns are more valuable than ever. The total number of unicorns increased by only 6% year-on-year, but the total market value grew by 33%. The average market value per unicorn reached its highest level in six years.
  6. Valuation growth is primarily driven by AI companies. In 2025, the valuation of generative AI unicorns grew by an average of about $2.2 billion year-on-year, compared to only about $400 million for non-AI unicorns. The share of generative AI in the global unicorn market value surged from 2% in 2024 to 22%. The concentration in the Bay Area will only continue to increase.
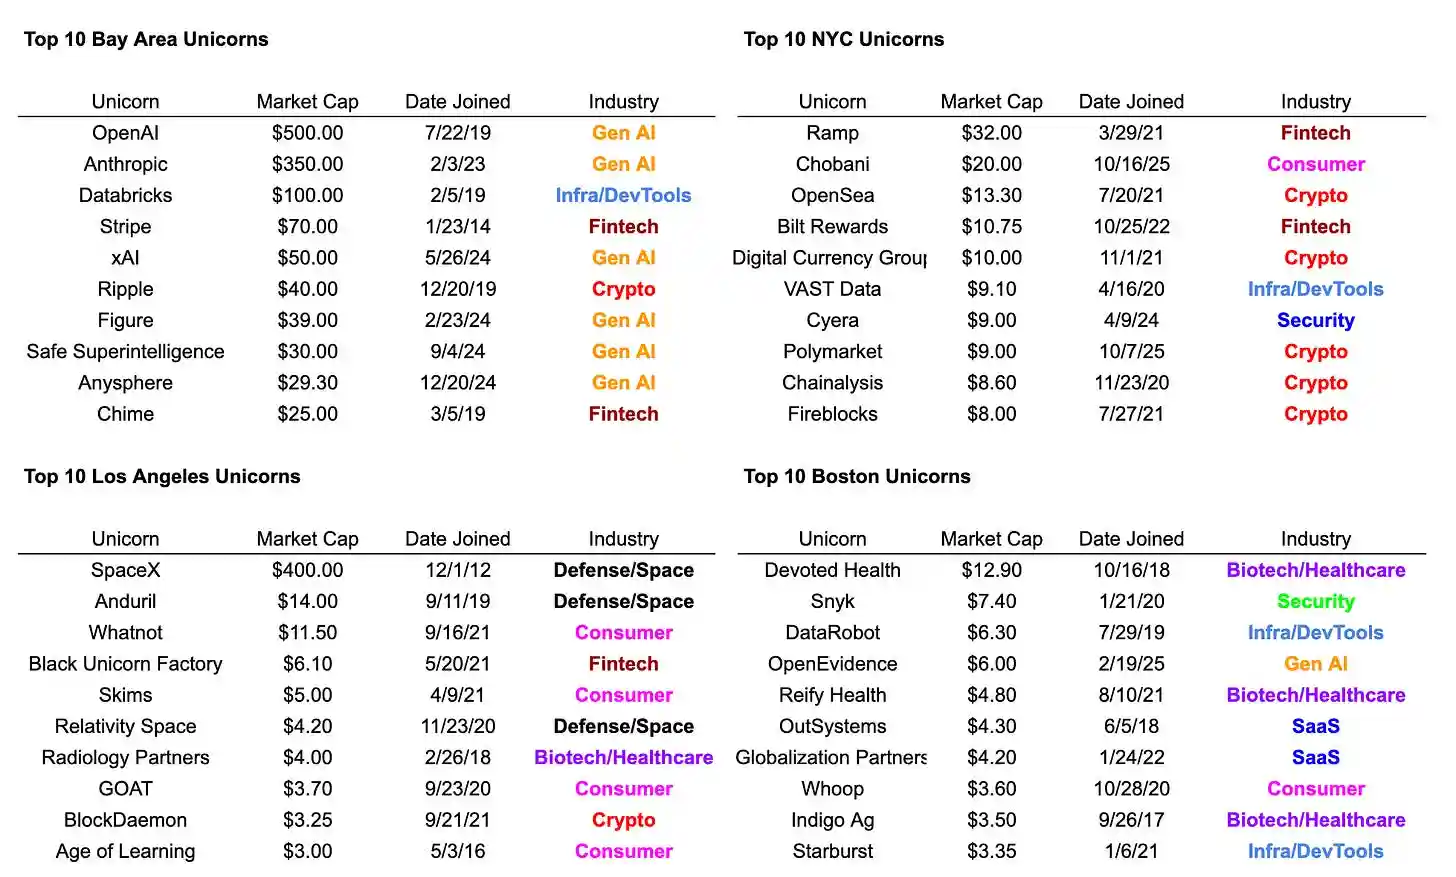
  7. Unicorn hubs cluster around specific industries. 6 of the Bay Area's top 10 unicorns are AI companies; 7 of New York's top 10 are fintech/crypto companies; 3 of Los Angeles' top 5 are defense/space companies (SpaceX, Anduril, Relativity, accounting for 83% of LA's total market value), and its top 10 includes 4 consumer companies.

Data Notes

All raw data comes from CB Insights, viewable here. A few points to note:

There is a lag in updating private financing rounds in public datasets; some unicorn valuations may not be the latest. For example, the latest funding rounds for Anduril, Stripe, and SpaceX are not reflected in the data.

Unicorn market value is, at best, a rough, lagging proxy indicator of startup ecosystem activity, and there are inevitable errors in mapping companies to valuations, cities, and industries. But we believe the data is accurate in its broad direction.

Unicorn Concentration

The geographical concentration of global unicorn market value is at an all-time high. The US accounts for 65% of all unicorn market value, up from 58% a year ago and 44% in 2020. The US share is about 4 times that of China, the second-ranked country.
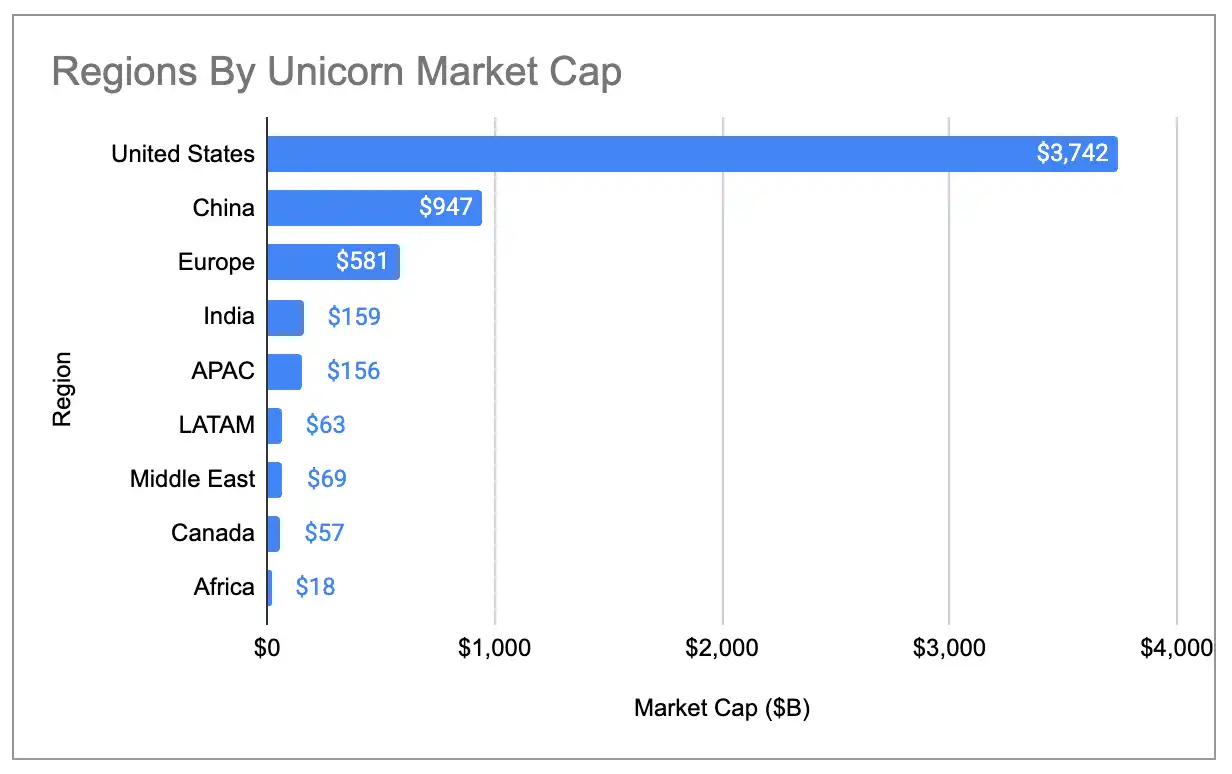
Caption: Global share of unicorn market value by country (including three outliers)

The Bay Area's unicorn market value is more than 4 times that of the second-ranked city, with its global share growing from 29% in 2024 to 39%:
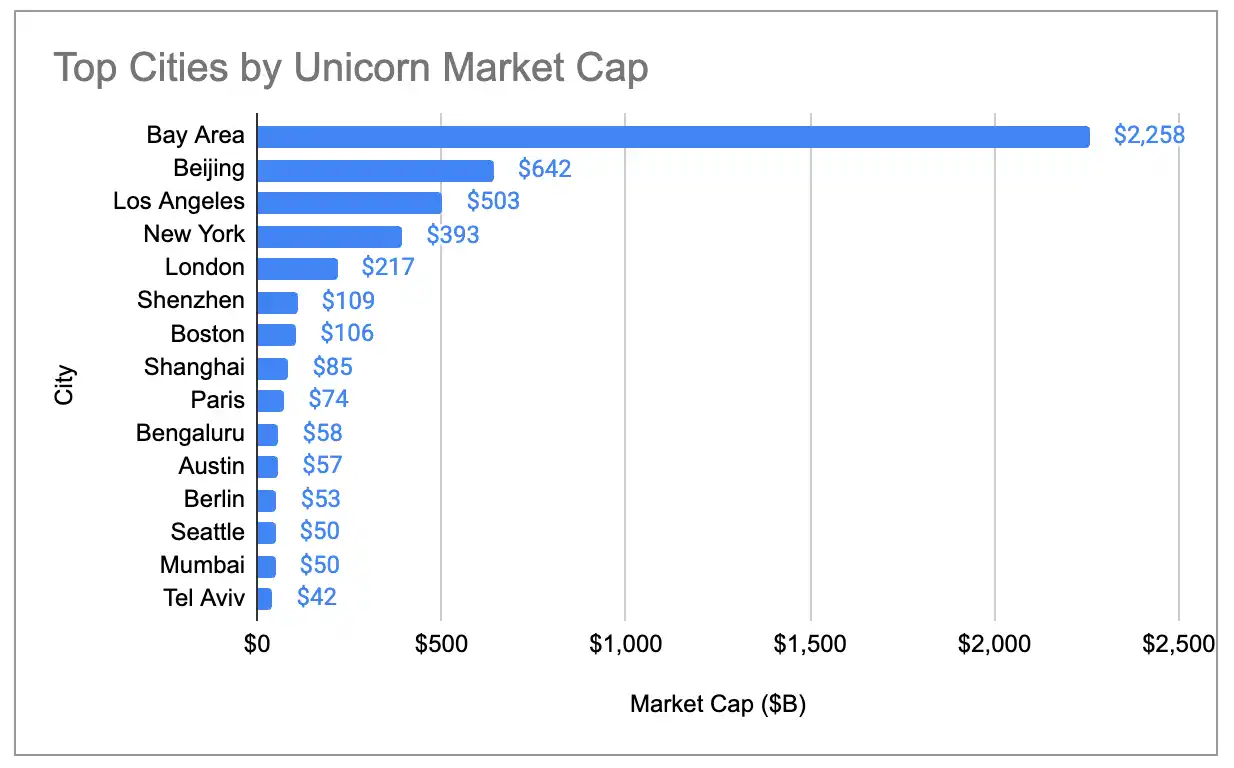
Caption: Global share of unicorn market value by city (including three outliers)

Even after removing the three largest outliers—OpenAI ($500B), SpaceX ($400B), and ByteDance ($300B)—the major ecosystems have continued to concentrate since 2019. The US share has steadily risen, while China's has steadily declined. Europe's total unicorn market value surpassed China's in 2024, and New York and London have also overtaken Beijing.
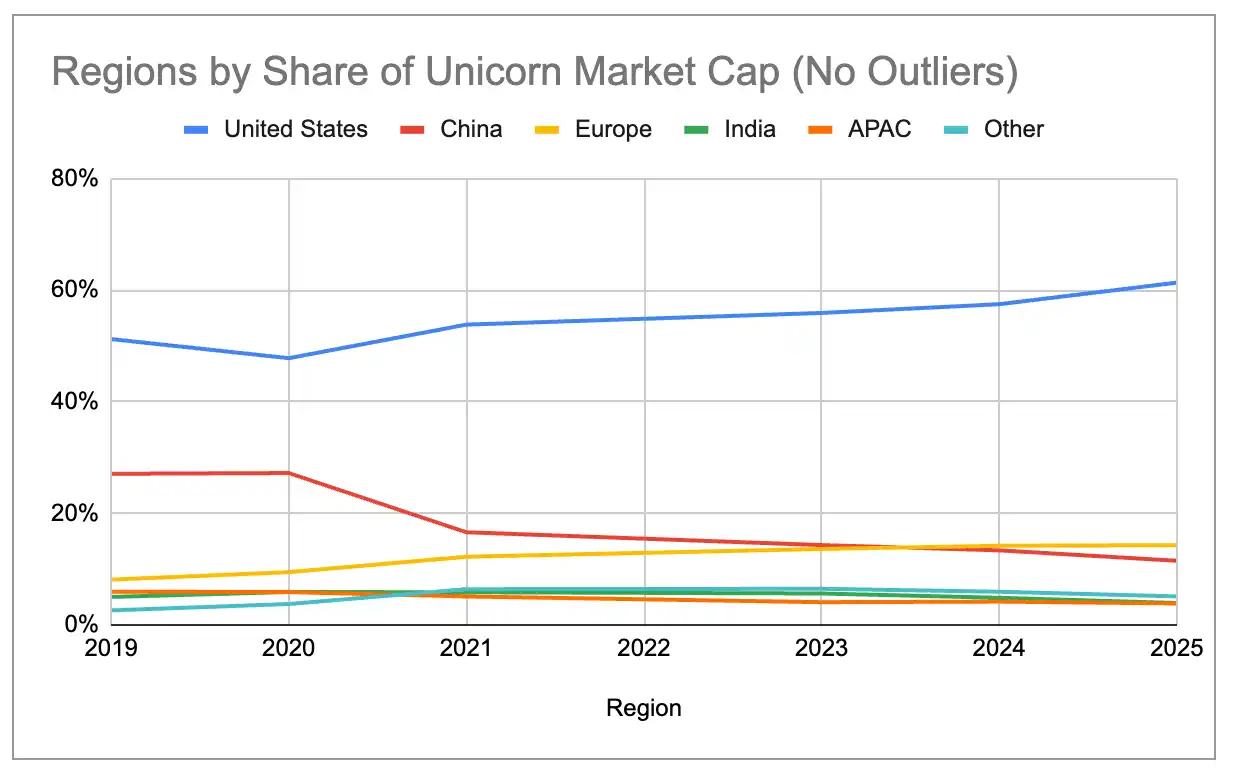
Caption: Global share of unicorn market value by country (excluding three outliers)
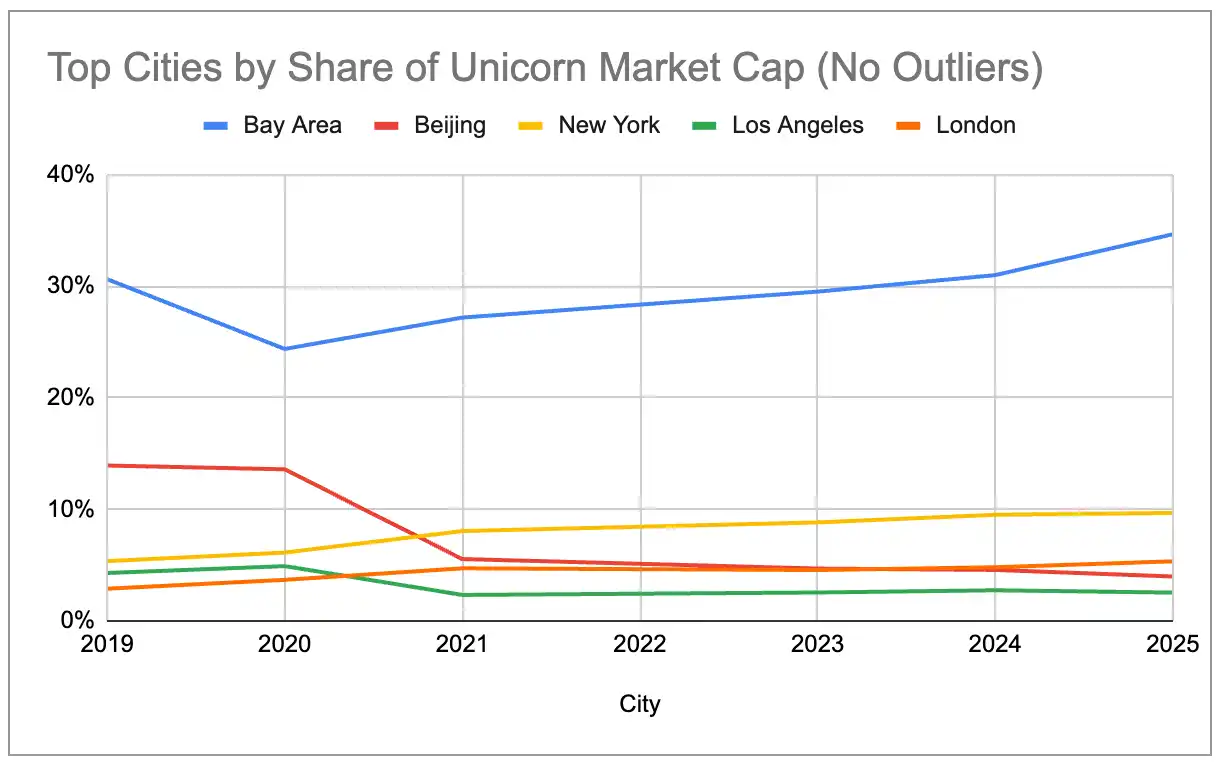
Caption: Global share of unicorn market value by city (excluding three outliers)

Super Concentration of Generative AI

Looking solely at the 97 unicorns whose core revenue comes from generative AI products/services, the cluster effect in the Bay Area is even more extreme. The Bay Area holds 91% of the global AI unicorn market value, with no other city exceeding 2%.
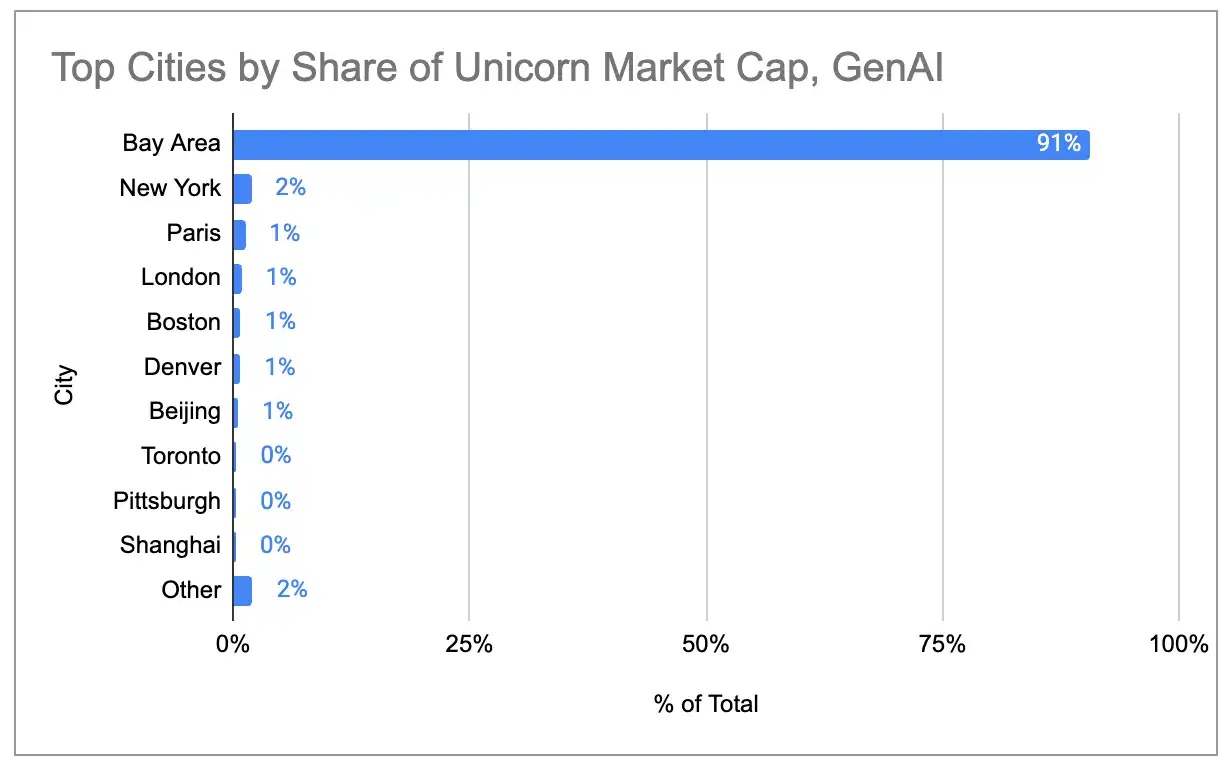
Caption: City distribution of generative AI unicorn market value

The total market value of generative AI unicorns has grown exponentially, with almost all the增量 coming from the US, especially the Bay Area.
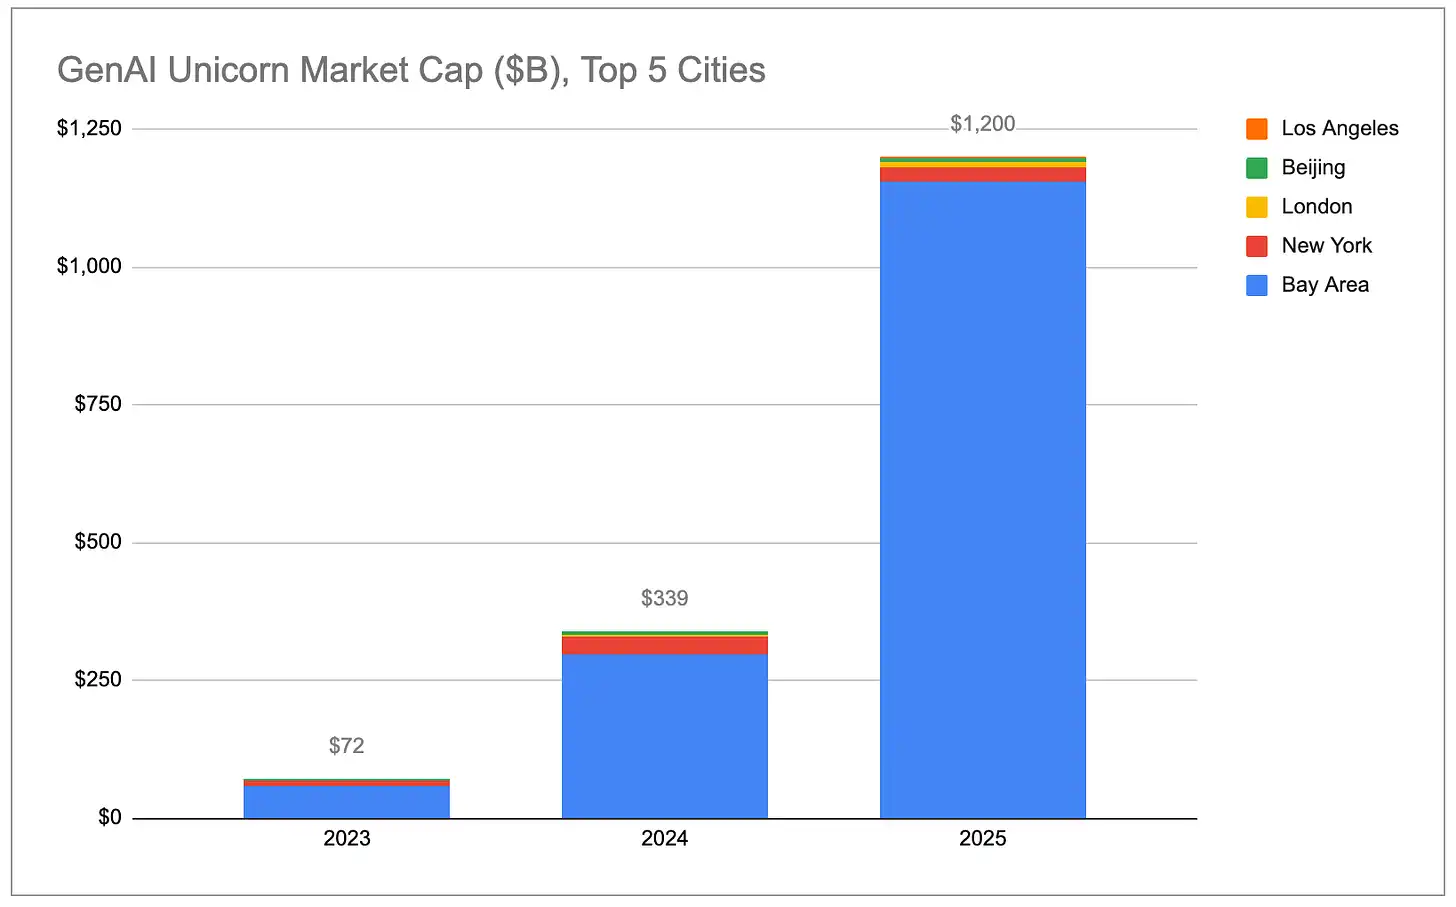
Caption: Total market value of generative AI unicorns (by country)

Caption: Total market value of generative AI unicorns (by city)

AI unicorn valuation growth far outpaces non-AI unicorns. The 48 AI companies that were unicorns throughout 2025 saw their total market value grow by $778 billion during the year. This figure exceeds the combined market value increase of the remaining 1100+ non-AI unicorns. Even excluding OpenAI (~$343B increase) and Anthropic (~$334B increase), the average year-on-year valuation growth for generative AI unicorns was about $2.2 billion, 5 times the average growth of non-AI unicorns (~$440 million).

Caption: Market value growth comparison: AI unicorns vs. non-AI unicorns

In relative terms, generative AI companies grew from 2% of the global unicorn market value in 2023 to 22%. If this trend continues, the Bay Area's share of the global unicorn market value will continue to expand, thanks to its de facto monopoly on top AI companies and talent.
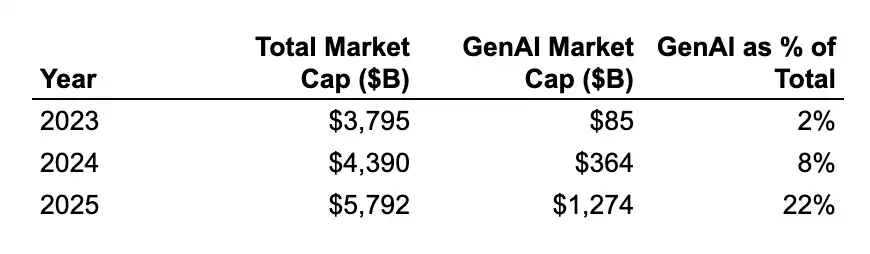
Caption: Change in the proportion of generative AI in total unicorn market value

(Note: We only classify companies whose primary revenue comes directly from generative AI as "generative AI." A full list of companies can be viewed here. We included chip/hardware companies like Cerebras and TensTorrent, and infrastructure companies like CoreWeave and Crusoe, but did not include data infrastructure companies like Databricks that more broadly support AI/ML workloads, nor robotics/defense companies like Anduril that use AI/ML for autonomous systems.)

New Unicorns

Caption: Number of new unicorns per year

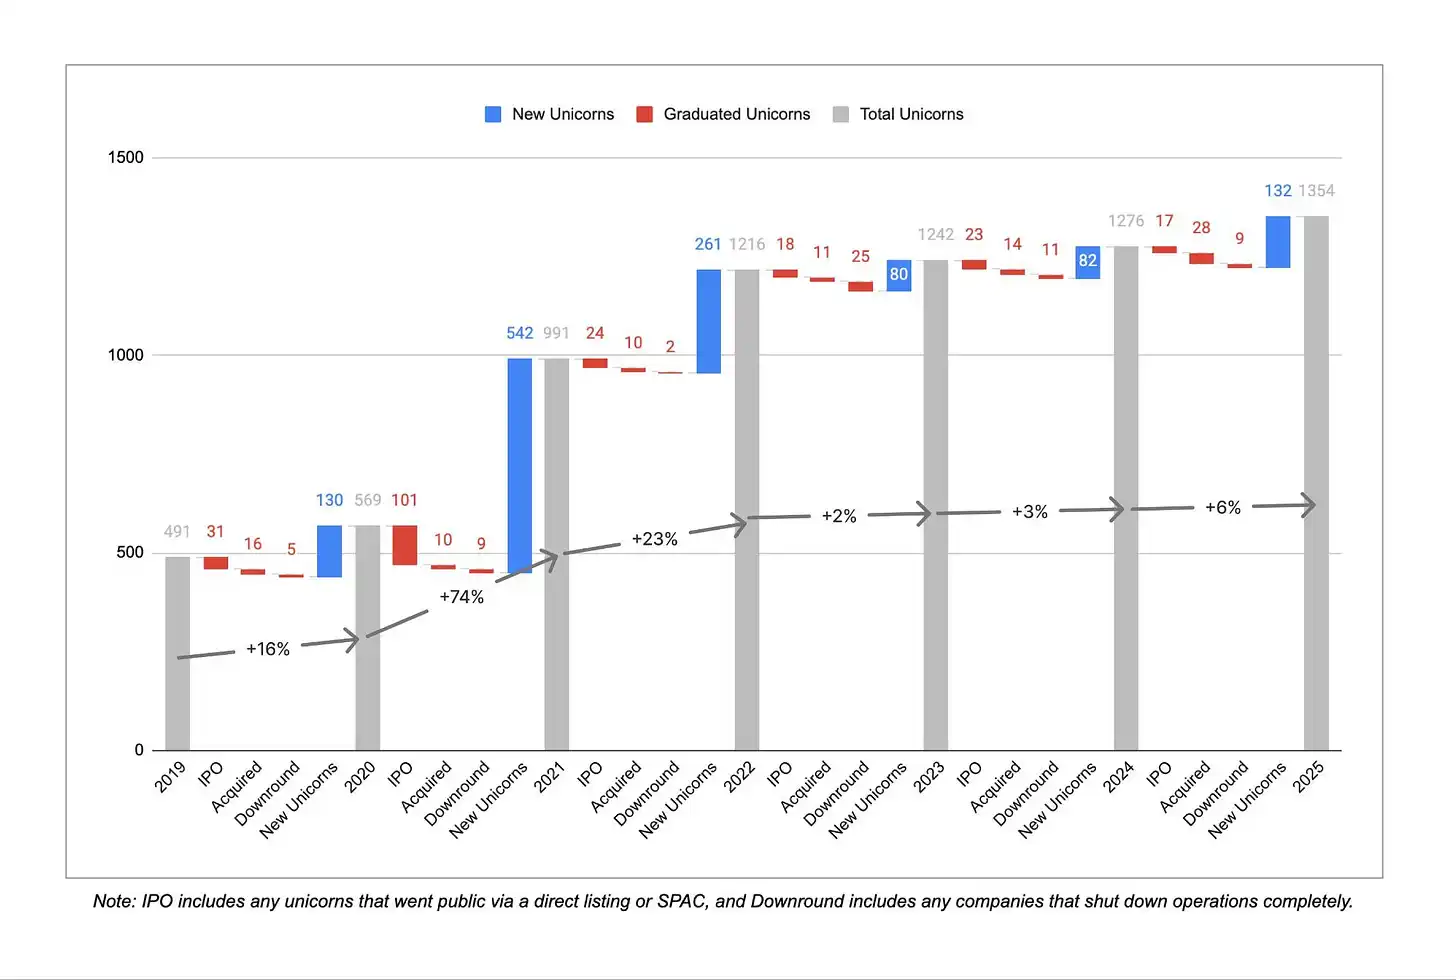
After three years of high growth, the birth rate of new unicorns has slowed significantly over the past three years. Between December 2019 and December 2022, an average of over 300 companies became unicorns for the first time each year. From December 2022 to December 2025, this number dropped to about 100 per year, although 2025 saw a rebound compared to the previous two years.同时, over the past three years, 45 companies lost their unicorn status due to valuation markdowns or shutdowns, compared to only 16 in the previous three years, indicating that the correction of inflated valuations from the 2021/2022 zero-interest rate era is ongoing.

Caption: Trend of unicorn count vs. total market value

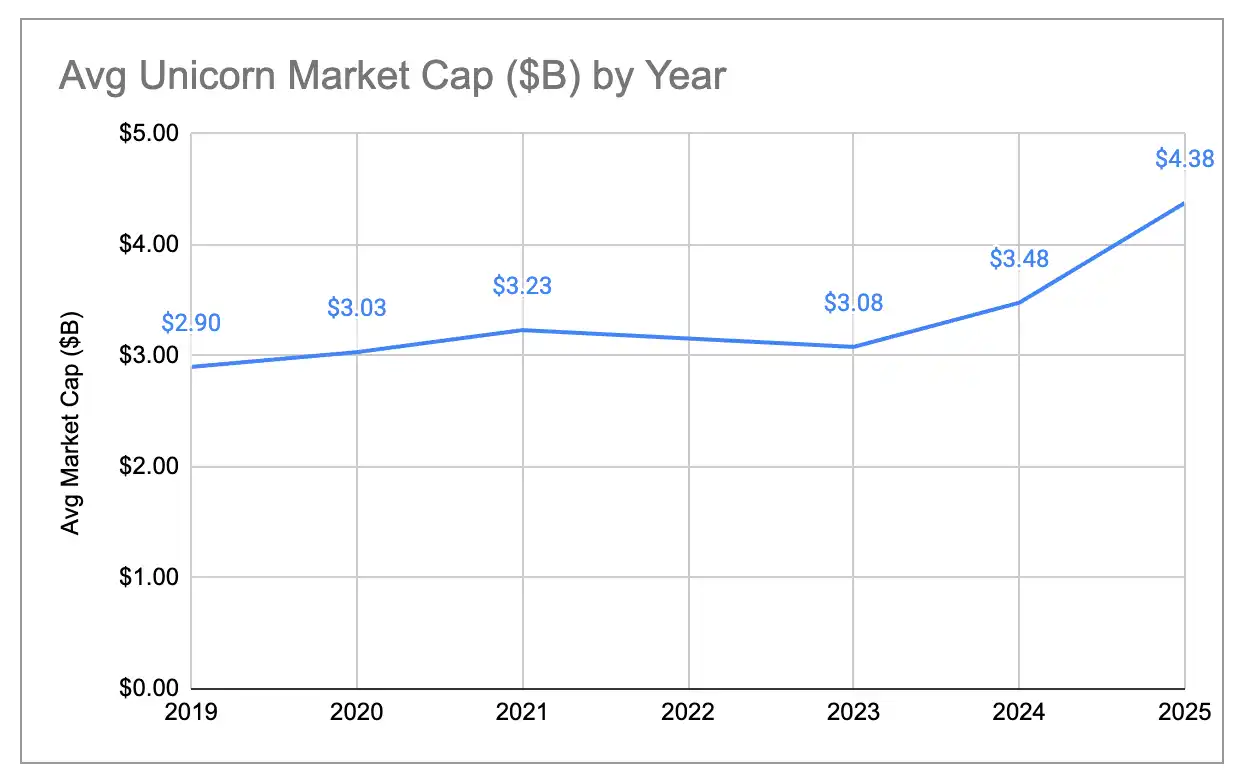
Although the number of unicorns has remained largely flat, the total market value has grown significantly. Over the past year, the global unicorn total market value grew from about $4.4 trillion to about $5.8 trillion, an increase of 33%. This is a strong rebound, especially relative to 2023 when the total market value actually shrank year-on-year. Historically, market value growth was driven more by new companies becoming unicorns, but in 2025, about 80% of the market value growth came from valuation increases of existing unicorns. The result is that the average market value per unicorn rose from about $3 billion to about $4.4 billion, the highest value in the six years we have been doing this analysis. It has become harder to become a unicorn, but once past the $1 billion threshold, these companies are, on average, more valuable and growing faster.

Caption: Trend in average unicorn market value

New Generation vs. Old Generation Unicorns

One way to剔除 the influence of inflated valuations from the zero-interest rate era is to look only at unicorns born after 2023. Here is a comparison of the market value distribution between the two batches of unicorns before and after 2023:

Caption: Market value distribution of unicorns born before 2023 (by country/city)

Caption: Market value distribution of unicorns born in 2023 and later (by country/city)

New generation unicorns are more concentrated in the US, with shares declining for Europe and China. Among unicorns added since 2023, the Bay Area accounts for 63% of the market value, compared to only 33% for the older batch of unicorns.

"Zombie" Unicorns

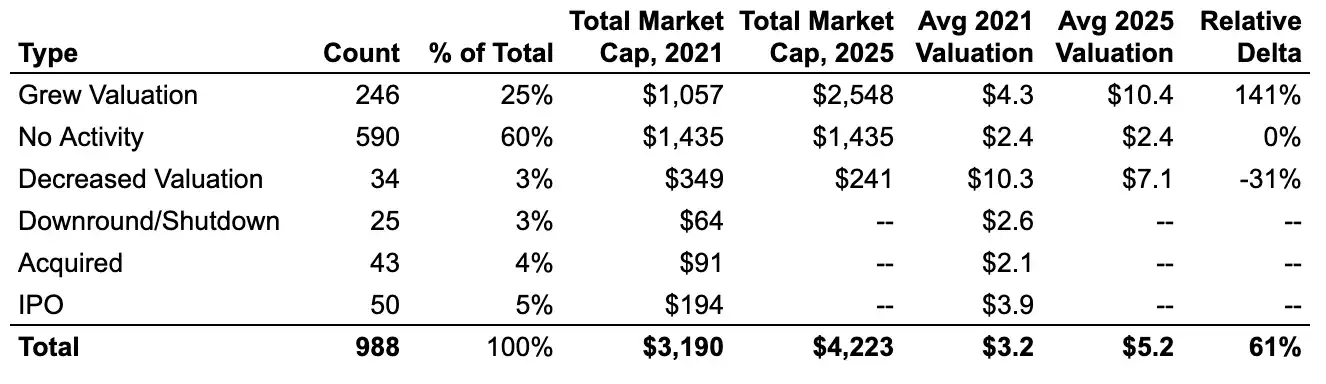
Of the nearly 1000 unicorns in December 2021, about 60% have maintained their unicorn status but have not completed any new funding rounds. These "zombie" unicorns raised enough money during the zero-interest rate era to survive至今 but have been unable to surpass their previous valuations. They collectively account for about $1.4 trillion of the current global unicorn market value, nearly 25% of the global total.

Caption: Proportion of "Zombie" vs. "Active" among 2021 Unicorns

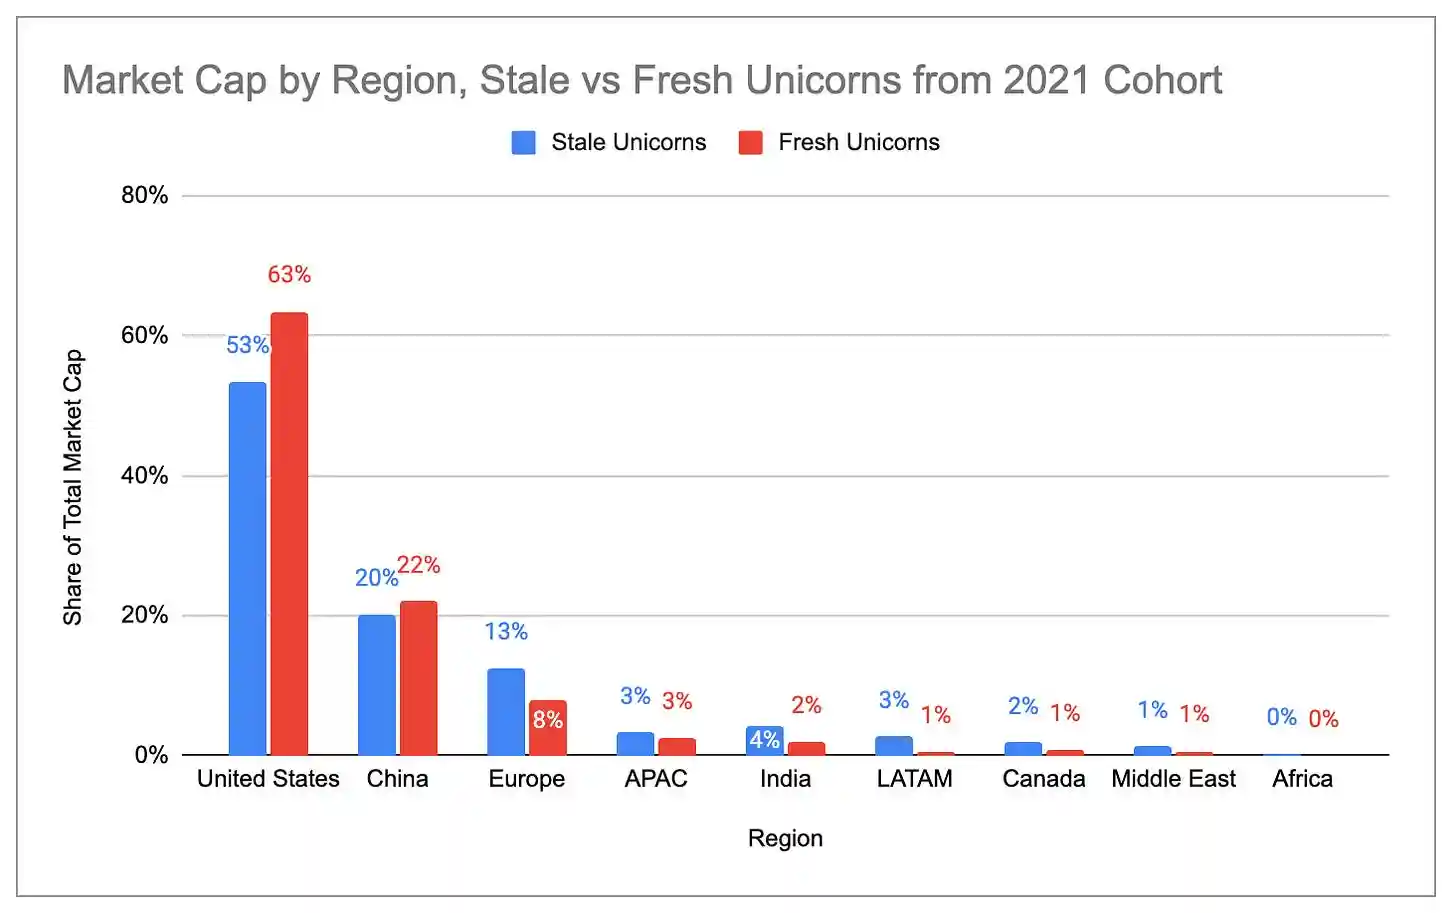
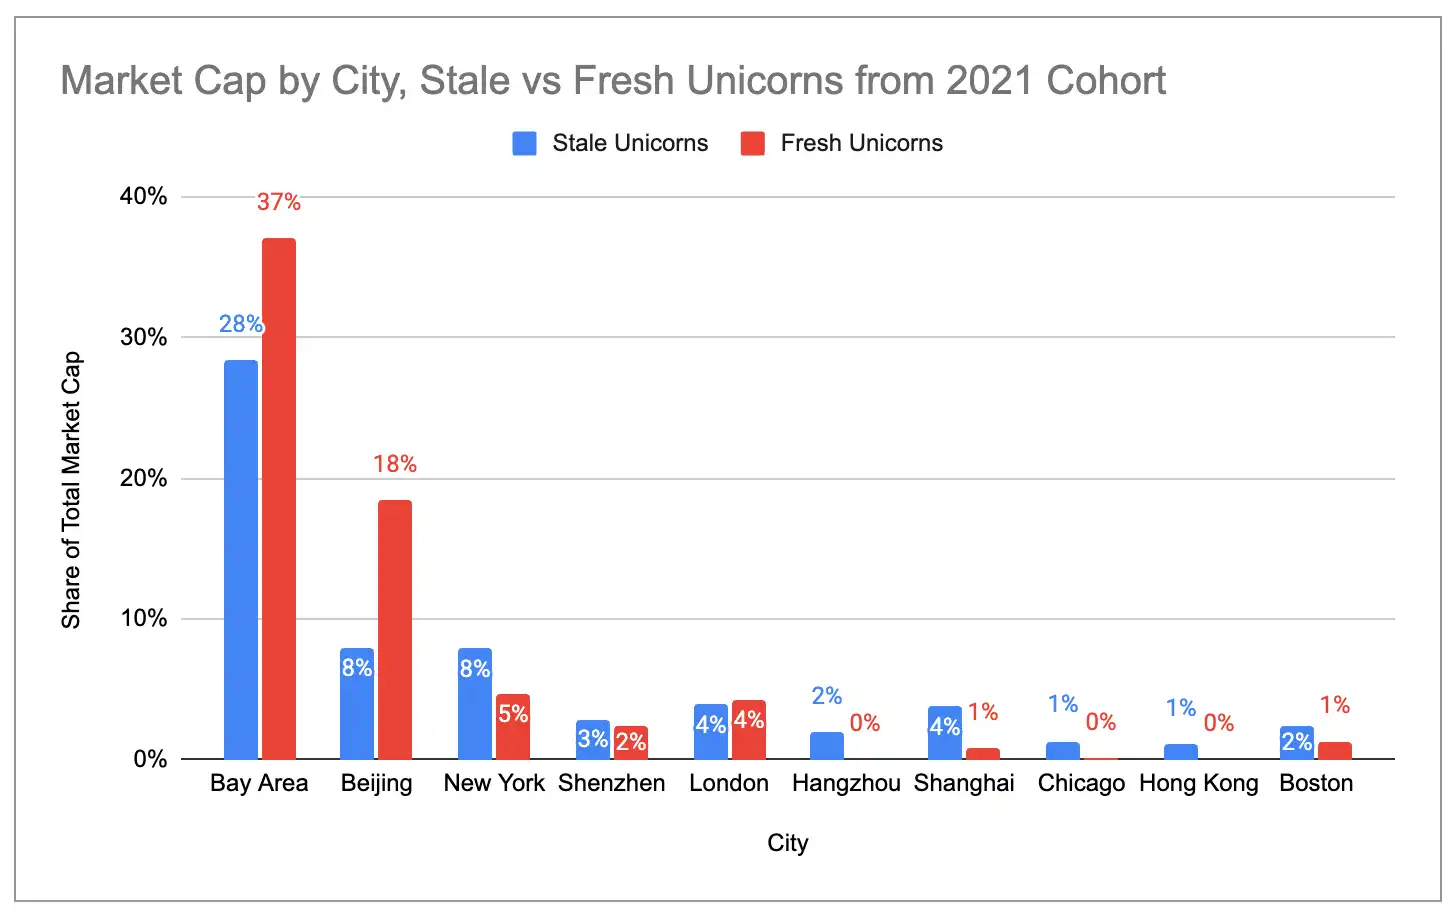
The proportion of "active" unicorns (those that have completed new funding rounds since 2021) in the US and the Bay Area is much higher than that of "zombie" unicorns. In contrast, Europe, India, Latin America, and New York have a higher concentration of "zombie" unicorns.

Caption: Market value distribution of "Zombie" vs. "Active" unicorns by country

Caption: Market value distribution of "Zombie" vs. "Active" unicorns by city

Four Major US Unicorn Clusters

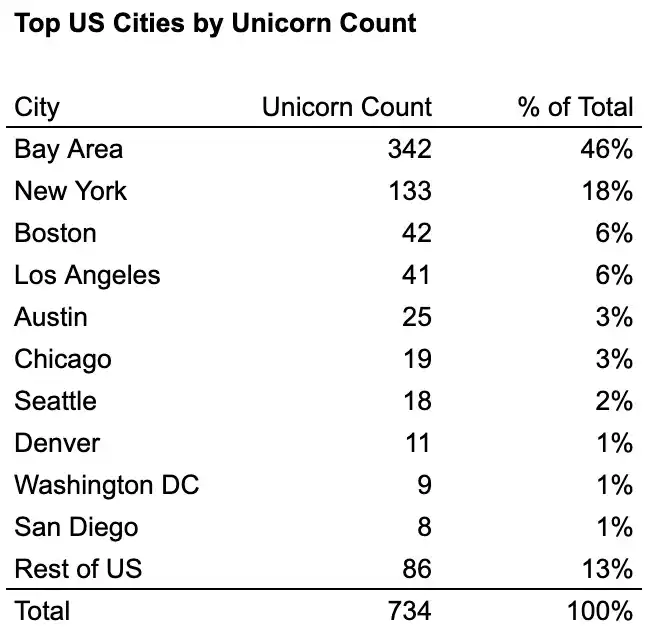
Within the US, four "industry cities" account for about 76% of the unicorn count and about 87% of the unicorn market value: the Bay Area, New York, Los Angeles, and Boston. The Bay Area is the absolute leader, with more than twice the number of unicorns of the second-ranked city and more than four times the market value.

Caption: Number of unicorns in major US cities

Caption: Unicorn market value in major US cities

Looking at the industry distribution of the top 10 unicorns in each city, the clustering effect of industry cities is clear:

  • Bay Area = AI Cluster (6 of the top 10 are generative AI)
  • New York = Fintech/Crypto Cluster (7 of the top 10)
  • Los Angeles = Defense/Space + Consumer Cluster (3 of the top 6 are defense/space, 4 of the top 10 are consumer)
  • Boston = Relatively balanced, but偏向 biotech/healthcare (3 of the top 10)

Caption: Industry distribution of Top 10 unicorns in four major US cities

Trending Cryptos

ctr
CitreaCTR
wstusdt
wrapped stUSDTWSTUSDT
apr
aPrioriAPR
ctx
Cryptex FinanceCTX
audio
AudiusAUDIO
comp
CompoundCOMP
mantra
MantraMANTRA
waxl
AxelarWAXL
bill
Billions NetworkBILL
pyth
PYTH (Pyth)PYTH
rune
THORChainRUNE
velodrome
Velodrome FinanceVELODROME
brev
BrevisBREV
cake
PancakeSwapCAKE
jst
JUSTJST

Related Questions

QAccording to the report, what percentage of the world's generative AI unicorn market value is concentrated within an hour's drive of the San Francisco Bay Area?

A91% of the world's generative AI unicorn market value is concentrated within an hour's drive of the San Francisco Bay Area.

QWhat is the United States' share of the global unicorn market value as of the end of 2025, and how does this compare to the previous year?

AThe United States' share of the global unicorn market value is about 65% as of the end of 2025, which is an increase from 58% the previous year.

QHow has the average valuation of a unicorn company changed, reaching what is described as a six-year high?

AThe average valuation of a unicorn company has risen to approximately $4.4 billion, which is the highest level in the six years the analysis has been conducted.

QWhat major trend is identified regarding the birth rate of new unicorns between 2022-2025 compared to the preceding three-year period?

AThe birth rate of new unicorns has slowed significantly. Only about 300 new unicorns were added between 2022 and 2025, compared to over 900 in the previous three-year period (2019-2022).

QWhich specific industry clusters are identified for the top unicorns in New York and Los Angeles?

AIn New York, the top unicorns form a FinTech/Crypto cluster (7 out of the top 10). In Los Angeles, the top unicorns form a Defense/Aerospace cluster (3 of the top 5) and a Consumer cluster (4 of the top 10).

Related Reads

In Conversation with Ray Dalio: We Are Currently in an AI Bubble, with 1% of My Portfolio in Bitcoin

Ray Dalio, founder of Bridgewater Associates, warns in an interview that the current AI boom shows classic bubble characteristics, which could lead to significant economic downturns as seen in past cycles like 1929 or 2000. He explains that speculative enthusiasm, fueled by debt and overvaluation, often precedes a crash when rising rates or taxation force asset sales, causing widespread losses and recession. Dalio also outlines his "Big Cycle" theory, describing an approximate 80-year pattern where widening wealth gaps, massive government deficits, and shifting geopolitical power (like China's rise) create internal conflict and global instability. He emphasizes that we are in a late-cycle, transitional phase where traditional powers like the US and UK face decline. For personal wealth protection, Dalio advises diversification beyond cash into assets like stocks, bonds, real estate, and particularly gold, which he prefers over Bitcoin. While he holds about 1% of his portfolio in Bitcoin as a non-printable hard asset, he views gold as more secure from technological or governmental threats. Regarding AI's impact, Dalio believes it will disproportionately benefit capital owners, worsening inequality by replacing both physical and cognitive labor. He suggests that human intuition and emotional intelligence, combined with AI, will be key for future workers. On taxation, Dalio argues that wealth taxes are impractical and risk triggering asset sell-offs, reducing productive investment. He points to the UK as a cautionary example of debt, low productivity, and political strife. Geopolitically, Dalio foresees a more regionalized world, with the US showing weakness in prolonged conflicts like with Iran, akin to past imperial declines. The ideal outcome, he suggests, is coexisting powerful blocs (e.g., Americas, China-Asia Pacific) without major war.

marsbit3h ago

In Conversation with Ray Dalio: We Are Currently in an AI Bubble, with 1% of My Portfolio in Bitcoin

marsbit3h ago

Daily 7.2 Trillion KRW: Foreign Capital's Record Net Buying on Friday! Wall Street Says Headwinds for Korean Stock Fund Flows Have Subsided

South Korean stock market sees a dramatic shift in fund flows. On July 31, foreign investors made a record net purchase of approximately KRW 7.2 trillion in KOSPI stocks, marking a fundamental reversal from the persistent large-scale net outflows seen in previous months. This contributed to a significant narrowing of foreign net selling in July to KRW 9.8 trillion, down sharply from KRW 48.4 trillion in June and KRW 44.5 trillion in May. Simultaneously, domestic institutional pressure eased. South Korean pension funds and asset managers turned to a net buying position in July, purchasing KRW 1.0 trillion worth of KOSPI shares, contrasting with net sales in May and June. Market volatility is expected to be dampened by new financial regulations. Effective July 31, the Financial Services Commission tightened access for retail investors to single-stock leveraged ETFs by raising the minimum cash deposit requirement. Trading volumes for these products subsequently dropped to about 50% of their monthly average. Citigroup Research maintains its year-end KOSPI target of 10,000 points. The firm cites several supportive factors: the substantial easing of headwinds from capital outflows, a robust fundamental outlook for the semiconductor sector, historically low market valuations, strong economic fundamentals, and the potential for policy support from financial authorities if needed.

marsbit3h ago

Daily 7.2 Trillion KRW: Foreign Capital's Record Net Buying on Friday! Wall Street Says Headwinds for Korean Stock Fund Flows Have Subsided

marsbit3h ago

Thanks to Dice Rolls, Bitcoin Keys Are Stored Offline, But Not Everyone Will Do It

The article discusses using dice rolls to generate secure Bitcoin wallet seeds, providing entropy independent of potentially flawed hardware random number generators. It explains that each fair dice roll offers about 2.585 bits of entropy, with around 50 rolls needed for a standard 12-word seed phrase and 99+ recommended for higher security. This method gained attention after a vulnerability was revealed in some Coldcard hardware wallets, where a faulty firmware RNG (dating back to 2021) compromised generated keys. The analysis notes that while a dice-generated main seed was safe from this specific flaw, other Coldcard functions (like creating paper wallets, backup keys, or passwords) could still be vulnerable if they used the defective RNG. The piece argues that while dice-based entropy is technically robust, the manual process is error-prone, tedious, and unrealistic for most new users, who might make mistakes in recording or inputting rolls. It concludes that while manual entropy generation should remain an option for advanced users, the long-term goal is to develop reliable, user-friendly hardware and software that securely generates randomness without requiring specialized knowledge. Coldcard users are advised to check their firmware version and replace any secondary secrets (like paper wallet keys) created with vulnerable devices, while also considering multi-signature setups with devices from different manufacturers for added security.

cryptonews.ru9h ago

Thanks to Dice Rolls, Bitcoin Keys Are Stored Offline, But Not Everyone Will Do It

cryptonews.ru9h ago

Trading

Spot

Hot Articles

Discussions

Welcome to the HTX Community. Here, you can stay informed about the latest platform developments and gain access to professional market insights. Users' opinions on the price of S (S) are presented below.

活动图片

Top Questions

Hot Categoriesright-arrow

Hot Tagsright-arrow